. 2017 May 12;91(11):e00195-17.
doi: 10.1128/JVI.00195-17. Print 2017 Jun 1.

Heterologous Packaging Signals on Segment 4, but Not Segment 6 or Segment 8, Limit Influenza A Virus Reassortment

Affiliations

Heterologous Packaging Signals on Segment 4, but Not Segment 6 or Segment 8, Limit Influenza A Virus Reassortment

Maria C White et al. J Virol. .

Abstract

Influenza A virus (IAV) RNA packaging signals serve to direct the incorporation of IAV gene segments into virus particles, and this process is thought to be mediated by segment-segment interactions. These packaging signals are segment and strain specific, and as such, they have the potential to impact reassortment outcomes between different IAV strains. Our study aimed to quantify the impact of packaging signal mismatch on IAV reassortment using the human seasonal influenza A/Panama/2007/99 (H3N2) and pandemic influenza A/Netherlands/602/2009 (H1N1) viruses. Focusing on the three most divergent segments, we constructed pairs of viruses that encoded identical proteins but differed in the packaging signal regions on a single segment. We then evaluated the frequency with which segments carrying homologous versus heterologous packaging signals were incorporated into reassortant progeny viruses. We found that, when segment 4 (HA) of coinfecting parental viruses was modified, there was a significant preference for the segment containing matched packaging signals relative to the background of the virus. This preference was apparent even when the homologous HA constituted a minority of the HA segment population available in the cell for packaging. Conversely, when segment 6 (NA) or segment 8 (NS) carried modified packaging signals, there was no significant preference for homologous packaging signals. These data suggest that movement of NA and NS segments between the human H3N2 and H1N1 lineages is unlikely to be restricted by packaging signal mismatch, while movement of the HA segment would be more constrained. Our results indicate that the importance of packaging signals in IAV reassortment is segment dependent.IMPORTANCE Influenza A viruses (IAVs) can exchange genes through reassortment. This process contributes to both the highly diverse population of IAVs found in nature and the formation of novel epidemic and pandemic IAV strains. Our study sought to determine the extent to which IAV packaging signal divergence impacts reassortment between seasonal IAVs. Our knowledge in this area is lacking, and insight into the factors that influence IAV reassortment will inform and strengthen ongoing public health efforts to anticipate the emergence of new viruses. We found that the packaging signals on the HA segment, but not the NA or NS segments, restricted IAV reassortment. Thus, the packaging signals of the HA segment could be an important factor in determining the likelihood that two IAV strains of public health interest will undergo reassortment.

Keywords: evolution; influenza virus; packaging; reassortment; segment mismatch.


Figures

FIG 1
FIG 1
Chimeric IAV segments have the same protein coding regions but different packaging signal regions. HA, NA, and NS segments with either NL (H1N1) (A) or P99 (H3N2) (B) packaging signals were constructed around the P99 open reading frame (ORF) for that segment. Silent mutations were introduced into the packaging signal regions of the ORF so that packaging would be directed only by the sequences flanking the 3′ and 5′ ends of the ORF. Start codons within the added 3′ packaging signal region were mutated so that translation would result in the production of full-length wild-type protein. A variant (VAR) version of the construct in panel B was generated via silent nucleotide changes in the ORF (C). Segments are shown in positive sense for clarity. Chimeric segments were then cloned into the pDP2002 ambisense vector to allow for recovery of infectious virus from cDNA.
FIG 2
FIG 2
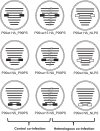
Viruses generated to evaluate the effects of packaging signal divergence on IAV reassortment. Viruses were rescued in a P99 background (black segments) with either P99 packaging signals (black boxes) or NL packaging signals (white boxes) on the HA, NA, or NS segments. Each virus contained one segment with modified packaging signals, and three viruses were rescued for each segment examined. Within each set of three viruses, one carried the silent VAR mutations that act as genetic tags for genotyping (gray x's), and the remaining two were WT (no genetic tags). Brackets indicate the virus pairs used for the control and heterologous coinfections. The same VAR virus was part of both virus pairings.
FIG 3
FIG 3
P99-based viruses with chimeric segments exhibited comparable growth phenotypes. Viruses containing chimeric HA (A), NA (B), or NS (C) segments were used to infect triplicate wells of MDCK cells at an MOI of 0.01 PFU/cell, and output titers over time were compared to the P99 wild-type (P99wt) control virus. Data are represented as means ± 1 SD. The limit of detection was 50 PFU/ml and is indicated by a dashed line.
FIG 4
FIG 4
Segments with different packaging signal regions were replicated with various efficiencies. MDCK cells were coinfected at a high MOI with P99-based viruses containing chimeric HA (A), NA (B), or NS (C) segments. RNA was extracted from both the inoculum (0 h p.i.) and the cells (12 h p.i.) and reverse transcribed into cDNA, which was used as the template in ddPCR with primers specific for the 3′ packaging signal region of each segment of interest. The copy number of each segment in the cells (output) was divided by the copy number of each segment in the inoculum (input). Data were analyzed using Student's t test. Data are represented as means ± 1 SD for 2 to 4 biological replicates performed in triplicate.
FIG 5
FIG 5
HA segments with matched packaging signals were preferentially incorporated into new virus particles. (A) MDCK cells were coinfected at a high MOI with P99-based viruses containing chimeric HA segments, and the genotypes of progeny viruses collected at 12 h p.i. after one cycle of replication were determined. The percentage of viruses that contained a WT segment (as opposed to VAR) is plotted on the y axis. The WT HA segment has matched packaging signals for the control coinfection (black bars) and mismatched packaging signals for the heterologous coinfection (gray bars). For all other segments, both WT and VAR contain matched packaging signals. *, P < 0.0001 compared to all other values using two-way ANOVA with Tukey's multiple comparisons. Data are represented as means ± 1 SD for two biological replicates performed in triplicate. (B) RT ddPCR was used to quantify the number of each HA segment available in the coinfected cells at 12 h p.i. using primers specific for the 3′ packaging signal region of each segment. The total number of HA copies in each well was calculated and graphed. Data are represented as means ± 1 SD.
FIG 6
FIG 6
NA segments with matched packaging signals were not significantly favored for incorporation. (A and C) MDCK cells were coinfected at a high MOI with P99-based viruses containing chimeric NA segments in either a 1:1 input ratio of VAR to WT (A) or a 1:1 input ratio of VAR to WT for the control coinfection and a 1:1.5 input ratio of VAR to WT for the heterologous coinfection (C). The genotypes of progeny viruses collected at 12 h p.i. after a single cycle of replication were then analyzed via HRM analysis. The percentage of viruses that contained a WT segment (as opposed to VAR) is plotted on the y axis. The WT NA segment has matched packaging signals for the control coinfection (black bars) and mismatched packaging signals for the heterologous coinfection (gray bars). For all other segments, both WT and VAR contain matched packaging signals. n.s., not significant using two-way ANOVA with Tukey's multiple comparisons. Data are represented as means ± 1 SD for two biological replicates performed in triplicate for each condition. The data sets used for the control coinfections in panels A and C are the same. (B and D) RT ddPCR was used to quantify the number of each NA segment available in the coinfected cells at 12 h p.i. using primers specific for the 3′ packaging signal region of each segment. The total number of NA copies in each well was calculated and graphed. Input ratio of VAR to WT, 1:1 (B) and 1:1.5 (D). Data are represented as means ± 1 SD.
FIG 7
FIG 7
NS segments with heterologous packaging signals assorted randomly. (A and C) MDCK cells were coinfected at a high MOI with P99-based viruses containing chimeric NS segments in either a 1:1 input ratio of VAR to WT (A) or a 1:1.25 input ratio of VAR to WT for the control coinfection and a 1:1.5 input ratio of VAR to WT for the heterologous coinfection (C). The genotypes of progeny viruses collected at 12 h p.i. after one cycle of replication were then analyzed via HRM analysis. The percentage of viruses that contained a WT segment (as opposed to VAR) is plotted on the y axis. The WT NS segment has matched packaging signals for the control coinfection (black bars) and mismatched packaging signals for the heterologous coinfection (gray bars). For all other segments, both WT and VAR contain matched packaging signals. n.s., not significant using two-way ANOVA with Tukey's multiple comparisons. Data are represented as means ± 1 SD for two biological replicates performed in triplicate for each condition. (B and D) RT ddPCR was used to quantify the number of each NS segment available in the coinfected cells at 12 h p.i. using primers specific for the 3′ packaging signal region of each segment. The total number of NS copies in each well was calculated and graphed. Input ratio of VAR to WT, 1:1 (B) and 1:1.5 (D). Data are represented as means ± 1 SD.

Similar articles

Cited by

References

    1. Shaw ML, Palese P. 2013. Orthomyxoviridae, p 1151–1185. In Knipe DM, Howley PM, Cohen JI, Griffin DE, Lamb RA, Martin MA, Racaniello VR, Roizman B (ed), Fields virology, 6th ed, vol 1 Lippincott Williams & Wilkins, Philadelphia, PA.
    1. Desselberger U, Nakajima K, Alfino P, Pedersen FS, Haseltine WA, Hannoun C, Palese P. 1978. Biochemical evidence that “new” influenza virus strains in nature may arise by recombination (reassortment). Proc Natl Acad Sci U S A 75:3341–3345. doi:10.1073/pnas.75.7.3341. - DOI - PMC - PubMed
    1. Kawaoka Y, Krauss S, Webster RG. 1989. Avian-to-human transmission of the PB1 gene of influenza A viruses in the 1957 and 1968 pandemics. J Virol 63:4603–4608. - PMC - PubMed
    1. Garten RJ, Davis CT, Russell CA, Shu B, Lindstrom S, Balish A, Sessions WM, Xu X, Skepner E, Deyde V, Okomo-Adhiambo M, Gubareva L, Barnes J, Smith CB, Emery SL, Hillman MJ, Rivailler P, Smagala J, de Graaf M, Burke DF, Fouchier RAM, Pappas C, Alpuche-Aranda CM, López-Gatell H, Olivera H, López I, Myers CA, Faix D, Blair PJ, Yu C, Keene KM, Dotson PD, Boxrud D, Sambol AR, Abid SH, St. George K, Bannerman T, Moore AL, Stringer DJ, Blevins P, Demmler-Harrison GJ, Ginsberg M, Kriner P, Waterman S, Smole S, Guevara HF, Belongia EA, Clark PA, Beatrice ST, Donis R, Katz J, Finelli L, Bridges CB, Shaw M, Jernigan DB, Uyeki TM, Smith DJ, Klimov AI, Cox NJ. 2009. Antigenic and genetic characteristics of swine-origin 2009 A(H1N1) influenza viruses circulating in humans. Science 325:197–201. doi:10.1126/science.1176225. - DOI - PMC - PubMed
    1. Kilbourne ED. 2006. Influenza pandemics of the 20th century. Emerg Infect Dis 12:9–14. doi:10.3201/eid1201.051254. - DOI - PMC - PubMed

Publication types

MeSH terms

Substances

LinkOut - more resources