

Conservative whole-organ scaling contrasts with highly labile suborgan scaling differences among compound eyes of closely related Formica ants
- PMID: 28331577
- PMCID: PMC5355196
- DOI: 10.1002/ece3.2695
Conservative whole-organ scaling contrasts with highly labile suborgan scaling differences among compound eyes of closely related Formica ants
Abstract
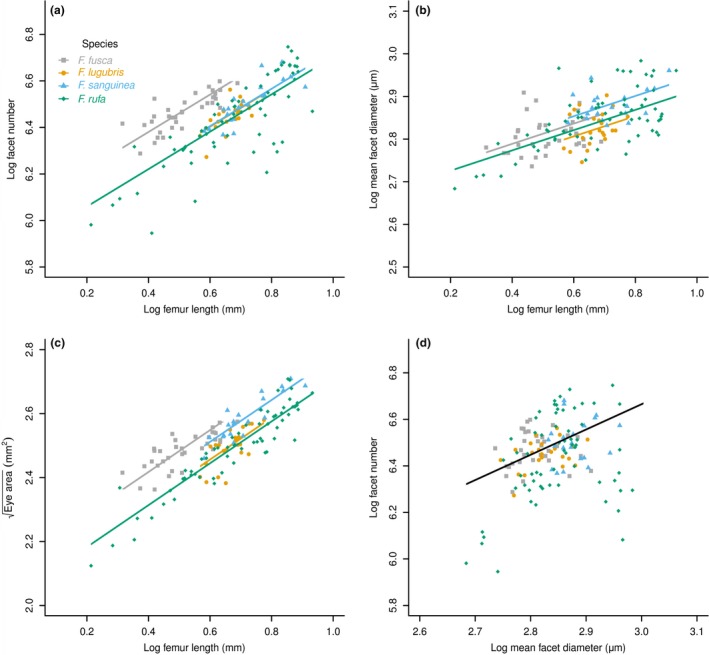
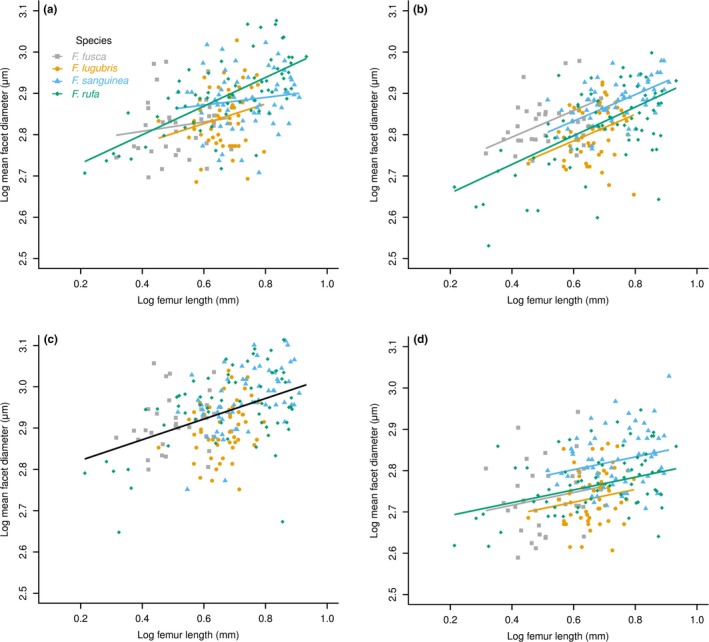
Static allometries determine how organ size scales in relation to body mass. The extent to which these allometric relationships are free to evolve, and how they differ among closely related species, has been debated extensively and remains unclear; changes in intercept appear common, but changes in slope are far rarer. Here, we compare the scaling relationships that govern the structure of compound eyes of four closely related ant species from the genus Formica. Comparison among these species revealed changes in intercept but not slope in the allometric scaling relationships governing eye area, facet number, and mean facet diameter. Moreover, the scaling between facet diameter and number was conserved across all four species. In contrast, facet diameters from distinct regions of the compound eye differed in both intercept and slope within a single species and when comparing homologous regions among species. Thus, even when species are conservative in the scaling of whole organs, they can differ substantially in regional scaling within organs. This, at least partly, explains how species can produce organs that adhere to genus wide scaling relationships while still being able to invest differentially in particular regions of organs to produce specific features that match their ecology.
Keywords: evolutionary allometry; facet; static allometry; wood ant.
Figures


References
-
- Bolstad, G. H. , Cassara, J. A. , Márquez, E. , Hansen, T. F. , van der Linde, K. , Houle, D. , & Pélabon, C. (2015). Complex constraints on allometry revealed by artificial selection on the wing of Drosophila melanogaster . Proceedings of the National Academy of Sciences of the United States of America, 112, 13284–13289. - PMC - PubMed
-
- Chown, S. L. , Marais, E. , Terblanche, J. S. , Klok, C. J. , Lighton, J. R. B. , & Blackburn, T. M. (2007). Scaling of insect metabolic rate is inconsistent with the nutrient supply network model. Functional Ecology, 21, 282–290.
-
- Cock, A. G. (1966). Aspects of metrical growth and form in animals. The Quarterly Review of Biology, 41, 131–190. - PubMed
-
- Collett, T. S. , & Land, M. F. (1975). Visual control of flight behaviour in the hoverfly Syritta pipiens L. Journal of Comparative Physiology A, 99, 1–66.
-
- Collingwood, C. A. (1979). The formicidae (Hymenoptera) of Fennoscandia and Denmark. Klampenborg, Denmark: Scandinavian Science Press.
LinkOut - more resources
Full Text Sources
Other Literature Sources
