

The plasma lipidome in acute myeloid leukemia at diagnosis in relation to clinical disease features
- PMID: 28331812
- PMCID: PMC5357680
- DOI: 10.1016/j.bbacli.2017.03.002
The plasma lipidome in acute myeloid leukemia at diagnosis in relation to clinical disease features
Abstract
Background: Early studies established that certain lipids were lower in acute myeloid leukemia (AML) cells than normal leukocytes. Because lipids are now known to play an important role in cell signaling and regulation of homeostasis, and are often perturbed in malignancies, we undertook a comprehensive lipidomic survey of plasma from AML patients at time of diagnosis and also healthy blood donors.
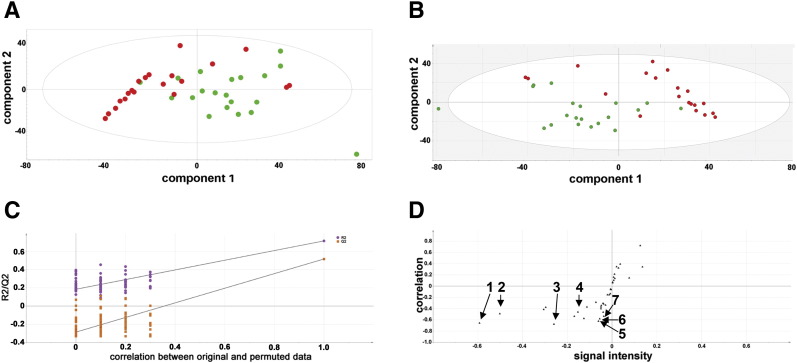
Methods: Plasma lipid profiles were measured using three mass spectrometry platforms in 20 AML patients and 20 healthy blood donors. Data were collected on total cholesterol and fatty acids, fatty acid amides, glycerolipids, phospholipids, sphingolipids, cholesterol esters, coenzyme Q10 and eicosanoids.
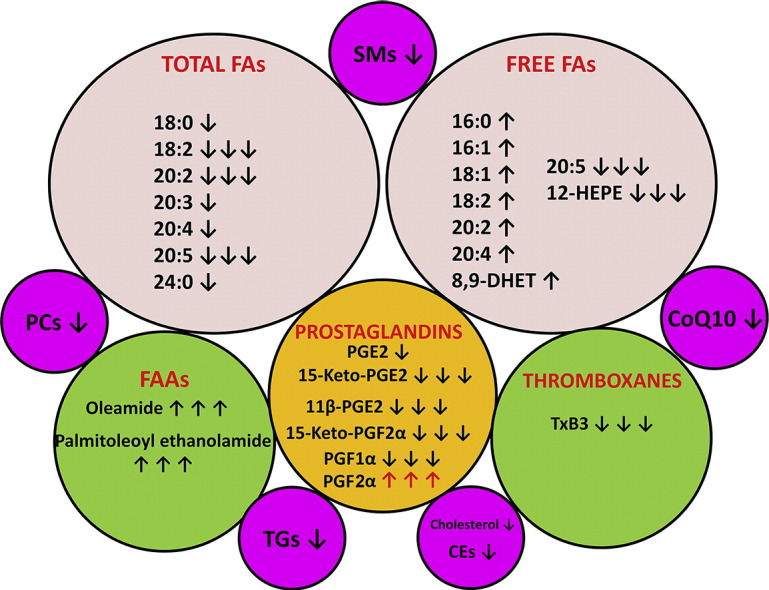
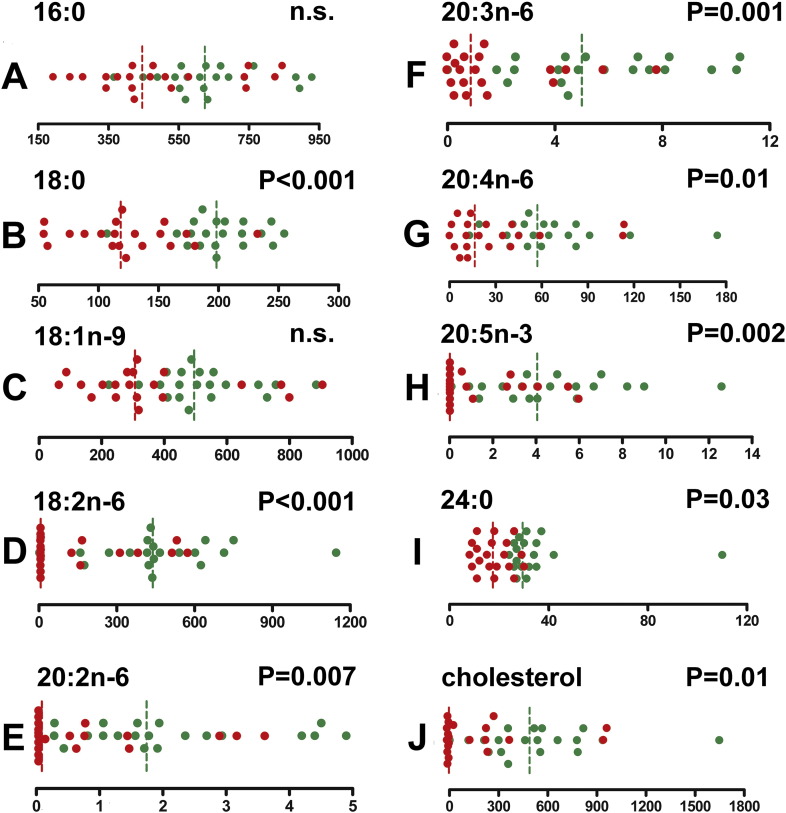
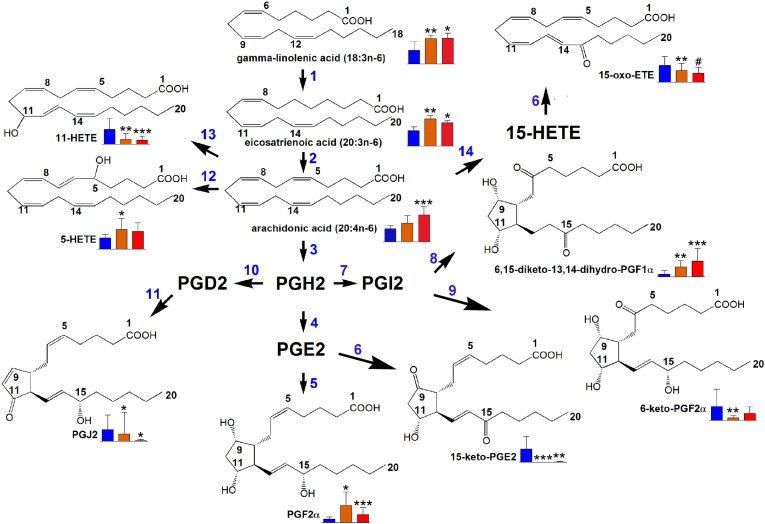
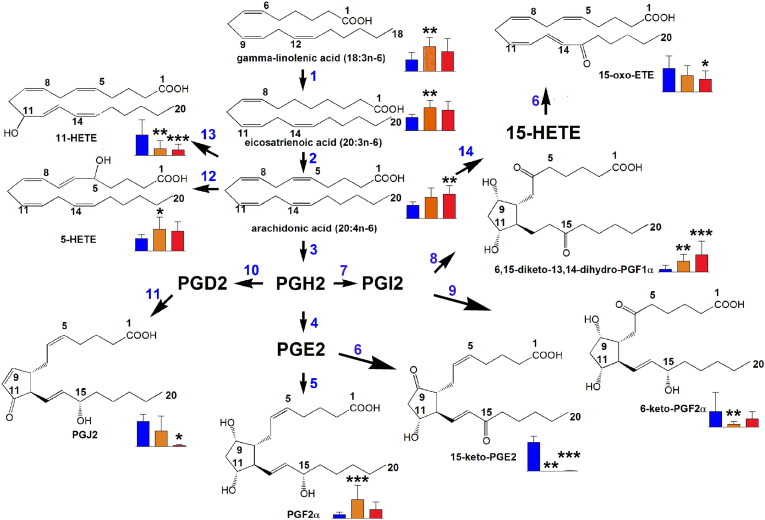
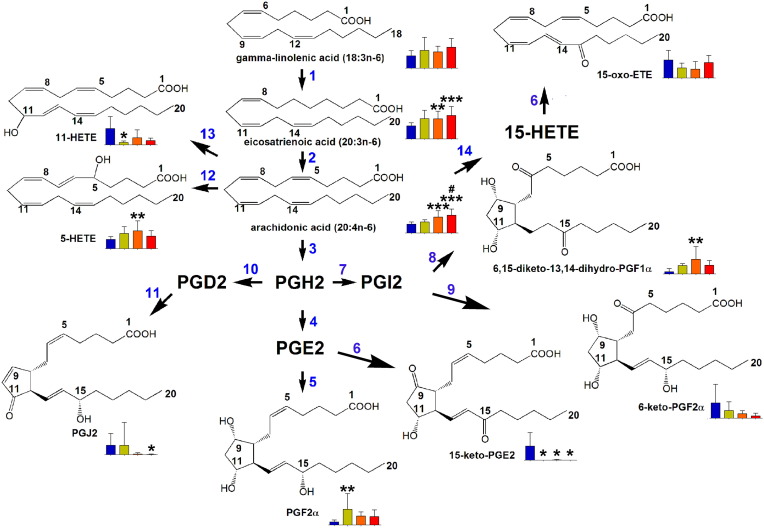
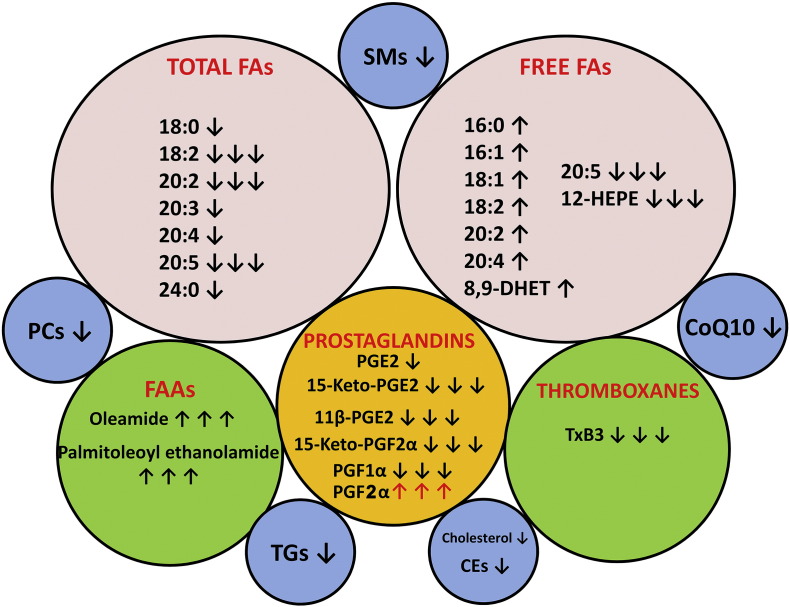
Results: We observed a depletion of plasma total fatty acids and cholesterol, but an increase in certain free fatty acids with the observed decline in sphingolipids, phosphocholines, triglycerides and cholesterol esters probably driven by enhanced fatty acid oxidation in AML cells. Arachidonic acid and precursors were elevated in AML, particularly in patients with high bone marrow (BM) or peripheral blasts and unfavorable prognostic risk. PGF2α was also elevated, in patients with low BM or peripheral blasts and with a favorable prognostic risk. A broad panoply of lipid classes is altered in AML plasma, pointing to disturbances of several lipid metabolic interconversions, in particular in relation to blast cell counts and prognostic risk.
Conclusions: These data indicate potential roles played by lipids in AML heterogeneity and disease outcome.
General significance: Enhanced catabolism of several lipid classes increases prognostic risk while plasma PGF2α may be a marker for reduced prognostic risk in AML.
Keywords: 12-HEPE, 12-hydroxy-5Z,8Z,10E,14Z,17Z-eicosapentaenoic acid; 12-LOX, 12-lipoxygenase; 2HG, (R)-2-hydroxyglutarate; 2OG, 2-oxoglutarate; 8,9-DHET, 8,9-dihydroxy-5Z,11Z,14Z-eicosatrienoic acid; AA, arachidonic acid; ALL, acute lymphoblastic leukemia; AML, acute myeloid leukemia; Acute myeloid leukemia; Blast cell number; CE, cholesterol ester; CML, chronic myelogenous leukemia; CPT1a, carnitine palmitate transferase 1a; Cer, ceramide; CoQ10, coenzyme Q10; DG, diacylglycerol; DGLA, dihomo-γ-linoleic acid; DIC, disseminated intravascular coagulation; EPA, eicosapentaenoic acid (20:5;5Z,8Z,11Z,14Z,17Z); ESI-, electrospray ionization negative mode; ESI +, electrospray ionization positive mode; Eicosanoids; FAA, fatty acid amide; FAB, French-American-British classification; FAME, fatty acid methyl ester; FAO, fatty acid oxidation; FLC-QqLIT-MS, fast liquid chromatography-quadrupole linear ion-trap mass spectrometry; Fatty acids; GCMS, gas chromatography–mass spectrometry; LPC, lysophosphatidylcholine; LPE, lysophosphatidylethanolamine; Lipidomics; MG, monoacylglycerol; MRM, multiple reactions monitoring; MUFA, monounsaturated fatty acid; OPLS-DA, orthogonal PLS-DA; PC, phosphatidylcholine; PCA, principal components analysis; PE, phosphatidylethanolamine; PGE2, prostaglandin E2; PGF1α, prostaglandin 1α; PGF2α, prostaglandin F2α; PGH2, prostaglandin H2; PLS-DA, projection to latent structures-discriminant analysis; POEA, palmitoleoyl ethanolamide; PUFA, polyunsaturated fatty acid; Prognostic risk; SCD1, stearoyl CoA desaturase 1; SM, sphingomyelin; TG, triacylglycerol (triglyceride); TxA2, thromboxane A2; TxB2, thromboxane B2; UPLC-ESI-QTOFMS, ultraperformance liquid chromatography-electrospray ionization-quadrupole time-of-flight mass spectrometry; mPGES-1, microsomal prostaglandin E synthase-1.
Figures
References
-
- Ruvolo P.P., Qiu Y., Coombes K.R., Zhang N., Neeley E.S., Ruvolo V.R., Hail N., Jr., Borthakur G., Konopleva M., Andreeff M., Kornblau S.M. Phosphorylation of GSK3alpha/beta correlates with activation of AKT and is prognostic for poor overall survival in acute myeloid leukemia patients. BBA Clin. 2015;4:59–68. - PMC - PubMed
-
- Gottfried E.L. Lipids of human leukocytes: relation to celltype. J. Lipid Res. 1967;8:321–327. - PubMed
-
- Snyder F., Wood R. Alkyl and alk-1-enyl ethers of glycerol in lipids from normal and neoplastic human tissues. Cancer Res. 1969;29:251–257. - PubMed
-
- Klock J.C., Pieprzyk J.K. Cholesterol, phospholipids, and fatty acids of normal immature neutrophils: comparison with acute myeloblastic leukemia cells and normal neutrophils. J. Lipid Res. 1979;20:908–911. - PubMed
-
- Usman H., Rashid R., Ameer F., Iqbal A., Zaid M., Hasnain S., Kalbacher H., Zaidi N. Revisiting the dyslipidemia associated with acute leukemia. Clin. Chim. Acta. 2015;444:43–49. - PubMed
LinkOut - more resources
Full Text Sources
Other Literature Sources
Research Materials
Miscellaneous
