Multicenter Study
. 2017 Jul;134(1):45-64.
doi: 10.1007/s00401-017-1696-8. Epub 2017 Mar 22.

Pathogenic implications of distinct patterns of iron and zinc in chronic MS lesions

Affiliations
Multicenter Study

Pathogenic implications of distinct patterns of iron and zinc in chronic MS lesions

Bogdan F Popescu et al. Acta Neuropathol. 2017 Jul.

Abstract

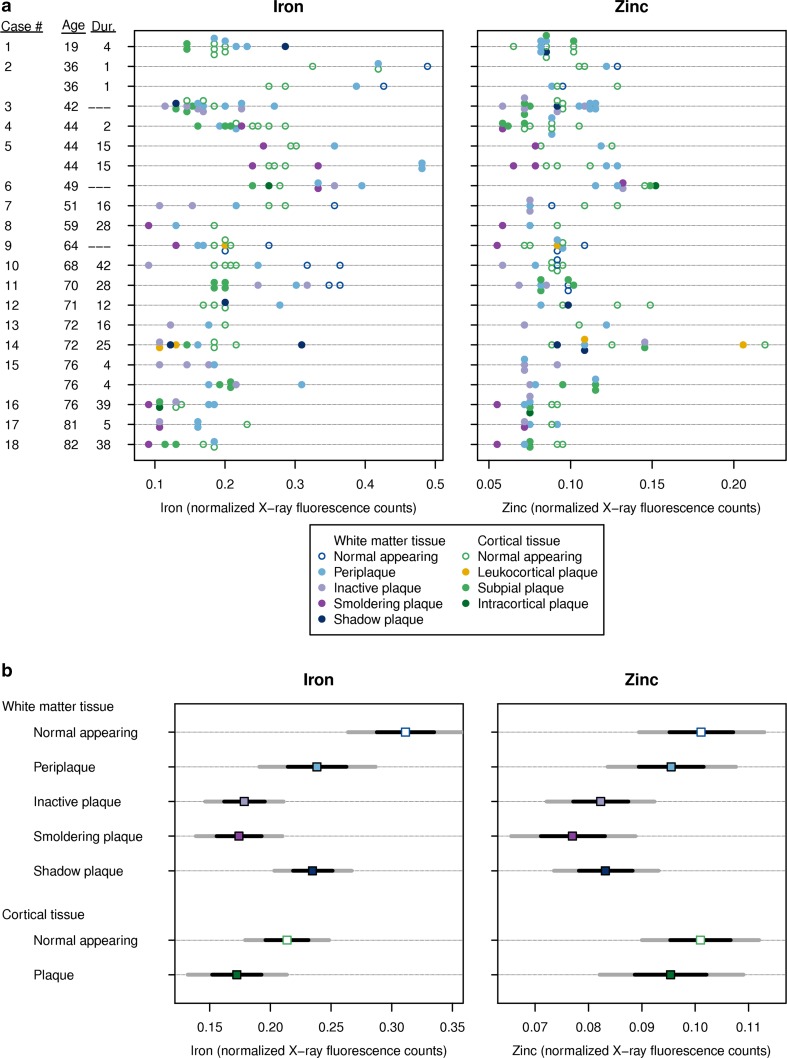
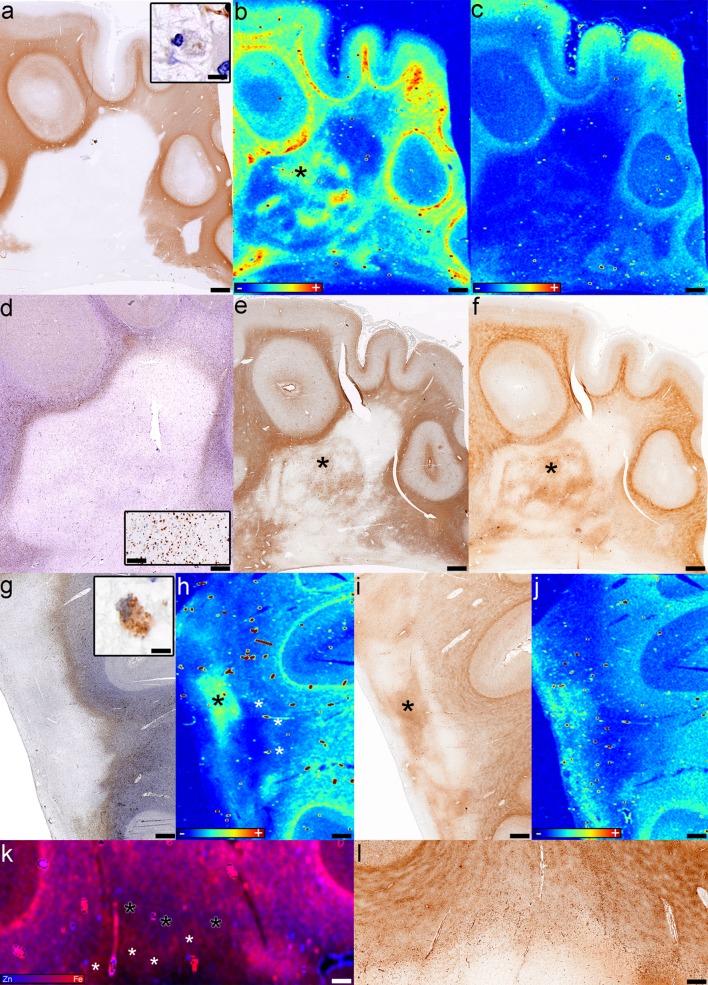
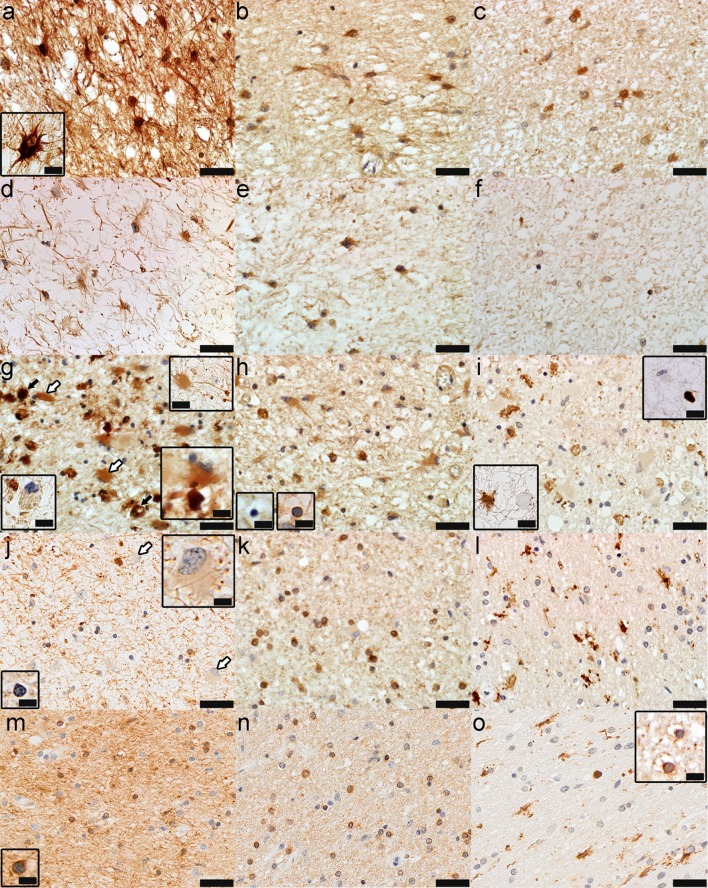
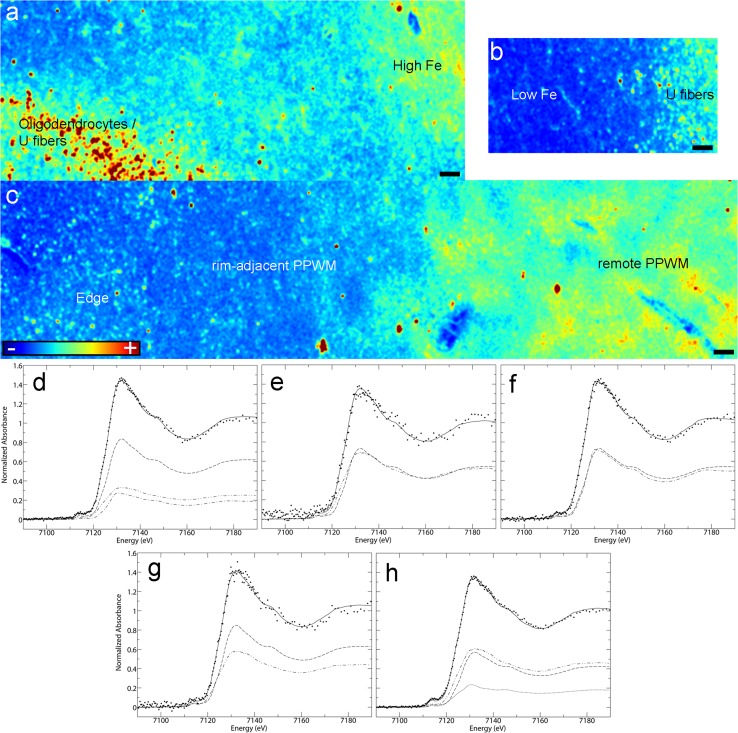
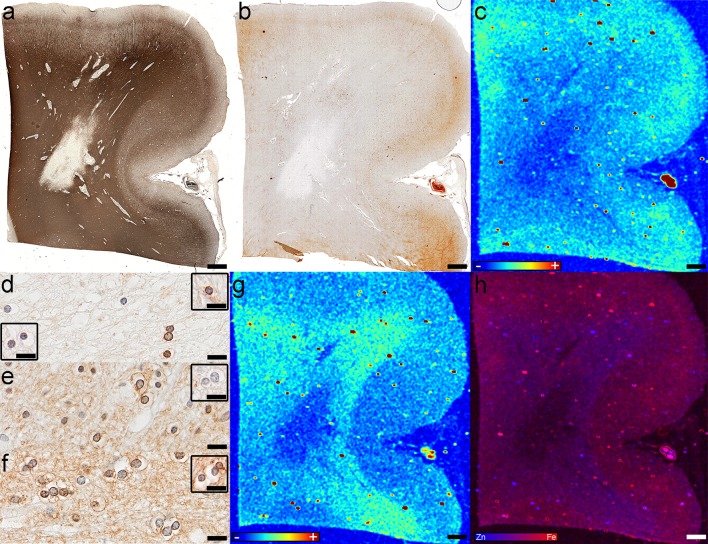
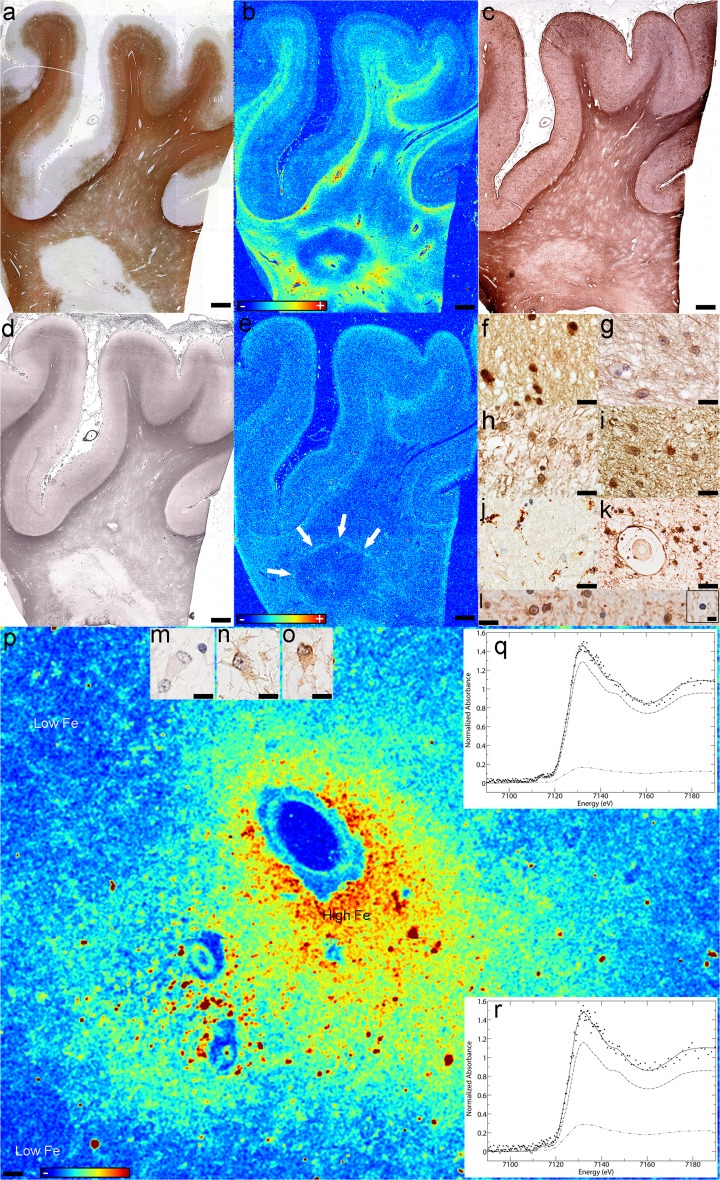
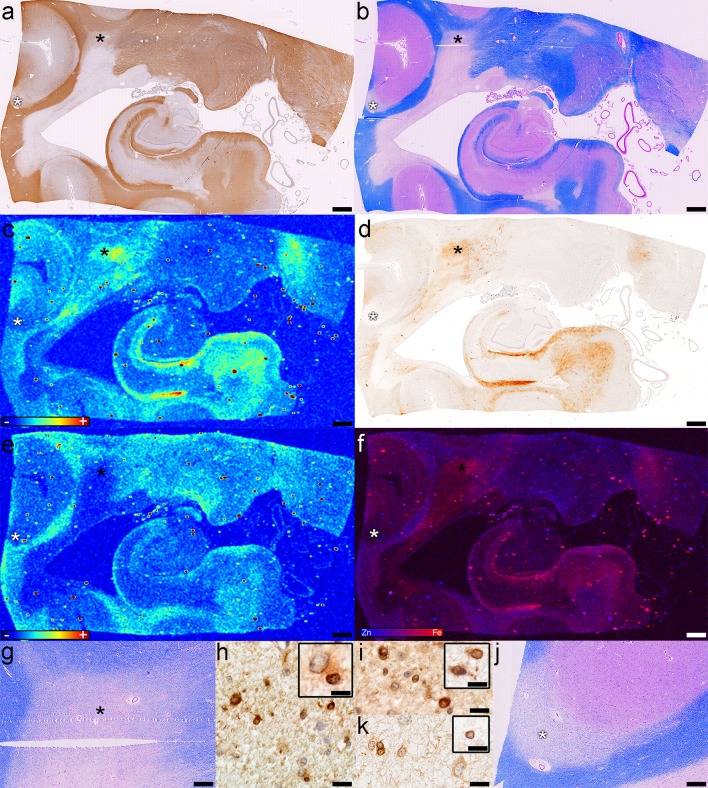
Multiple sclerosis (MS) is a chronic inflammatory demyelinating disease of the central nervous system (CNS) in which oligodendrocytes, the CNS cells that stain most robustly for iron and myelin are the targets of injury. Metals are essential for normal CNS functioning, and metal imbalances have been linked to demyelination and neurodegeneration. Using a multidisciplinary approach involving synchrotron techniques, iron histochemistry and immunohistochemistry, we compared the distribution and quantification of iron and zinc in MS lesions to the surrounding normal appearing and periplaque white matter, and assessed the involvement of these metals in MS lesion pathogenesis. We found that the distribution of iron and zinc is heterogeneous in MS plaques, and with few remarkable exceptions they do not accumulate in chronic MS lesions. We show that brain iron tends to decrease with increasing age and disease duration of MS patients; reactive astrocytes organized in large astrogliotic areas in a subset of smoldering and inactive plaques accumulate iron and safely store it in ferritin; a subset of smoldering lesions do not contain a rim of iron-loaded macrophages/microglia; and the iron content of shadow plaques varies with the stage of remyelination. Zinc in MS lesions was generally decreased, paralleling myelin loss. Iron accumulates concentrically in a subset of chronic inactive lesions suggesting that not all iron rims around MS lesions equate with smoldering plaques. Upon degeneration of iron-loaded microglia/macrophages, astrocytes may form an additional protective barrier that may prevent iron-induced oxidative damage.

Keywords: Astrocyte; Iron; Multiple sclerosis; Oligodendrocyte; Remyelination; Shadow plaque; Smoldering lesion; Synchrotron; Zinc.


Conflict of interest statement

Funding

This study was funded by the Canada Research Chairs Program (to BFP, GNG and IJP), Saskatchewan Health Research Foundation (to BFP), Biogen Idec (to BFP and CFL), and National Institutes of Health (to CFL). MT, RCA and SN were Fellows of the Canadian Institutes of Health Research Training grant in Health Research Using Synchrotron Techniques (CIHR-THRUST). MT was supported by a College of Medicine Graduate Scholarship, University of Saskatchewan and a Saskatchewan Innovation and Opportunity Scholarship, Government of Saskatchewan.

Conflict of interest

Dr. Popescu served as a speaker for Teva Innovation Canada, received honorarium for publishing in Continuum, received research support from the Saskatchewan Health Research Foundation and receives research support from the Canada Research Chairs program and Biogen Idec. Dr. Frischer was supported by the Austrian Science Fund (FWF Project J3508-B24) while conducting parts of this work. Dr. Metz reports grants from German Ministry for Education and Research (BMBF, ‘‘German Competence Network Multiple Sclerosis’’ (KKNMS), Pattern MS/NMO) and BiogenIdec as well as personal fees from BiogenIdec, Bayer Healthcare, TEVA, Serono and Novartis. Dr. Webb, Dr. Robinson, Dr. Adiele, Dr. Weigand, Mr. Fitz-Gibbon, Ms. Tham and Ms. Nehzati report no COI. Dr. Lassmann and Dr. Hametner receive research support from the Austrian Science Foundation and the Österreichische Nationalbank. Drs. George and Pickering receive research support from the Canada Research Chairs program, the Canadian Institutes of Health Research, the Natural Sciences and Engineering Research Council of Canada and from Chevron USA and have received support from the Saskatchewan Health Research Foundation and from Grand Challenges Canada. Dr. Pickering is on the Board of Directors of the Canada Foundation for Innovation and receives additional research support from the Government of Canada. Dr. Brück receives research support from Teva Pharma, Biogen Idec, Novartis, and personal fees from Teva Pharma, Biogen Idec, Novartis, Merck-Serono, Bayer Vital, Genzyme. Dr Parisi receives publishing royalties for Principles & Practice of Neuropathology, Ed 2. Dr. Lucchinetti receives research support from the National MS Society, Novartis, Biogen Idec, and Alexion Pharmaceuticals.

Figures

Fig. 1
Fig. 1
Iron and zinc in MS lesions; a Distribution of Fe and Zn normalized X-ray fluorescence values for each of the 21 blocks in the study. Each point represents one region of interest (ROI) on a particular block. The value displayed is the median metal divided by the incident X-ray beam intensity over the entire ROI multiplied by 100. The patient age at death (years) and disease duration (years) are provided on the y-axis, noting that three patients have two blocks; b Estimated metal content with 95% confidence interval (CI) (dark gray lines) and 68% CI (black lines) by plaque type. The two CIs represent ±2 SE and ±1 SE, respectively. Estimates were derived from linear mixed effects models
Fig. 2
Fig. 2
Fe and Zn in smoldering plaques. af Case 5, block 2 in Fig. 1a: a Demyelination is seen as lack of PLP immunoreactivity; inset shows macrophages in the smoldering rim containing myelin debris (PLP); b Fe accumulates in the inactive center of smoldering lesions (asterisk) (XFI); c The demyelinated lesion lacks Zn (XFI); d Macrophages/microglia accumulate at the edge of the smoldering lesion; inset shows higher magnification of the smoldering rim (CD68); e Reactive astrocytes and fibrillary gliosis are present in the inactive center (asterisk) (GFAP); f Fe accumulates within the inactive center of smoldering lesions (asterisk) (Fe histochemistry); gl Case 4 in Fig. 1a: g The rim of macrophages/microglia is seen at the smoldering plaque’s edge (CD68); inset shows that macrophages in the smoldering rim contain myelin debris (PLP); h Iron accumulates in the inactive center (black asterisk) and to a lesser extent in the rim (white asterisks) (XFI); i The Turnbull stain also shows iron accumulation in the inactive center (black asterisk) (Fe histochemistry); j Zn is located periventricularly (XFI); k The overlay of Fe and Zn shows the iron-accumulating rim of the smoldering plaque (white asterisks) and the iron-poor periplaque WM (black asterisks) (XFI); l The Turnbull stain does not show the iron-poor periplaque WM (Fe histochemistry); Scale bars aj 3 mm; Scale bars insets a, j 25 μm; Scale bar inset d 200 μm; Scale bars k, l 1 mm. Color scales b, c, h, j represent the normalized total Kα fluorescence counts, proportional to total metal present, from blue (lowest) to red (highest); Color scale k represents the overlay of the normalized total Fe and Zn Kα fluorescence counts, proportional to total metal present, from blue (Zn) to red (Fe)
Fig. 3
Fig. 3
The different subregions of smoldering plaques as defined by their iron content and metalloprotein expression (Case 4 in Fig. 1a). ac Iron-rich areas of the inactive center: Fe accumulates in astrocytes (a, Fe histochemistry) that express H-ferritin (b, FTH) and L-ferritin (c, FTL); df Iron-poor areas of the inactive center: astrocytes still accumulate iron but to a lesser extent (d, Fe histochemistry), express abundantly H-ferritin (e, FTH) but little L-ferritin (f, FTL); gi The smoldering rim: iron accumulates in dystrophic macrophages (black arrows, lower right inset) and reactive astrocytes (white arrows, lower and upper right insets), but not all macrophages accumulate Fe (lower left inset) (g, Fe histochemistry); dystrophic macrophages and reactive astrocytes are immunoreactive for H-ferritin (insets show iron-reactive and iron-negative apoptotic oligodendrocytes) (h, FTH); dystrophic macrophages, but not reactive astrocytes are immunoreactive for L-ferritin (lower left inset shows that reactive astrocytes, but not dystrophic macrophages are immunoreactive for GFAP, while the upper right inset shows that dystrophic macrophages, but not reactive astrocytes are immunoreactive for CD68) (i, FTL; lower left inset, GFAP; upper right inset, CD68); jl Rim-adjacent periplaque WM: iron is present in myelinated axons, but not oligodendrocytes (lower left inset) or reactive astrocytes (arrows and upper right inset) (j, Fe histochemistry); oligodendrocytes are immunoreactive for H-ferritin (k, FTH) and microglia for L-ferritin (l, FTL); mo Remote periplaque WM: oligodendrocytes (inset) and myelin stain intensely for iron (m, Fe histochemistry); oligodendrocytes are immunoreactive for H-ferritin (n, FTH) and L-ferritin (inset in o, FTL), and microglia for L-ferritin (o, FTL); Scale bar 100 μm; Inset scale bar 25 μm
Fig. 4
Fig. 4
Microprobe XFI and XANES analysis of smoldering lesions (Case 4 in Fig. 1a): ac Iron distribution in the various subregions of smoldering plaques (XFI); dh Quantitative analysis of Fe K-edge spectra. Each panel shows the normalized spectrum of brain tissue (spaced dotted lines) together with the best fit (continuous line). The fit components are scaled by their relative contributions: components are category as in Table 2. Each category has a unique line type: ferrihydrite (dashed line), goethite (single dotted dashed line), magnetite (closed dotted lines), heme (double dotted dashed line). See Table 2 for numerical results of the fits: d Iron-rich subregion of the inactive center; e Iron-poor subregion of the inactive center; f Smoldering rim; g Rim-adjacent periplaque WM; h Remote periplaque WM. Scale bar 90 μm; Color scales ac represent the normalized total Kα fluorescence counts, proportional to total metal present, from blue (lowest) to red (highest)
Fig. 5
Fig. 5
Iron and zinc in inactive lesions; Case 13 in Fig. 1a: a The demyelinated lesion is seen as the lack of myelin immunoreactivity (PLP); b Iron seems to be lost in the lesion and most periplaque WM (Fe histochemistry); c XFI shows that iron is lost in the demyelinated lesion, but gradually decreases in the periplaque WM from the normal appearing WM toward the lesion (XFI); d Oligodendrocytes are still present in lesions: some are immunoreactive for H-ferritin (FTH), and both L-ferritin-immunopositive (upper right inset; FTL) and L-ferritin-immunonegative (lower left inset; FTL) oligodendrocytes are observed; e Oligodendrocytes and myelinated axons are immunoreactive for H-ferritin (FTH) but not L-ferritin (inset, FTL) in the periplaque WM; f Oligodendrocytes and myelinated axons are immunoreactive for H-ferritin (FTH) and L-ferritin (inset; FTL) in the normal appearing WM; g Zn is lost in the demyelinated lesion (XFI); h Fe and Zn are both lost in inactive demyelinated lesions, while iron is decreased in the normal appearing WM (XFI). Scale bars ac, g, h 3 mm; Scale bars df 50 μm; Color scales c, g represent the normalized total Kα fluorescence counts, proportional to total metal present, from blue (lowest) to red (highest); Color scale h represents the overlay of the normalized total Fe and Zn Kα fluorescence counts, proportional to total metal present, from blue (Zn) to red (Fe)
Fig. 6
Fig. 6
Iron and zinc in iron accumulating inactive lesions. Case 11 in Fig. 1a: a The demyelinated lesion is seen as the lack of immunoreactivity for myelin (PLP); b Fe accumulates in a concentric pattern in the demyelinated lesion (XFI), and c co-localizes with areas of reactive astrocytosis (GFAP), but d not with axonal preservation (silver impregnation); e Zn is lost in most of the lesion, periplaque and normal appearing WM, except a region (arows) at the lesion’s edge (XFI); Reactive astrocytes f accumulate iron (Fe histochemistry), and are immunoreactive for: g GFAP (GFAP), h H-ferritin (FTH) and i L-ferritin (FTL). j Activated microglia are present within the iron-rich regions of the lesion but do not stain for iron (CD68); k Perivascular astrocytes and the glia limitans stain for iron in these iron rich areas (Fe histochemistry); l Both iron-positive and iron-negative (inset) oligodendrocytes are present in the normal appearing WM (Fe histochemistry); Astrocytes in the low-iron subregions of the inactive demyelinated lesions are m negative for iron (Fe histochemistry), n but immunoreactive for H-ferritin (FTH) and o L-ferritin (FTL); p Iron accumulates perivascularly in astrocytes (XFI); q, r Quantitative analysis of Fe K-edge spectra. Each panel shows the normalized spectrum of brain tissue (spaced dotted lines) together with the best fit (continuous line). The fit components are scaled by their relative contributions: components are category as in Table 2. Each category has a unique line type: ferrihydrite (dashed line), heme (double dotted dashed line). See Table 2 for numerical results of the fits: q Quantitative analysis of Fe K-edge spectra in iron rich regions; r Quantitative analysis of Fe K-edge spectra in iron-poor regions; Scale bars ae 3 mm; Scale bars fl 50 μm; Scale bars l inset, mo 12.5 μm; Scale bar p 90 μm; Color scales b, e, p represent the normalized total Kα fluorescence counts, proportional to total metal present, from blue (lowest) to red (highest)
Fig. 7
Fig. 7
Iron and zinc in shadow plaques (case 14 in Fig. 1a). The shadow plaques (asterisks) are seen as a milder immunoreactivity for myelin proteins (PLP), and b pale Luxol fast blue staining (LFB/PAS); c Fe accumulates in one (black asterisk in a and b) of the two shadow plaques, but not the other one (white asterisk in a and b)  (XFI); d The modified Turnbull stain shows a similar iron distribution (Fe histochemistry); e Zn is lost in the demyelinated lesion and shadow plaques (XFI); f The overlay of Fe and Zn shows the Fe accumulation in one of the two shadow plaques (XFI); g Higher magnification of the iron-accumulating (black asterisk in a and b) shadow plaque (Lfb/PAS); Oligodendrocytes with large nuclei are h positive for iron (Fe histochemistry), and i immunoreactive for H-ferritin (FTH) and L-ferritin (inset; FTL); j Higher magnification of the iron-poor (white asterisk in a and b) shadow plaque (Lfb/PAS); k Oligodendrocytes with normal sized nuclei in the iron-poor remyelinated lesion are immunoreactive for H ferritin (FTH) and L ferritin (inset; FTL); Scale bars af 3 mm; Scale bars g, j 500 μm; Scale bars h, i, k 20 μm; Color scales c, e represent the normalized total Kα fluorescence counts, proportional to total metal present, from blue (lowest) to red (highest); Color scale f represents the overlay of the normalized total Fe and Zn Kα fluorescence counts, proportional to total metal present, from blue (Zn) to red (Fe)

References

    1. Absinta M, Sati P, Schindler M, Leibovitch EC, Ohayon J, Wu T, Meani A, Filippi M, Jacobson S, Cortese IC et al (2016) Persistent 7-tesla phase rim predicts poor outcome in new multiple sclerosis patient lesions. J Clin Invest. doi:10.1172/JCI86198 - PMC - PubMed
    1. Andrews SC, Brady MC, Treffry A, Williams JM, Mann S, Cleton MI, de Bruijn W, Harrison PM. Studies on haemosiderin and ferritin from iron-loaded rat liver. Biol Met. 1988;1:33–42. doi: 10.1007/BF01128015. - DOI - PubMed
    1. Bagnato F, Hametner S, Welch EB. Visualizing iron in multiple sclerosis. Magn Reson Imaging. 2013;31:376–384. doi: 10.1016/j.mri.2012.11.011. - DOI - PMC - PubMed
    1. Bartzokis G, Lu PH, Tishler TA, Fong SM, Oluwadara B, Finn JP, Huang D, Bordelon Y, Mintz J, Perlman S. Myelin breakdown and iron changes in Huntington’s disease: pathogenesis and treatment implications. Neurochem Res. 2007;32:1655–1664. doi: 10.1007/s11064-007-9352-7. - DOI - PubMed
    1. Brown N, Alkhayer K, Clements R, Singhal N, Gregory R, Azzam S, Li S, Freeman E, McDonough J. Neuronal hemoglobin expression and its relevance to multiple sclerosis neuropathology. J Mol Neurosci. 2016;59:1–17. doi: 10.1007/s12031-015-0711-6. - DOI - PMC - PubMed

Publication types