Review
. 2017 Mar;47(Suppl 1):65-78.
doi: 10.1007/s40279-017-0688-0.

The 'Critical Power' Concept: Applications to Sports Performance with a Focus on Intermittent High-Intensity Exercise

Affiliations
Review

The 'Critical Power' Concept: Applications to Sports Performance with a Focus on Intermittent High-Intensity Exercise

Andrew M Jones et al. Sports Med. 2017 Mar.

Abstract

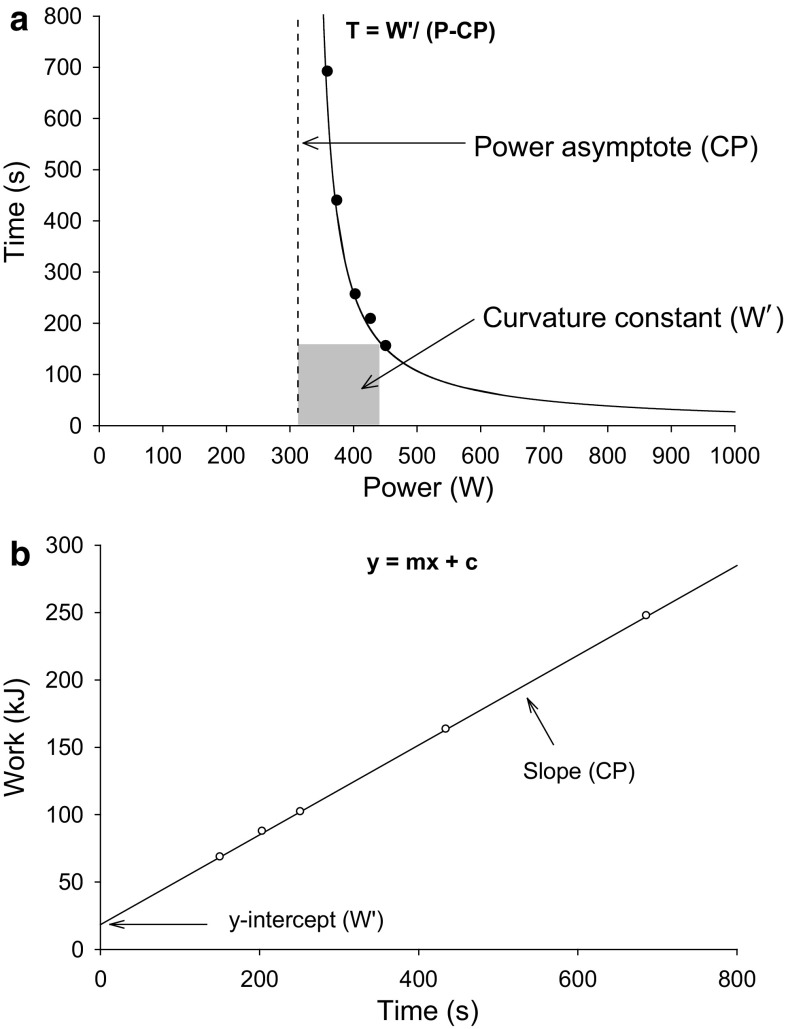
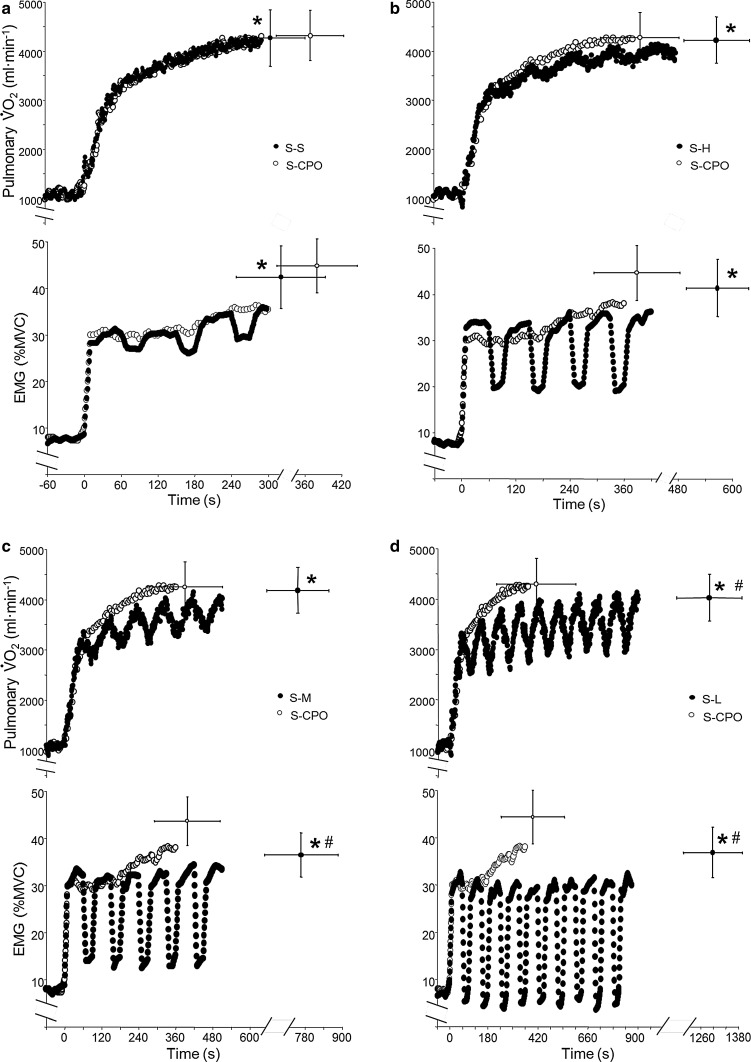
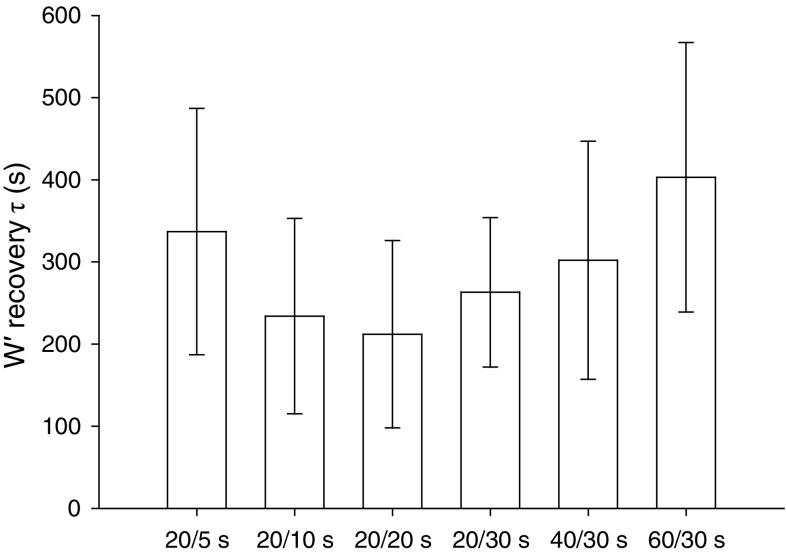
The curvilinear relationship between power output and the time for which it can be sustained is a fundamental and well-known feature of high-intensity exercise performance. This relationship 'levels off' at a 'critical power' (CP) that separates power outputs that can be sustained with stable values of, for example, muscle phosphocreatine, blood lactate, and pulmonary oxygen uptake ([Formula: see text]), from power outputs where these variables change continuously with time until their respective minimum and maximum values are reached and exercise intolerance occurs. The amount of work that can be done during exercise above CP (the so-called W') is constant but may be utilized at different rates depending on the proximity of the exercise power output to CP. Traditionally, this two-parameter CP model has been employed to provide insights into physiological responses, fatigue mechanisms, and performance capacity during continuous constant power output exercise in discrete exercise intensity domains. However, many team sports (e.g., basketball, football, hockey, rugby) involve frequent changes in exercise intensity and, even in endurance sports (e.g., cycling, running), intensity may vary considerably with environmental/course conditions and pacing strategy. In recent years, the appeal of the CP concept has been broadened through its application to intermittent high-intensity exercise. With the assumptions that W' is utilized during work intervals above CP and reconstituted during recovery intervals below CP, it can be shown that performance during intermittent exercise is related to four factors: the intensity and duration of the work intervals and the intensity and duration of the recovery intervals. However, while the utilization of W' may be assumed to be linear, studies indicate that the reconstitution of W' may be curvilinear with kinetics that are highly variable between individuals. This has led to the development of a new CP model for intermittent exercise in which the balance of W' remaining ([Formula: see text]) may be calculated with greater accuracy. Field trials of athletes performing stochastic exercise indicate that this [Formula: see text] model can accurately predict the time at which W' tends to zero and exhaustion is imminent. The [Formula: see text] model potentially has important applications in the real-time monitoring of athlete fatigue progression in endurance and team sports, which may inform tactics and influence pacing strategy.


Figures

Fig. 1
Fig. 1
a Hyperbolic relationship between power output (x-axis) and time (y-axis), where the critical power is indicated by the power-asymptote and the W′ is the curvature constant; b linearized two-parameter critical power model where total work done is plotted against time. In this permutation, the critical power is given by the slope of the regression and the W′ is the y-intercept. CP critical power, P power, T time, W′ curvature constant of power–time relationship
Fig. 2
Fig. 2
An example of the estimation of critical speed and D′ in Haile Gebrselassie, using the linear distance–time model. The distances modelled ranged from 2 km (4:56.1) to 15 km (41:38). Critical speed was 5.91 m s−1 and D′ was 351 m. CS critical speed, D′ curvature constant of speed–time relationship, R 2 coefficient of determination
Fig. 3
Fig. 3
Muscle phosphocreatine responses to constant power output severe-intensity exercise immediately followed by passive recovery (black circles), exercise <CP (white circles) or exercise >CP (white triangles). a End-recovery muscle [PCr] was lower in >CP and <CP recovery conditions compared with rest (p < 0.05). b End-recovery muscle [PCr] was significantly lower for >CP condition compared with rest and <CP recovery (p < 0.05). Figure has been re-drawn based on data from Chidnok et al. [44]. CP critical power, EXH exhaustion, [Pcr] phosphocreatine concentration
Fig. 4
Fig. 4
Relationships between W′ depletion and reconstitution with different recovery intensities during intermittent exercise: severe–heavy (dotted line), severe–moderate (dashed line), and severe–light (solid line). Figure has been re-drawn based on data from Chidnok et al. [48]. W′ curvature constant of power–time relationship
Fig. 5
Fig. 5
V˙O2 and EMG responses during severe constant power output (S-CPO) exercise and intermittent severe-intensity exercise with recovery power output (S-CWR) at severe (a), heavy (b), moderate (c), or light intensity (d). Open symbols represent responses during constant power output severe-intensity exercise and closed symbols represent responses when severe-intensity exercise is interspersed with recovery intervals in the severe (S–S), heavy (S–H), or moderate (S–M) domains and for light (20 W) exercise (S–L). *Time to exhaustion differed significantly from S-CWR (p < 0.05). # End-exercise V˙O2 and EMG was significantly lower than S–M and S–L (p < 0.05). Figure has been re-drawn based on data from Chidnok et al. [48]. EMG electromyogram, MVC maximal voluntary contraction, V˙O2 oxygen uptake
Fig. 6
Fig. 6
The influence of different work and recovery intervals during intermittent severe-intensity exercise on the time constant (τ) for W′ reconstitution. The mean ± standard deviation W′ recovery time constant tended to become shorter as the recovery duration separating 20-s work bouts was increased from 5 to 20 s. Conversely, the W′ recovery became progressively slower as the recovery duration was kept constant at 30 s, whereas the work duration was increased from 20 to 60 s. Figure re-drawn based on data from Skiba et al. [58]

References

    1. Hill AV. The physiological basis of athletic records. Nature. 1925;116:544–548. doi: 10.1038/116544a0. - DOI
    1. Monod H, Scherrer J. The work capacity of a synergic muscular group. Ergonomics. 1965;8:329–338. doi: 10.1080/00140136508930810. - DOI
    1. Moritani T, Nagata A, deVries HA, et al. Critical power as a measure of physical work capacity and anaerobic threshold. Ergonomics. 1981;24:339–350. doi: 10.1080/00140138108924856. - DOI - PubMed
    1. Poole DC, Ward SA, Gardner GW, et al. Metabolic and respiratory profile of the upper limit for prolonged exercise in man. Ergonomics. 1988;31:1265–1279. doi: 10.1080/00140138808966766. - DOI - PubMed
    1. Hughson RL, Orok CJ, Staudt LE. A high velocity treadmill running test to assess endurance running potential. Int J Sports Med. 1984;5:23–25. doi: 10.1055/s-2008-1025875. - DOI - PubMed