. 2017 Apr 12;9(14):12272-12281.
doi: 10.1021/acsami.7b00575. Epub 2017 Apr 3.

Oligonucleotide Sensor Based on Selective Capture of Upconversion Nanoparticles Triggered by Target-Induced DNA Interstrand Ligand Reaction

Affiliations

Oligonucleotide Sensor Based on Selective Capture of Upconversion Nanoparticles Triggered by Target-Induced DNA Interstrand Ligand Reaction

Diego Mendez-Gonzalez et al. ACS Appl Mater Interfaces. .

Abstract

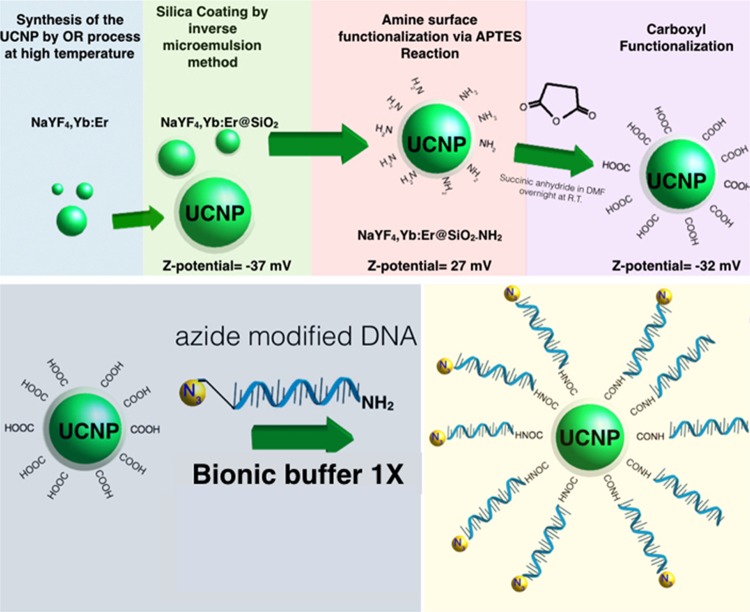
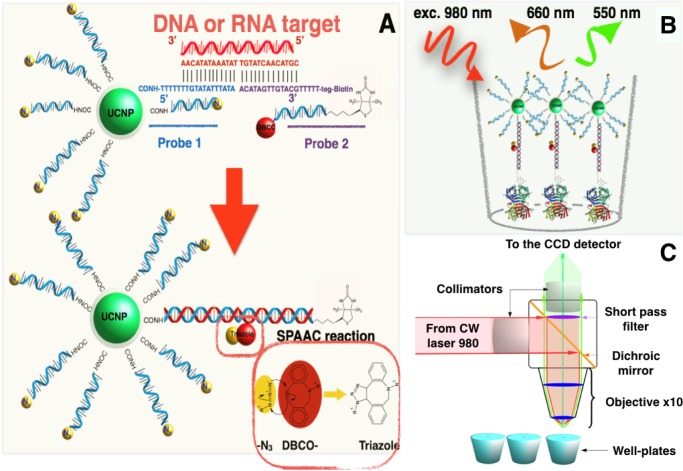
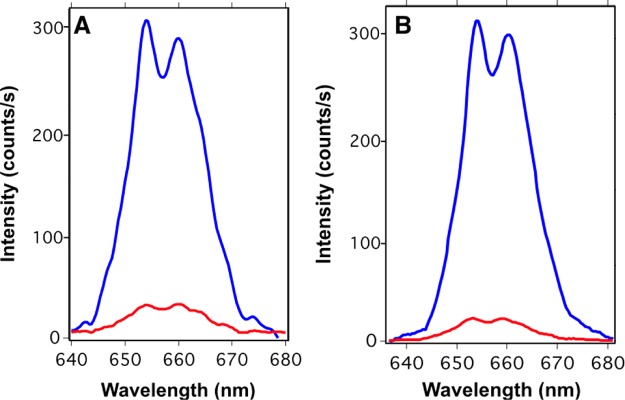
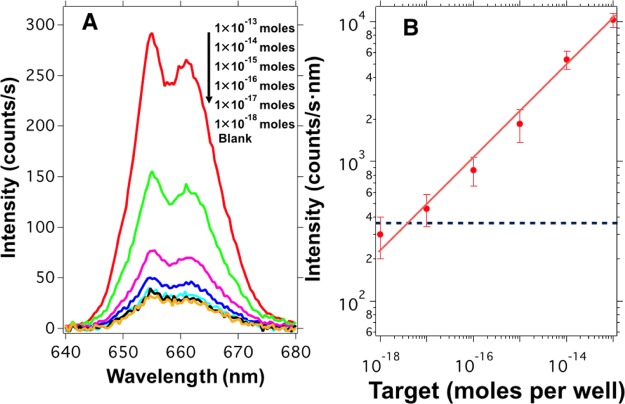
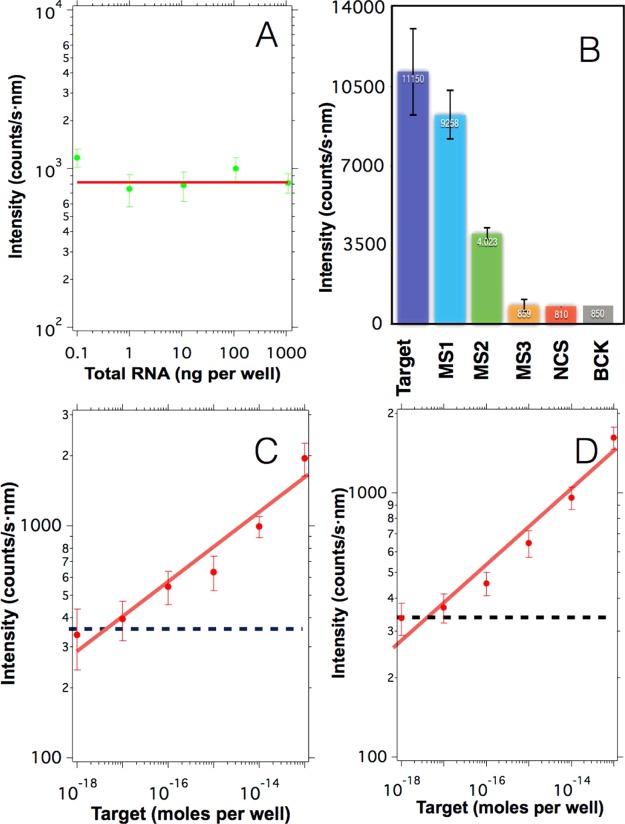
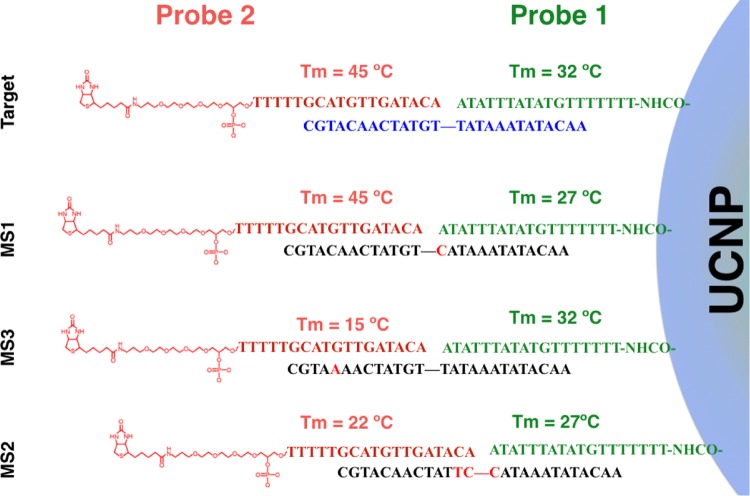
We present a sensor that exploits the phenomenon of upconversion luminescence to detect the presence of specific sequences of small oligonucleotides such as miRNAs among others. The sensor is based on NaYF4:Yb,Er@SiO2 nanoparticles functionalized with ssDNA that contain azide groups on the 3' ends. In the presence of a target sequence, interstrand ligation is possible via the click-reaction between one azide of the upconversion probe and a DBCO-ssDNA-biotin probe present in the solution. As a result of this specific and selective process, biotin is covalently attached to the surface of the upconversion nanoparticles. The presence of biotin on the surface of the nanoparticles allows their selective capture on a streptavidin-coated support, giving a luminescent signal proportional to the amount of target strands present in the test samples. With the aim of studying the analytical properties of the sensor, total RNA samples were extracted from healthy mosquitoes and were spiked-in with a specific target sequence at different concentrations. The result of these experiments revealed that the sensor was able to detect 10-17 moles per well (100 fM) of the target sequence in mixtures containing 100 ng of total RNA per well. A similar limit of detection was found for spiked human serum samples, demonstrating the suitability of the sensor for detecting specific sequences of small oligonucleotides under real conditions. In contrast, in the presence of noncomplementary sequences or sequences having mismatches, the luminescent signal was negligible or conspicuously reduced.

Keywords: DNA; interstrand ligation; nanoparticles; sensor; upconversion.


Conflict of interest statement

The authors declare no competing financial interest.

Figures

Scheme 1
Scheme 1. Schematic Illustration of the Chemical Route for the Synthesis and Functionalization of NaYF4:Yb,Er@SiO2-DNA-N3 Nanoparticles
Figure 1
Figure 1
TEM micrographs of the synthesized NaYF4;Yb,Er nanoparticles (A) and NaYF4;Yb,Er@SiO2 nanoparticles (B). (C) HRTEM image of a NaYF4;Yb,Er@SiO2 nanoparticle. (D) Magnification of the image in (C). The scale bars in (A) and (B) are 50 nm, whereas in (C) and (D) they are 10 and 5 nm, respectively.
Scheme 2
Scheme 2. Schematic Illustration of the Action Mechanism of the Proposed Sensor
(A) The presence of the target sequence allows the hybridization and brings in close proximity the azide group on probe 1 and the DBCO groups on probes 1 and 2 producing the SPAAC reaction that gives NaYF4;Yb,Er@SiO2-dsDNA-biotin nanoparticles. (B) Biotin moieties on the surface of the UCNPs allow their immobilization on the surface of the streptavidin-coated well-plates. (C) The fluorescence detection was performed using the homemade device.
Figure 2
Figure 2
Luminescence spectra obtained from NaYF4;Yb,Er@SiO2-ssDNA-N3 and DBCO-ssDNA-biotin able to produce interstrand ligation (blue line) and NaYF4;Yb,Er@SiO2-ssDNA-N3 and ssDNA-biotin, which are unable to produce interstrand ligation (red line), in the presence of 10–13 moles per well (1 nM) of target sequence and after washing the solid support with 10 mM of HEPES buffer and different concentrations of NaCl at 50 °C: 150 mM in (A) and 50 mM in (B).
Figure 3
Figure 3
(A) Time evolution of the upconversion signal on the streptavidin-coated well-plate during the incubation process. The blue points correspond to the signal measured after incubating the biotin-functionalized UCNPs obtained from hybridization with 1 μg of probe 1 and 2 × 10–12 moles of probe 2 with 10–12 moles (10 nM) of target sequence per well. The red points represent the signal of the blank samples using the same procedure described before but without the target sequence. (B) Signal-to-background ratio (left axis) and signal-to-noise ratio (right axis) as a function of incubation time.
Figure 4
Figure 4
(A) Upconversion emission spectra collected from the multiwell-plate after being incubated with biotin-functionalized upconversion nanoparticles produced by hybridization with different amounts of target sequences. (B) Upconversion intensity collected from the multiwell-plate as a function of target concentration from 1 × 10–18 to 1 × 10–13 moles per well (10 fM to 1 nM). The signal intensity is blank subtracted. The error bars are the standard deviation obtained from measurements at 10 different positions on each well out of three independent samples for each target concentration. The blue dashed line indicates the LOD based on 3-fold SD of the blank samples.
Figure 5
Figure 5
A) Upconversion emission obtained from blank samples prepared in the presence of different amounts of total RNA from healthy mosquitoes and in the absence of target sequences. The red line indicates the average value 830 counts/s nm. (B) Upconversion emission obtained after hybridizing 1 μg of upconversion nanoparticles with 10–12 moles per well of different sequences: full complementary sequences (Target), a sequence containing a single mismatch in the middle (MS1), a sequence containing three mismatches in the middle (MS2), a sequence containing a single mismatch in the first quarter of the strand (MS3), noncomplementary sequences (NCS), and in the absence of target sequences (BCK). The error bars indicate the standard deviation obtained from the experiments. (C) Upconversion intensity obtained after spiking samples containing 100 ng of total RNA with varying concentrations of target sequences. (D) Upconversion intensity obtained after spiking samples containing human serum with varying concentrations of target sequences. The intensities in (C) and (D) were blank subtracted and the blue dashed line indicates the threshold resulting from three times the standard deviation of the control signal. In all graphs, the error bars indicate the standard deviation.
Scheme 3
Scheme 3. Graphical Representation of the Possible Duplexes Formed
The mismatches bases are colored in red. Melting temperatures (Tm) of probes 1 and 2 with the target DNA and the mismatches DNA sequences were calculated using IDT SciTools.

References

    1. Fire A.; Xu S.; Montgomery M. K.; Kostas S. A.; Driver S. E.; Mello C. C. Potent and Specific Genetic Interference by Double-Stranded RNA in Caenorhabditis elegans. Nature 1998, 391, 806–811. 10.1038/35888. - DOI - PubMed
    1. Hess A. M.; Prasad A. N.; Ptitsyn A.; Ebel G. D.; Olson K. E.; Barbacioru C.; Monighetti C.; Campbell C. L. Small RNA Profiling of Dengue Virus-Mosquito Interactions Implicates the PIWI RNA Pathway in Anti-Viral Defense. BMC Microbiol. 2011, 11, 45.10.1186/1471-2180-11-45. - DOI - PMC - PubMed
    1. Lopez J. P.; Diallo A.; Cruceanu C.; Fiori L. M.; Laboissiere S.; Guillet I.; Fontaine J.; Ragoussis J.; Benes V.; Turecki G.; Ernst C. Biomarker Discovery: Quantification of microRNAs and Other Small Non-Coding RNAs Using next Generation Sequencing. BMC Med. Genomics 2015, 8, 35.10.1186/s12920-015-0109-x. - DOI - PMC - PubMed
    1. Gilad S.; Meiri E.; Yogev Y.; Benjamin S.; Lebanony D.; Yerushalmi N.; Kushnir M.; Cholakh H.; Melamed N.; Bentwich Z.; Hod M.; Goren Y.; Chajut A. Serum MicroRNAs Are Promising Novel Biomarkers. PLoS One 2008, 3, e314810.1371/journal.pone.0003148. - DOI - PMC - PubMed
    1. Calin G. A.; Croce C. M. MicroRNA Signatures in Human Cancers. Nat. Rev. Cancer 2006, 6, 857–866. 10.1038/nrc1997. - DOI - PubMed