. 2017 Mar 23:7:44938.
doi: 10.1038/srep44938.

Inertial bioluminescence rhythms at the Capo Passero (KM3NeT-Italia) site, Central Mediterranean Sea

Collaborators, Affiliations

Inertial bioluminescence rhythms at the Capo Passero (KM3NeT-Italia) site, Central Mediterranean Sea

J Aguzzi et al. Sci Rep. .

Abstract

In the deep sea, the sense of time is dependent on geophysical fluctuations, such as internal tides and atmospheric-related inertial currents, rather than day-night rhythms. Deep-sea neutrino telescopes instrumented with light detecting Photo-Multiplier Tubes (PMT) can be used to describe the synchronization of bioluminescent activity of abyssopelagic organisms with hydrodynamic cycles. PMT readings at 8 different depths (from 3069 to 3349 m) of the NEMO Phase 2 prototype, deployed offshore Capo Passero (Sicily) at the KM3NeT-Italia site, were used to characterize rhythmic bioluminescence patterns in June 2013, in response to water mass movements. We found a significant (p < 0.05) 20.5 h periodicity in the bioluminescence signal, corresponding to inertial fluctuations. Waveform and Fourier analyses of PMT data and tower orientation were carried out to identify phases (i.e. the timing of peaks) by subdividing time series on the length of detected inertial periodicity. A phase overlap between rhythms and cycles suggests a mechanical stimulation of bioluminescence, as organisms carried by currents collide with the telescope infrastructure, resulting in the emission of light. A bathymetric shift in PMT phases indicated that organisms travelled in discontinuous deep-sea undular vortices consisting of chains of inertially pulsating mesoscale cyclones/anticyclones, which to date remain poorly known.


Conflict of interest statement

The authors declare no competing financial interests.

Figures

Figure 1
Figure 1. Time series of PMT readings for the 8 sampling floors of the telescope tower, as recorded during the entire testing period of June 2013.
Floor no. 5 has been plotted together with its displacement time series, to underline differences in amplitude between the 1st (3–16th of June) and the 2nd period (17–30th of June). It should be noticed that the light emitted by 40K decay is around 45–50 kHz, so bioluminescence readings are above that background threshold. Short period gaps in data sets are due to failure in data acquisition. Also, the presence of sparse outlier peaking values, sometimes several orders of magnitude larger than most other data points, should be noted.
Figure 2
Figure 2. Percentages of bioluminescence bursts for each defined intensity range at each floor depth: white 50–100 (white); 100–150 (grey); and >150 kHz (black).
Y-axis: numbers from 1 to 8 are floors and relative depth is reported in parenthesis.
Figure 3
Figure 3
Waveform analysis outputs for data sets in bioluminescence for the 1st (3–16th) and 2nd (17–30th) period (A and B, respectively) of testing in June 2013, indicating the occurrence of temporally coherent peaking over the inertial day (i.e. time series subdivided into 123 sub-segments, as equivalent to 1230 min, according to periodogram analysis outputs). Waveforms are shown with associated standard errors. Horizontal dashed lines (starting from large crosses on the Y-axis) are the MESORs, defining peak temporal amplitudes, and also used as a proxy of overall mean bioluminescence (see Table 1).
Figure 4
Figure 4. Waveform analysis output coupling of bioluminescence (black) phase (i.e. peak timing) with floor (grey) orientation (left) and rate of displacement (right).
Data are shown with associated standard errors and Fourier curves (in black for PMT data and in red for floor orientation and rate of displacement). Following Fig. 4, we reported here PMT waveforms for floor no. 7 (depth: 3109 m) for the 1st (3–16th) and 2nd (17–30th) period (A and B, respectively) of June 2013. That analysis can be used as a proxy of the effect of currents on bioluminescence stimulation, based on the collision of pelagic animals against the telescope tower infrastructure.
Figure 5
Figure 5. Phases’ relationship chart showing the amplitude of all waveform peaks for PMT (one per floor) and floor information (orientation and rate of displacement), as proxies of speed and angular direction, plotted together in relation to the inertial day-length (i.e. the time is in 10 min units, equivalent to time series sub-segments of 1230 min length).
Oblique dashed grey lines are the visual fitting connecting waveform peak onsets and offsets though the floors.
Figure 6
Figure 6
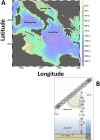
Location (red dot) and bathymetry (A) of the Capo Passero Site, hosting the KM3NeT-Italia neutrino telescope, in the Central Mediterranean (the red dot indicates the coordinates of the prototype NEMO Phase 2 tower, Ionian Sea South-East of Sicily at 36° 16′N, 16° 06′E). The map was produced with Ocean Data View, ODV 4.7.8. Telescope tower structure (B) reporting the eight-floor (F) positioning and the arm holding the 2 photomultipliers (PMT) at its extremes. That drawing was produced by the KM3-Net Italy Consortium.

References

    1. Robison B. H. Deep pelagic biology. J. Exp. Mar. Biol. Ecol. 300, 253–272 (2004).
    1. Widder E. A. Bioluminescence and the pelagic visual environment. Mar. Freshwat. Behav. Physiol. 35, 1–26 (2002).
    1. Aguzzi J. & Company J. B. Chronobiology of deep-water decapod crustaceans on continental margins. Adv. Mar. Biol. 58, 155–225 (2010). - PubMed
    1. Haddock S. H. D., Moline M. A. & Case J. F. Bioluminescence in the sea. Ann. Rev. Mar. Sci. 2, 443–493 (2010). - PubMed
    1. Aguzzi J. et al.. Activity rhythms in the deep-sea: a chronobiological approach. Front. Biosci. 16, 131–150 (2011). - PubMed

LinkOut - more resources