

Cell cycle arrest and biochemical changes accompanying cell death in harmful dinoflagellates following exposure to bacterial algicide IRI-160AA
- PMID: 28332589
- PMCID: PMC5362807
- DOI: 10.1038/srep45102
Cell cycle arrest and biochemical changes accompanying cell death in harmful dinoflagellates following exposure to bacterial algicide IRI-160AA
Abstract
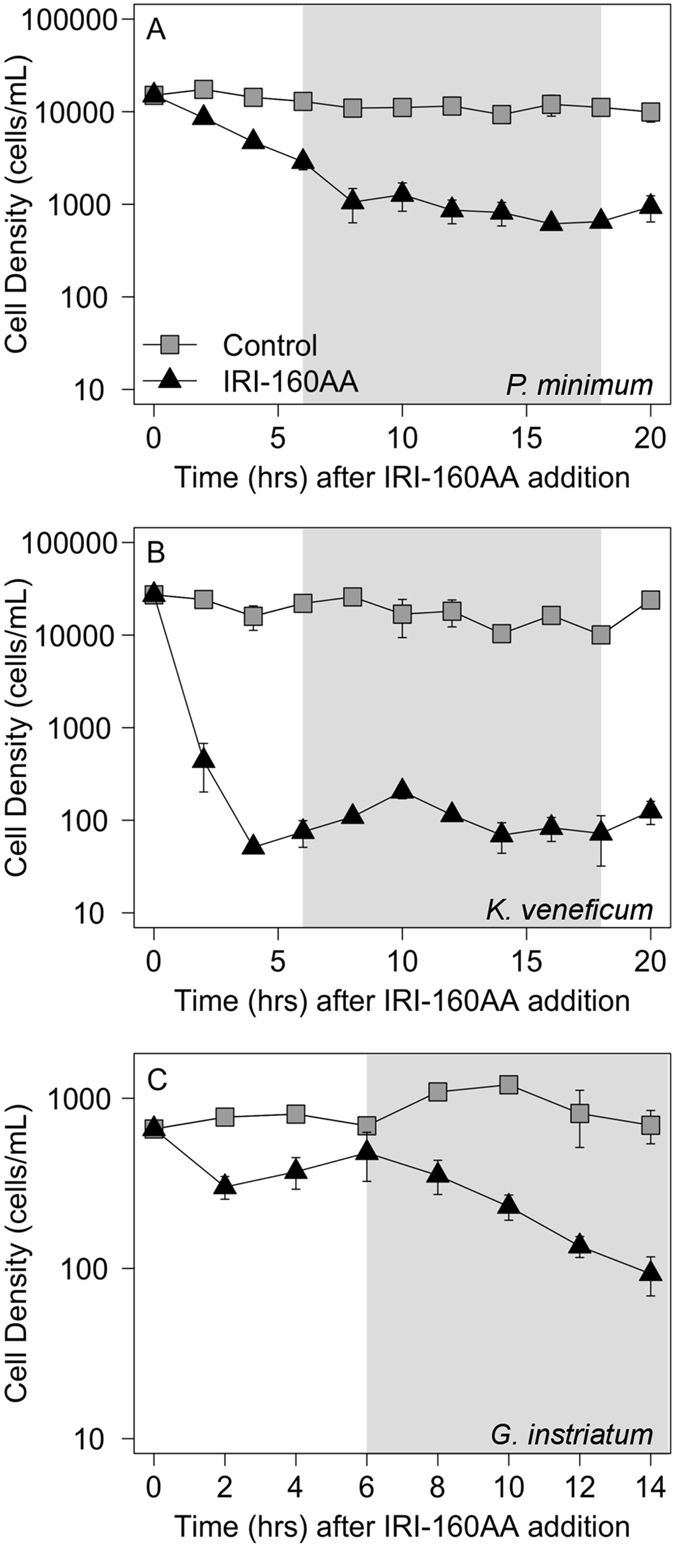
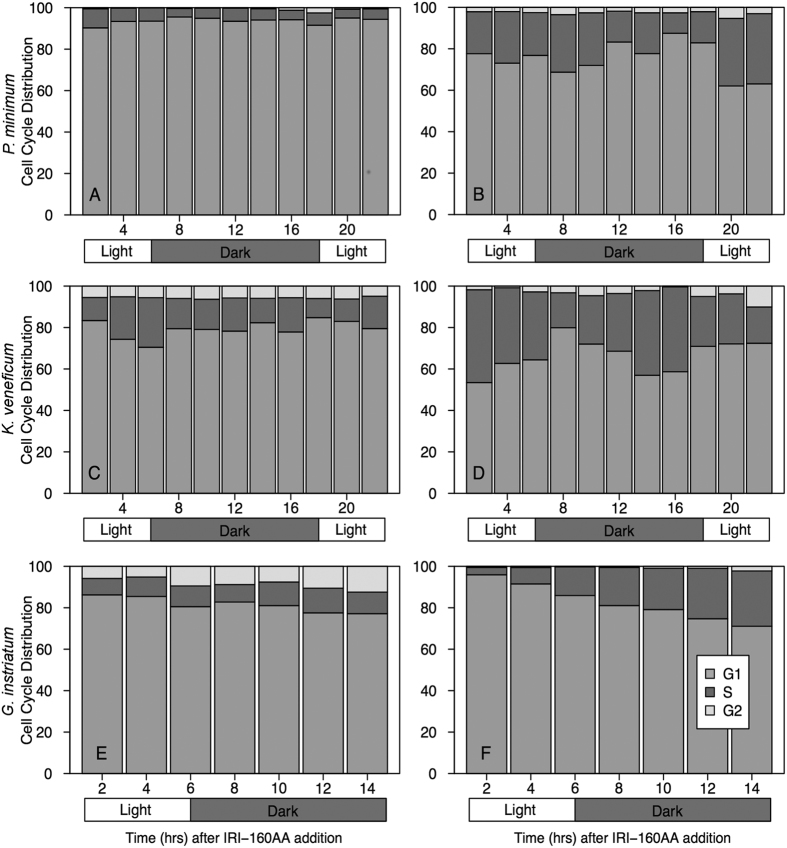
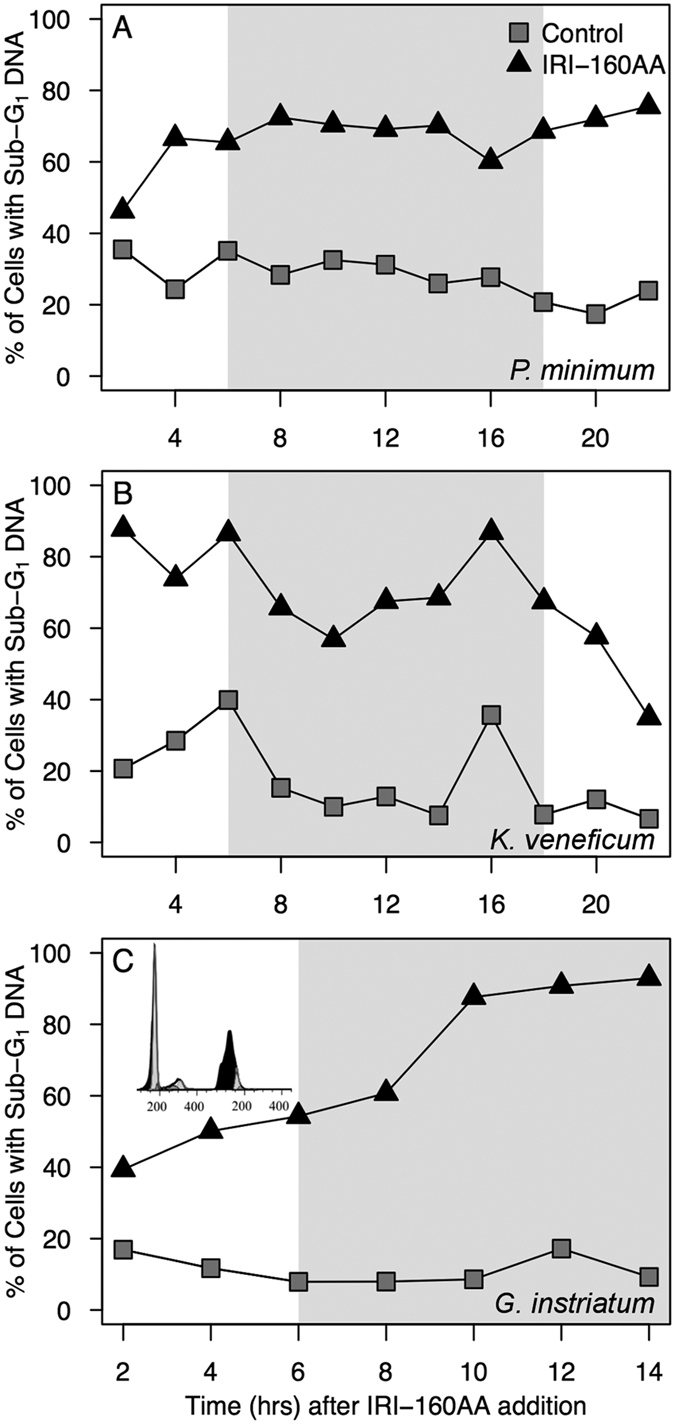
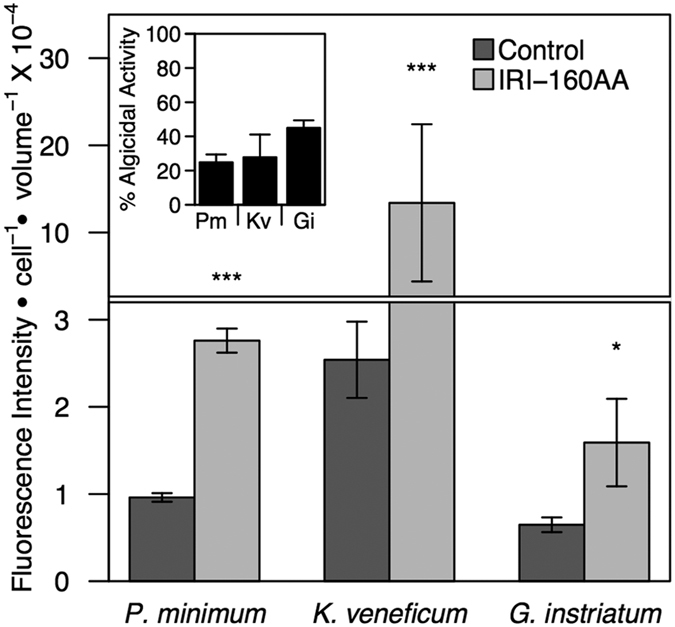
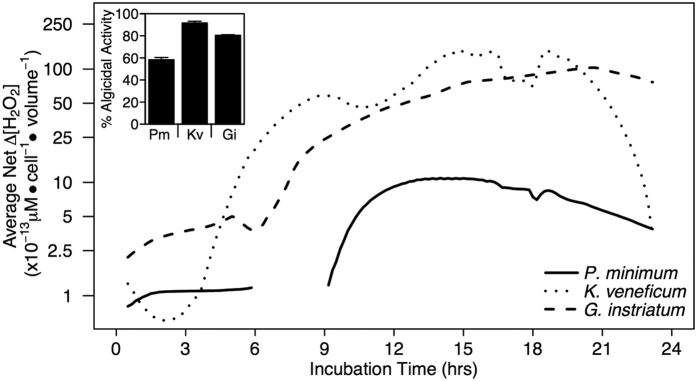
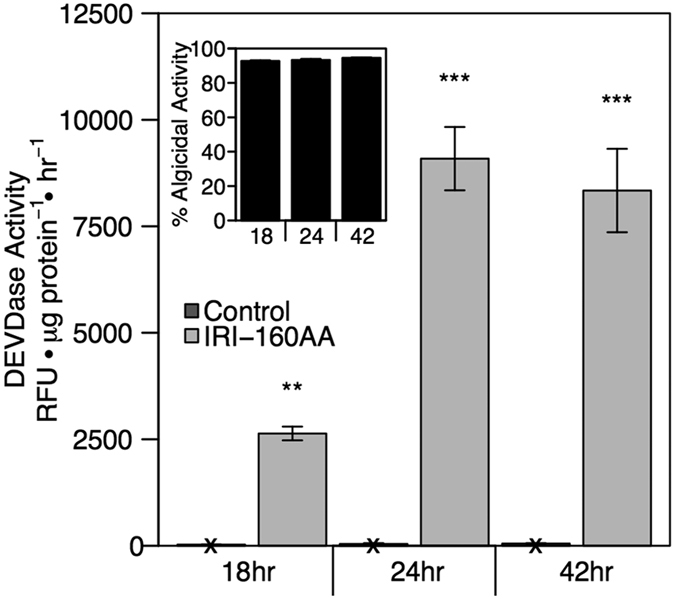
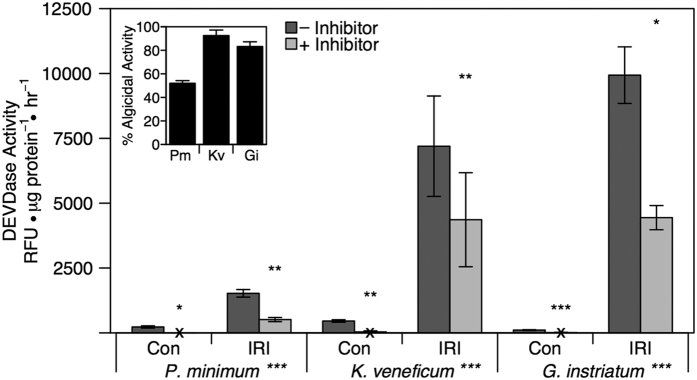
Bacteria may play a role in regulating harmful algal blooms, but little is known about the biochemical and physiological changes associated with cell death induced by algicidal bacteria. Previous work characterized an algicidal exudate (IRI-160AA) produced by Shewanella sp. IRI-160 that is effective against dinoflagellates, while having little to no effect on other phytoplankton species in laboratory culture experiments. The objective of this study was to evaluate biochemical changes associated with cell death and impacts on the cell cycle in three dinoflagellate species (Prorocentrum minimum, Karlodinium veneficum and Gyrodinium instriatum) after exposure to IRI-160AA. In this study, IRI-160AA induced cell cycle arrest in all dinoflagellates examined. Several indicators for programmed cell death (PCD) that are often observed in phytoplankton in response to a variety of stressors were also evaluated. Cell death was accompanied by significant increases in DNA degradation, intra- and extracellular ROS concentrations and DEVDase (caspase-3 like) protease activity, which have been associated with PCD in other phytoplankton species. Overall, results of this investigation provide strong evidence that treatment with the bacterial algicide, IRI-160AA results in cell cycle arrest and induces biochemical changes consistent with stress-related cell death responses observed in other phytoplankton.
Conflict of interest statement
The authors declare no competing financial interests.
Figures
Similar articles
-
Effects of the bacterial algicide IRI-160AA on cellular morphology of harmful dinoflagellates.Harmful Algae. 2017 Feb;62:127-135. doi: 10.1016/j.hal.2016.12.004. Epub 2017 Jan 16. Harmful Algae. 2017. PMID: 28118887
-
Metabolomic Insights of the Effects of Bacterial Algicide IRI-160AA on Dinoflagellate Karlodinium veneficum.Metabolites. 2022 Apr 1;12(4):317. doi: 10.3390/metabo12040317. Metabolites. 2022. PMID: 35448504 Free PMC article.
-
Immobilization of algicidal bacterium Shewanella sp. IRI-160 and its application to control harmful dinoflagellates.Harmful Algae. 2020 Apr;94:101798. doi: 10.1016/j.hal.2020.101798. Epub 2020 Apr 16. Harmful Algae. 2020. PMID: 32414500
-
Proliferation of dinoflagellates: blooming or bleaching.Bioessays. 2005 Jul;27(7):730-40. doi: 10.1002/bies.20250. Bioessays. 2005. PMID: 15954095 Review.
-
Putting the N in dinoflagellates.Front Microbiol. 2013 Dec 4;4:369. doi: 10.3389/fmicb.2013.00369. Front Microbiol. 2013. PMID: 24363653 Free PMC article. Review.
Cited by
-
A Novel Algicidal Bacterium and Its Effects against the Toxic Dinoflagellate Karenia mikimotoi (Dinophyceae).Microbiol Spectr. 2022 Jun 29;10(3):e0042922. doi: 10.1128/spectrum.00429-22. Epub 2022 May 26. Microbiol Spectr. 2022. PMID: 35616372 Free PMC article.
-
Diverse interactions between bacteria and microalgae: A review for enhancing harmful algal bloom mitigation and biomass processing efficiency.Heliyon. 2024 Aug 24;10(17):e36503. doi: 10.1016/j.heliyon.2024.e36503. eCollection 2024 Sep 15. Heliyon. 2024. PMID: 39286093 Free PMC article. Review.
-
Identification of a Metacaspase Gene in the Bloom-Forming Dinoflagellate Prorocentrum minimum and its Putative Function Involved in Programmed Cell Death.Curr Microbiol. 2021 Sep;78(9):3577-3585. doi: 10.1007/s00284-021-02617-3. Epub 2021 Jul 27. Curr Microbiol. 2021. PMID: 34313813
-
Algicidal Bacteria: A Review of Current Knowledge and Applications to Control Harmful Algal Blooms.Front Microbiol. 2022 Apr 7;13:871177. doi: 10.3389/fmicb.2022.871177. eCollection 2022. Front Microbiol. 2022. PMID: 35464927 Free PMC article. Review.
-
Flavobacterial exudates disrupt cell cycle progression and metabolism of the diatom Thalassiosira pseudonana.ISME J. 2022 Dec;16(12):2741-2751. doi: 10.1038/s41396-022-01313-9. Epub 2022 Sep 14. ISME J. 2022. PMID: 36104452 Free PMC article.
References
-
- Bidle K. D. The molecular ecophysiology of programmed cell death in marine phytoplankton. Ann Rev Marine Sci 7, 341–375 (2015). - PubMed
-
- Vavilala S. L., Gawde K. K., Sinha M., Souza J. S. & European J. D. Programmed cell death is induced by hydrogen peroxide by not by excessive ionic stress of sodium chloride in the unicellular green alga Chlamydomonas reinhardtii. Phycol 50, 422–438 (2015).
-
- Zuppini A., Gerotto C. & Baldan B. Programmed cell death and adaptation: two different types of abiotic stress response in a unicellular chlorophyte. Plant Cell Physiol 51, 884–888 (2010). - PubMed
Publication types
MeSH terms
Substances
LinkOut - more resources
Full Text Sources
Other Literature Sources
Molecular Biology Databases
Research Materials
