. 2017 Mar 23:7:45098.
doi: 10.1038/srep45098.

Calmodulin is responsible for Ca2+-dependent regulation of TRPA1 Channels

Affiliations

Calmodulin is responsible for Ca2+-dependent regulation of TRPA1 Channels

Raquibul Hasan et al. Sci Rep. .

Erratum in

Abstract

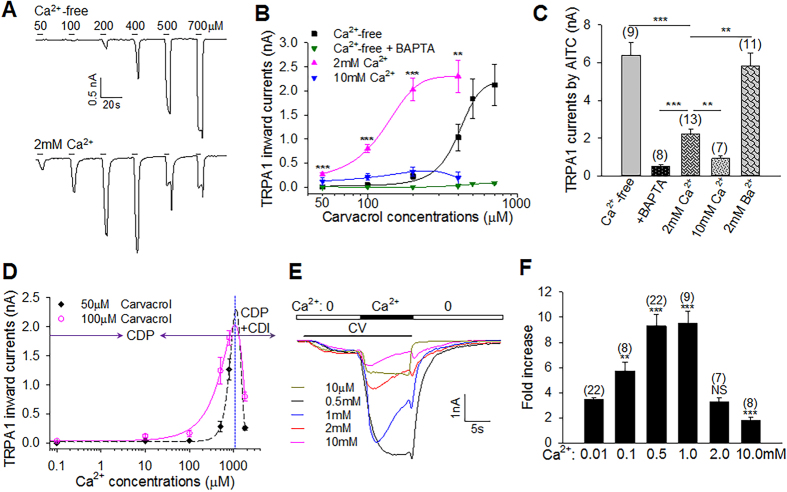
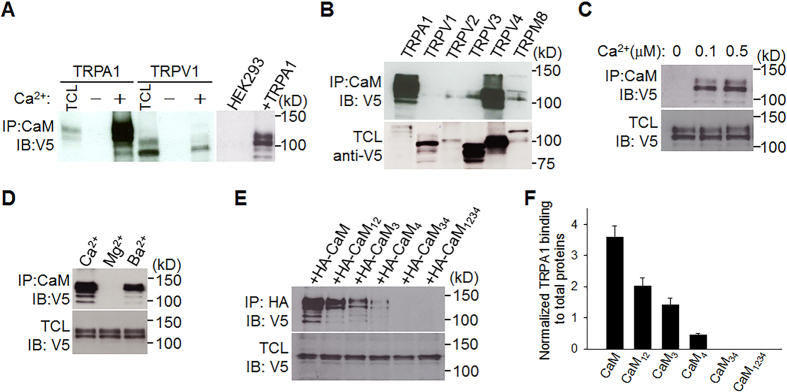
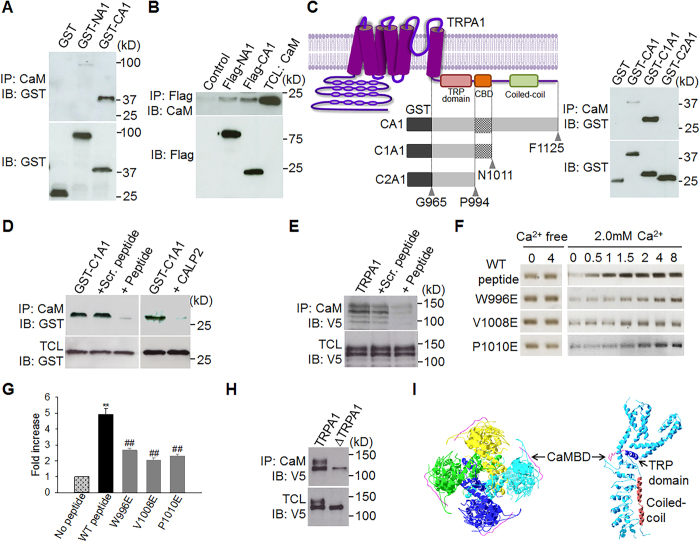
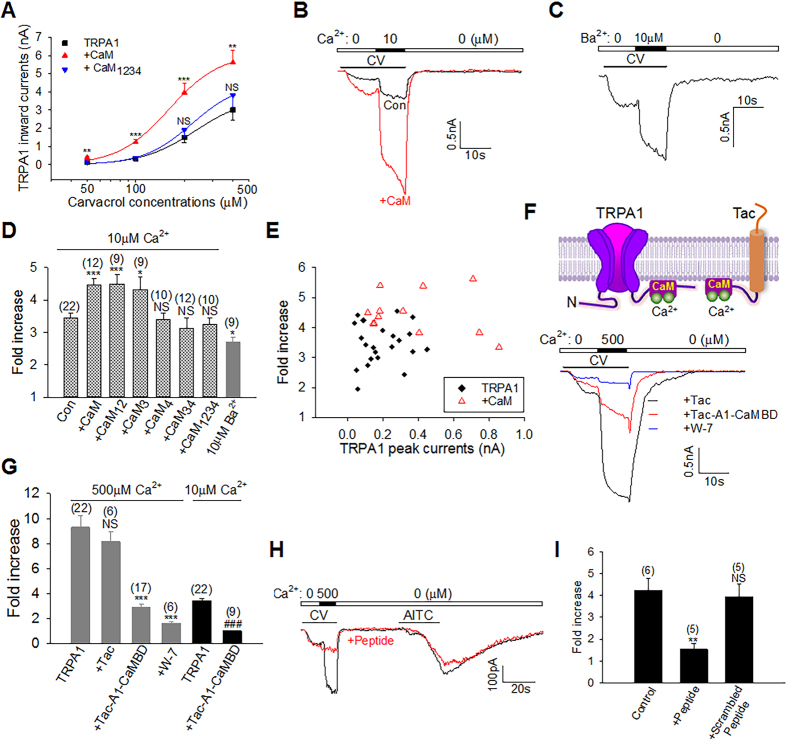
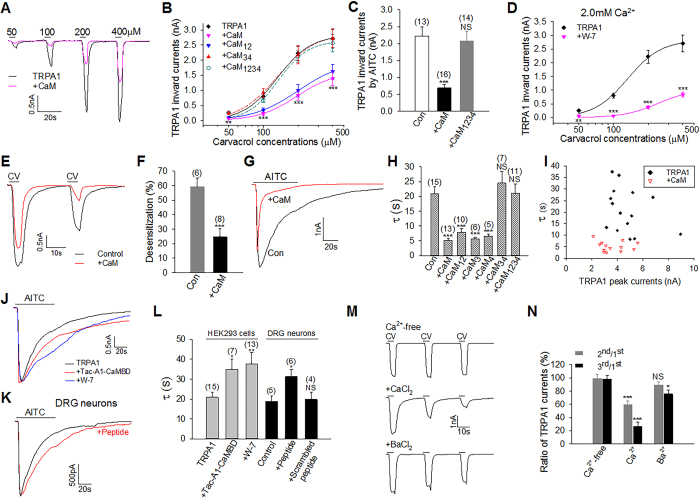
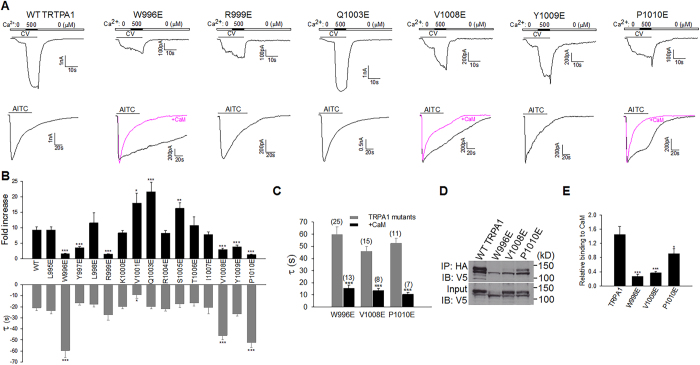
TRPA1 is a Ca2+-permeable ion channel involved in many sensory disorders such as pain, itch and neuropathy. Notably, the function of TRPA1 depends on Ca2+, with low Ca2+ potentiating and high Ca2+ inactivating TRPA1. However, it remains unknown how Ca2+ exerts such contrasting effects. Here, we show that Ca2+ regulates TRPA1 through calmodulin, which binds to TRPA1 in a Ca2+-dependent manner. Calmodulin binding enhanced TRPA1 sensitivity and Ca2+-evoked potentiation of TRPA1 at low Ca2+, but inhibited TRPA1 sensitivity and promoted TRPA1 desensitization at high Ca2+. Ca2+-dependent potentiation and inactivation of TRPA1 were selectively prevented by disrupting the interaction of the carboxy-lobe of calmodulin with a calmodulin-binding domain in the C-terminus of TRPA1. Calmodulin is thus a critical Ca2+ sensor enabling TRPA1 to respond to diverse Ca2+ signals distinctly.


Conflict of interest statement

The authors declare no competing financial interests.

Figures

Figure 1
Figure 1. Ca2+ potentiates and inactivates TRPA1.
(A) Representative TRPA1 inward currents elicited by different doses of carvacrol in HEK293 cells expressing TRPA1 in Ca2+-free (top) and 2.0 mM Ca2+ (bottom). (B) Summary of TRPA1 peak currents as a function of carvacrol doses under different concentrations of [Ca2+]e from experiments similar to those in (A). In BAPTA-AM-treated cells, cells were pre-treated with BAPTA-AM (50 μM) and recorded in Ca2+-free. The Ca2+-free curve (black), half maximal concentration (EC50) = 404.5 μM; Ca2+-free with BAPTA-AM curve (green), EC50 = 437.5 μM; 2 mM Ca2+ curve (pink), EC50 = 132.6 μM. All the curves were fitted with Hill equation, except the curve at 10 mM Ca2+ fitted with lognormal distribution (blue). All data are mean ± SEM (n = 6–12 for each curve). **P < 0.01; ***P < 0.001, compared to Ca2+-free. (C) Summary of TRPA1 inward peak currents evoked by AITC (100 μM, 25 s) in different concentrations of Ca2+ or Ba2+. The number of experiments is given above each bar. (D) Ca2+-dependent biphasic relationship of TRPA1 currents elicited by carvacrol (50 μM, 100 μM). The dotted vertical blue line indicates Ca2+ (∼1 mM) causing the maximal TRPA1 response. Low Ca2+ (<1 mM) promotes CDP and high Ca2+ (≥1 mM) triggers CDI and CDP. The curves were fitted with the Gaussian function. n = 6–22 for each point. (E) Representative traces of TRPA1 responses to carvacrol (CV, 10 s) potentiated by different concentrations of Ca2+ as indicated. (F) Summary of TRPA1 potentiation induced by different Ca2+ in experiments similar to those in (E). The number of experiments is given above each bar. Significance was compared to bar 1. All data are mean ± SEM. NS, not significant; **P < 0.01; ***P < 0.001.
Figure 2
Figure 2. CaM binds to TRPA1 depending on Ca2+.
(A) HEK293 cell lysates expressing TRPA1-V5 or TRPV1-V5 (left panel) or non-transfected HEK293 cell lysates (lane 1 on the right panel) were pulled down by CaM-agarose with or without Ca2+ (1 mM) followed by detection with anti-V5. Total cell lysate (TCL) shows the expression of TRPA1 and TRPV1. Molecular weight is shown on the right, similar to all other blots. (B) Different thermo-TRP ion channels were pulled down by CaM-agarose in 2 mM Ca2+. The bottom blot shows the expression of individual TRP channels in total cell lysate (TCL). Multiple bands of TRP channels are caused by channel glycosylation. The relative binding of TRPA1, TRPV1, 2, 3, 4 and TRPM8 to CaM (normalized by their total input) is 22.5, 0.3, 0.8, 0.2, 1.4 and 0.9, respectively. (C,D) CaM pull down assay shows the interaction of CaM with TRPA1 in nanomolar ranges of Ca2+ (C) and in different cations (1 mM each) (D). The bottom blots show equal expression of TRPA1 in different groups. (E) HA-tagged CaM or related mutants co-expressed with TRPA1-V5 in HEK293 cells as indicated, was immuno-precipitated (IP) by anti-HA in 2 mM Ca2+ followed by detection with anti-V5 (top blot). The bottom blot shows total input TRPA1 proteins. (F) Summary of relative TRPA1 binding to CaM (normalized by total TRPA1 proteins shown at the bottom blot in E) from similar experiments to those in E (n = 3).
Figure 3
Figure 3. Identifying a CaM-binding domain (CaMBD) in the C-terminus of TRPA1.
(A) The N- and C-termini of TRPA1 coupled to GST (GST-NA1, GST-CA1) were purified and then incubated with CaM-agarose, followed by detection with ant-GST (top blot). The bottom blot shows the expression of GST-coupled protein fragments. (B) The N and C termini of TRPA1 coupled to Flag (Flag-NA1, -CA1) were purified by Flag-agarose and then incubated with pure CaM. Bound CaM was detected by anti-CaM (top blot). The same blot was stripped and reprobed with ant-Flag (bottom blot). (C) A schematic diagram (top) shows the CaM-binding domain (CBD), TRP domain and coiled coil domain in the C-terminus of TRPA1. The corresponding truncated GST-CA1 fragments as illustrated were purified and used for CaM pull down assay on the right (top blot). The bottom blot on the right shows the expression of purified GST-coupled TRPA1 fragments. (D) The binding of purified GST-C1A1 fragment to CaM was blocked by the CaMBD peptide and by the CaM antagonistic peptide CALP2, but not by a scrambled CaMBD peptide. 200 μM was used for all the peptides. (E) The binding of TRPA1-V5 to CaM in a CaM-pull down assay was blocked by the CaMBD peptide (peptide), but not by a scrambled one (Scr. peptide). (F) Silver staining of CaM complexed with the indicated molar ratios of peptide: CaM with or without Ca2+. WT peptide denotes the CaMBD peptide. (G) Summary of CaM intensity at the peptide: CaM ratio of 4 relative to that at the ratio of 0 for different peptides. Data are mean ± SEM (n = 3). **P < 0.01; ##P < 0.01 compared to Bar 2. (H) Binding of CaM to TRPA1 and CaMBD-deleted TRPA1 (ΔTRPA1) revealed by a CaM pull down assay. The bottom blot shows the total input TRPA1 protein (TCL). (I) Ribbon diagrams depicting the identified CaMBD (pink) in the overall structure of TRPA1 (PDB: 3J9P) (left, bottom view; right, side view). Four individual TRPA1 subunits in homomeric TRPA1 channel complex (left) is shown in yellow, cyan, blue and green, respectively.
Figure 4
Figure 4. CaM enhances TRPA1 sensitivity and is essential for TRPA1 CDP in low Ca2+.
(A) Dose-response relationship between TRPA1 peak currents and carvacrol concentrations in HEK293 cells expressing TRPA1 or together with CaM mutants in nominal 0 Ca2+ (n = 6–10 for each curve). (B) Example TRPA1 currents evoked by carvacrol (CV, 100 μM) potentiated by Ca2+ (10 μM) with (red) or without CaM. (C) A typical TRPA1 current evoked by carvacrol (CV, 100 μM) was potentiated by Ba2+ (10 μM). (D) A summary of TRPA1 potentiation caused by 10 μM Ca2+ or Ba2+ in experiments similar to those in (B,C) in the presence of different CaM mutants. The number of experiments is given above each bar. (E) Scatter plots of Ca2+-induced TRPA1 potentiation fold as a function of initial TRPA1 peak currents from the same cells used in (B and D). Cells expressing TRPA1 only (black diamond) correspond to the control group in (D). (F) Schematic diagram shows the binding of Ca2+-CaM to the C terminus of TRPA1 and to the chimeric Tac-A1-CaMBD (top). Underneath are representative TRPA1 currents elicited by carvacrol (CV, 100 μM) potentiated by Ca2+ in cells co-expressing Tac (black) or Tac-A1-CaMBD (red) or perfused with W-7 (100 μM) (blue). (G) Collective results of TRPA1 potentiation induced by Ca2+ (10 μM, 500 μM) from experiments similar to those in (F). The number of experiments is shown above each bar. (H,I) Example (H) and summary (I) of Ca2+-induced potentiation of TRPA1 currents evoked by carvacrol (CV, 100 μM) in DRG neurons. AITC (100 μM, 25 s) was applied at the end. The potentiation was prevented by the CaMBD peptide (200 μM) (H,I), but not by the scrambled peptide (I). The number of experiments is indicated above each bar. All data are mean ± SEM. NS, not significant; **P < 0.01; ***P < 0.001; ###P < 0.001 compared to bar 5.
Figure 5
Figure 5. CaM inhibits TRPA1 sensitivity and is critical for TRPA1 desensitization in high Ca2+.
(A) Typical TRPA1 currents elicited by different doses of carvacrol from HEK293 cells expressing TRPA1 or with CaM. (B) TRPA1 inward currents as a function of cavacrol concentrations in HEK293 cells co-expressing TRPA1 and CaM mutants (n = 6–15 for each curve). (C) Bar summary of TRPA1 currents elicited by AITC (100 μM) in 2.0 mM Ca2+ in HEK cells expressing TRPA1. The number of experiments is shown above each bar. (D) Dose-response curve of TRPA1 from experiments similar to those in (B), but perfused with W-7 (100 uM). (E) Representative TRPA1 currents evoked by two consecutive pulses of carvacrol (CV, 400 μM) in HEK cells expressing TRPA1 or with CaM (red). (F) Summary of percentage of TRPA1 desensitization from experiments similar to those in (E). (G) Representative currents evoked by AITC (1 mM) from cells expressing TRPA1 (Con) or with CaM. (H) Bar summary of time constant (τ) of TRPA1 desensitization caused by CaM mutants from experiments similar to those in (G). (I) Scatter plots of Ca2+-induced desensitization rate (τ) of TRPA1 as a function of initial peak currents from the same cells used in (G and H). Cells expressing TRPA1 only correspond to the control group in (H). (J) Example TRPA1 currents elicited by AITC (1 mM) in cells co-expressing Tac-A1-CaMBD or perfused with W-7 (100 μM) in 2 mM Ca2+. Peak currents are scaled down 1.3-fold for Tac-A1-CaMBD and up 1.7-fold for W-7 for kinetic comparison. (K) Currents evoked by AITC (1 mM) in DRG neurons with or without the CaMBD peptide (200 μM) in patch pipette. The peak current for the peptide is scaled up 1.2-fold for kinetic comparison. (L) Collective results of time constant of TRPA1 desensitization from similar experiments to those in (J and K). (M) Representative TRPA1 currents induced by carvacrol (CV, 400 μM) in Ca2+-free, Ca2+ (2 mM) and Ba2+ (2 mM). (N) Summary of ratio of the 2nd/3rd peak currents to the 1st peak currents from experiments similar to those in (M) (n = 6–11 each). All data are mean ± SEM. NS, not significant; *P < 0.01; **P < 0.001; ***P < 0.001.
Figure 6
Figure 6. Ca2+/CaM effector sites on TRPA1 mediating CDP and CDI.
(A) Representative Ca2+-induced potentiation (top panels) and desensitization current traces (bottom panels) of different TRPA1 mutants. For potentiation, TRPA1 currents were induced by carvacrol (CV, 50 μM; 100 μM for W996E). For desensitization, 1 mM AITC (60 s) were applied. Blunted desensitization of the W996E, V1008E and P1010E mutants was rescued by overexpressing CaM (pink). (B) Summary of potentiation fold and time constant (τ) of desensitization of TRPA1 mutants from experiments similar to those in (A). All data are mean ± SEM. NS, not significant; *P < 0.05; **P < 0.01; ***P < 0.001 compared with wild type (WT) TRPA1 (n = 5–25 each). (C) Summary of rescue of blunted desensitization of TRPA1 mutants by CaM. The number of experiments is shown above each bar. Data are mean ± SEM. ***P < 0.001. (D) Co-immunoprecipitation (IP) of HA-CaM with TRPA1-V5 mutants in 2 mM Ca2+. TRPV1 mutants were first purified using Ni-NTA beads, and equal amount of different total TRPA1 mutants was used for Co-IP (bottom blot). (E) Summary of relative binding of different TRPA1 mutants to CaM normalized by total input proteins from experiments similar to those in (D). All error bars are mean ± SEM. *P < 0.05; ***P < 0.001 (n = 3).

Similar articles

Cited by

References

    1. Bautista D. M., Pellegrino M. & Tsunozaki M. TRPA1: A gatekeeper for inflammation. Annu. Rev. Physiol 75, 181–200 (2013). - PMC - PubMed
    1. Zygmunt P. M. & Hogestatt E. D. TRPA1. Handb. Exp. Pharmacol. 222, 583–630 (2014). - PubMed
    1. Zhang X. Targeting TRP ion channels for itch relief. Naunyn Schmiedebergs Arch. Pharmacol. 388, 389–399 (2015). - PubMed
    1. Nilius B., Appendino G. & Owsianik G. The transient receptor potential channel TRPA1: from gene to pathophysiology. Pflugers Arch. 464, 425–458 (2012). - PubMed
    1. Julius D. TRP channels and pain. Annu. Rev. Cell Dev. Biol. 29, 355–384 (2013). - PubMed

Publication types