

Phosphate increase during fatigue affects crossbridge kinetics in intact mouse muscle at physiological temperature
- PMID: 28332714
- PMCID: PMC5491871
- DOI: 10.1113/JP273672
Phosphate increase during fatigue affects crossbridge kinetics in intact mouse muscle at physiological temperature
Abstract
Key points: Actomyosin ATP hydrolysis occurring during muscle contraction releases inorganic phosphate [Pi ] in the myoplasm. High [Pi ] reduces force and affects force kinetics in skinned muscle fibres at low temperature. These effects decrease at high temperature, raising the question of their importance under physiological conditions. This study provides the first analysis of the effects of Pi on muscle performance in intact mammalian fibres at physiological temperature. Myoplasmic [Pi ] was raised by fatiguing the fibres with a series of tetanic contractions. [Pi ] increase reduces muscular force mainly by decreasing the force of the single molecular motor, the crossbridge, and alters the crossbridge response to fast length perturbation indicating faster kinetics. These results are in agreement with schemes of actomyosin ATPase and the crossbridge cycle including a low- or no-force state and show that fibre length changes perturb the Pi -sensitive force generation of the crossbridge cycle.
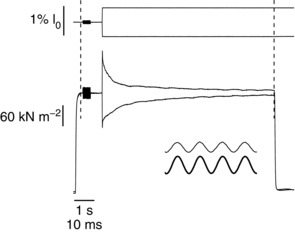
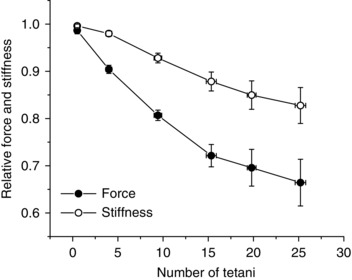
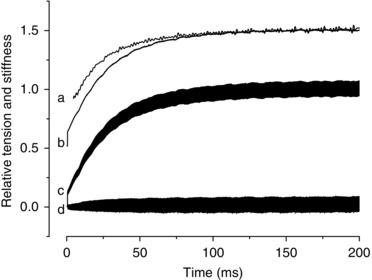
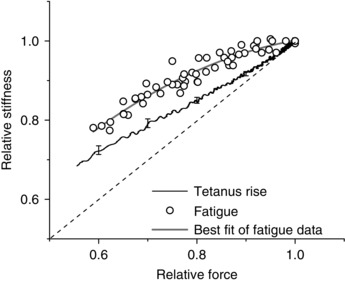
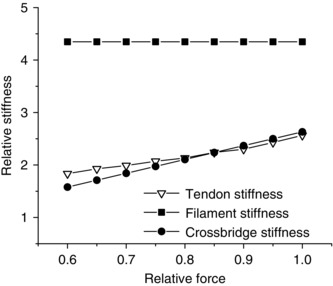
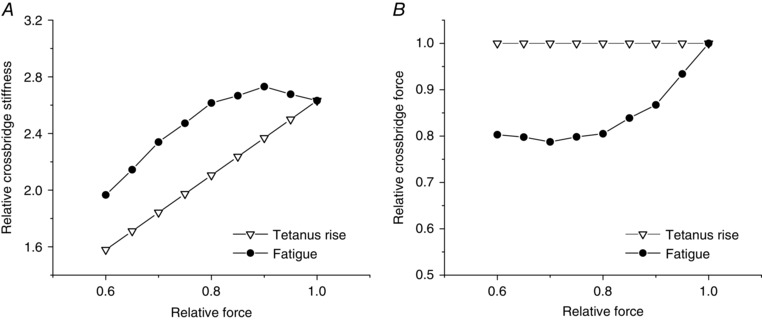
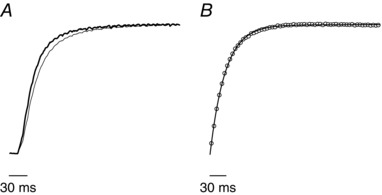
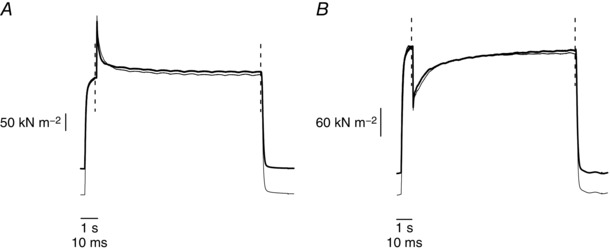
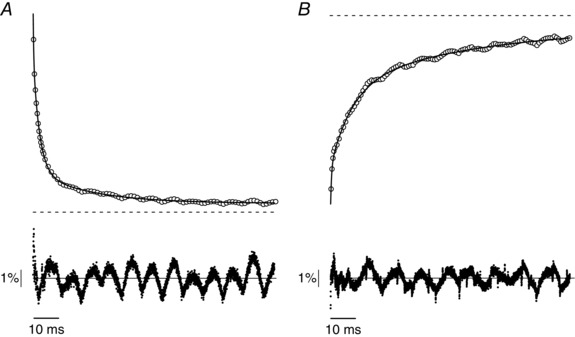
Abstract: Actomyosin ATP hydrolysis during muscle contraction releases inorganic phosphate, increasing [Pi ] in the myoplasm. Experiments in skinned fibres at low temperature (10-12°C) have shown that [Pi ] increase depresses isometric force and alters the kinetics of actomyosin interaction. However, the effects of Pi decrease with temperature and this raises the question of the role of Pi under physiological conditions. The present experiments were performed to investigate this point. Intact fibre bundles isolated from the flexor digitorum brevis of C57BL/6 mice were stimulated with a series of tetanic contractions at 1.5 s intervals at 33°C. As show previously the most significant change induced by a bout of contractile activity similar to the initial 10 tetani of the series was an increase of [Pi ] without significant Ca2+ or pH changes. Measurements of force, stiffness and responses to fast stretches and releases were therefore made on the 10th tetanus of the series and compared with control. We found that (i) tetanic force at the 10th tetanus was ∼20% smaller than control without a significant decrease of crossbridge stiffness; and (ii) the force recovery following quick stretches and releases was faster than in control. These results indicate that at physiological temperature the increase of [Pi ] occurring during early fatigue reduces tetanic force mainly by depressing the individual crossbridge force and accelerating crossbridge kinetics.
Keywords: crossbridge kinetics; fatigue; phosphate.
© 2017 The Authors. The Journal of Physiology © 2017 The Physiological Society.
Figures
Similar articles
-
Effect of temperature on crossbridge force changes during fatigue and recovery in intact mouse muscle fibers.PLoS One. 2013 Oct 17;8(10):e78918. doi: 10.1371/journal.pone.0078918. eCollection 2013. PLoS One. 2013. PMID: 24147145 Free PMC article.
-
Post-exercise recovery of contractile function and endurance in humans and mice is accelerated by heating and slowed by cooling skeletal muscle.J Physiol. 2017 Dec 15;595(24):7413-7426. doi: 10.1113/JP274870. Epub 2017 Oct 25. J Physiol. 2017. PMID: 28980321 Free PMC article.
-
Role of myoplasmic phosphate in contractile function of skeletal muscle: studies on creatine kinase-deficient mice.J Physiol. 2001 Jun 1;533(Pt 2):379-88. doi: 10.1111/j.1469-7793.2001.0379a.x. J Physiol. 2001. PMID: 11389199 Free PMC article.
-
Muscle contraction and fatigue. The role of adenosine 5'-diphosphate and inorganic phosphate.Sports Med. 1997 May;23(5):287-305. doi: 10.2165/00007256-199723050-00003. Sports Med. 1997. PMID: 9181667 Review.
-
Force and power generating mechanism(s) in active muscle as revealed from temperature perturbation studies.J Physiol. 2010 Oct 1;588(Pt 19):3657-70. doi: 10.1113/jphysiol.2010.194001. J Physiol. 2010. PMID: 20660565 Free PMC article. Review.
Cited by
-
Exhaustion of Skeletal Muscle Fibers Within Seconds: Incorporating Phosphate Kinetics Into a Hill-Type Model.Front Physiol. 2020 May 5;11:306. doi: 10.3389/fphys.2020.00306. eCollection 2020. Front Physiol. 2020. PMID: 32431619 Free PMC article.
-
Temperature Effects on Force and Actin⁻Myosin Interaction in Muscle: A Look Back on Some Experimental Findings.Int J Mol Sci. 2018 May 22;19(5):1538. doi: 10.3390/ijms19051538. Int J Mol Sci. 2018. PMID: 29786656 Free PMC article. Review.
-
Force-frequency relationship during fatiguing contractions of rat medial gastrocnemius muscle.Sci Rep. 2020 Jul 14;10(1):11575. doi: 10.1038/s41598-020-68392-6. Sci Rep. 2020. PMID: 32665563 Free PMC article.
-
Effects of Hydrostatic-Pressure on Muscle Contraction: A Look Back on Some Experimental Findings.Int J Mol Sci. 2023 Mar 6;24(5):5031. doi: 10.3390/ijms24055031. Int J Mol Sci. 2023. PMID: 36902460 Free PMC article. Review.
-
The effects of fatigue and oxidation on contractile function of intact muscle fibers and myofibrils isolated from the mouse diaphragm.Sci Rep. 2019 Mar 14;9(1):4422. doi: 10.1038/s41598-019-39353-5. Sci Rep. 2019. PMID: 30872655 Free PMC article.
References
-
- Allen DG, Clugston E, Petersen Y, Röder IV, Chapman B & Rudolf R (2011). Interactions between intracellular calcium and phosphate in intact mouse muscle during fatigue. J Appl Physiol (1985) 111, 358–366. - PubMed
-
- Bagni MA, Colombini B, Geiger P, Berlinguer Palmini R & Cecchi G (2004). Non‐cross‐bridge calcium dependent stiffness in frog muscle fibres. Am J Physiol Cell Physiol 286, C1353–C1357. - PubMed
-
- Baker AJ, Carson PJ, Miller RG & Weiner MW (1994). Metabolic and nonmetabolic components of fatigue monitored with 31P‐NMR. Muscle Nerve 17, 1002–1009. - PubMed
-
- Brunello E, Bianco P, Piazzesi G, Linari M, Reconditi M, Panine P, Narayanan T, Helsby WI, Irving M & Lombardi V (2006). Structural changes in the myosin filament and cross‐bridges during active force development in single intact frog muscle fibres: stiffness and X‐ray diffraction measurements. J Physiol 577, 971–984. - PMC - PubMed
Publication types
MeSH terms
Substances
LinkOut - more resources
Full Text Sources
Other Literature Sources
Research Materials
Miscellaneous