. 2017 Mar 23:7:44723.
doi: 10.1038/srep44723.

The Endoplasmic Reticulum Chaperone GRP78/BiP Modulates Prion Propagation in vitro and in vivo

Affiliations

The Endoplasmic Reticulum Chaperone GRP78/BiP Modulates Prion Propagation in vitro and in vivo

Kyung-Won Park et al. Sci Rep. .

Abstract

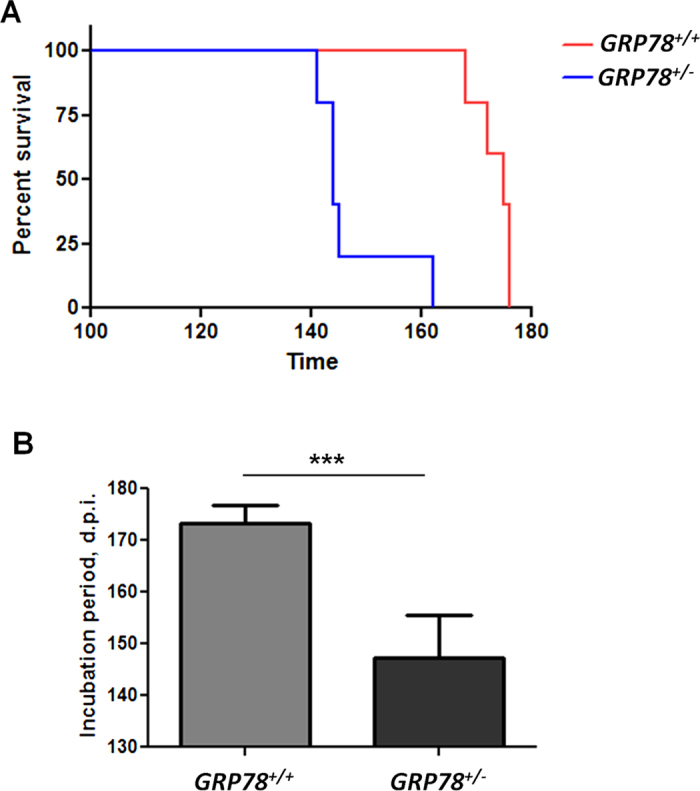
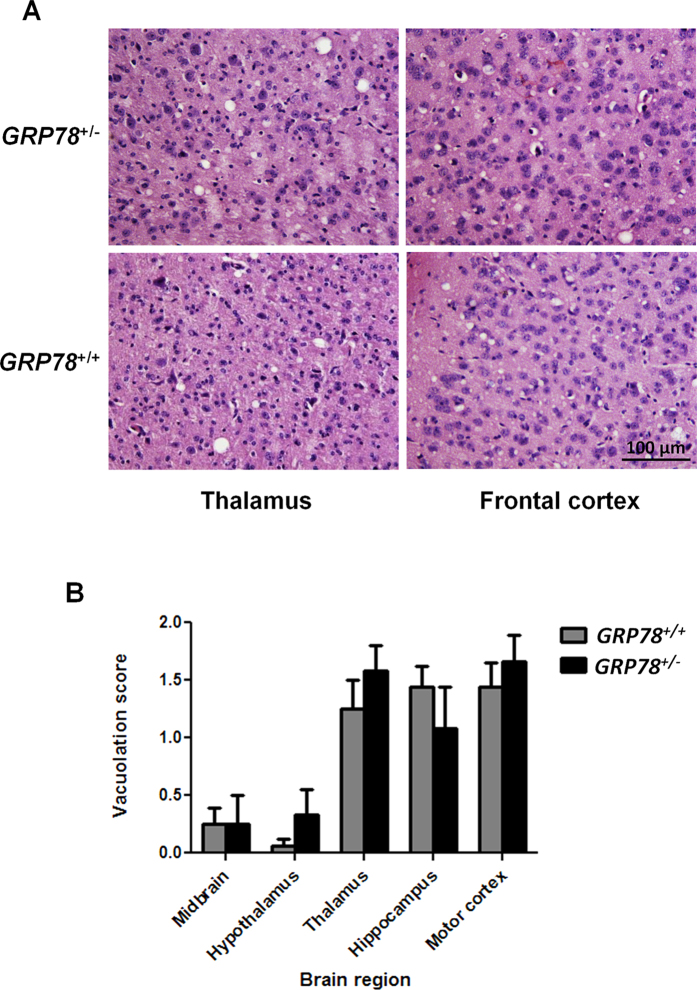
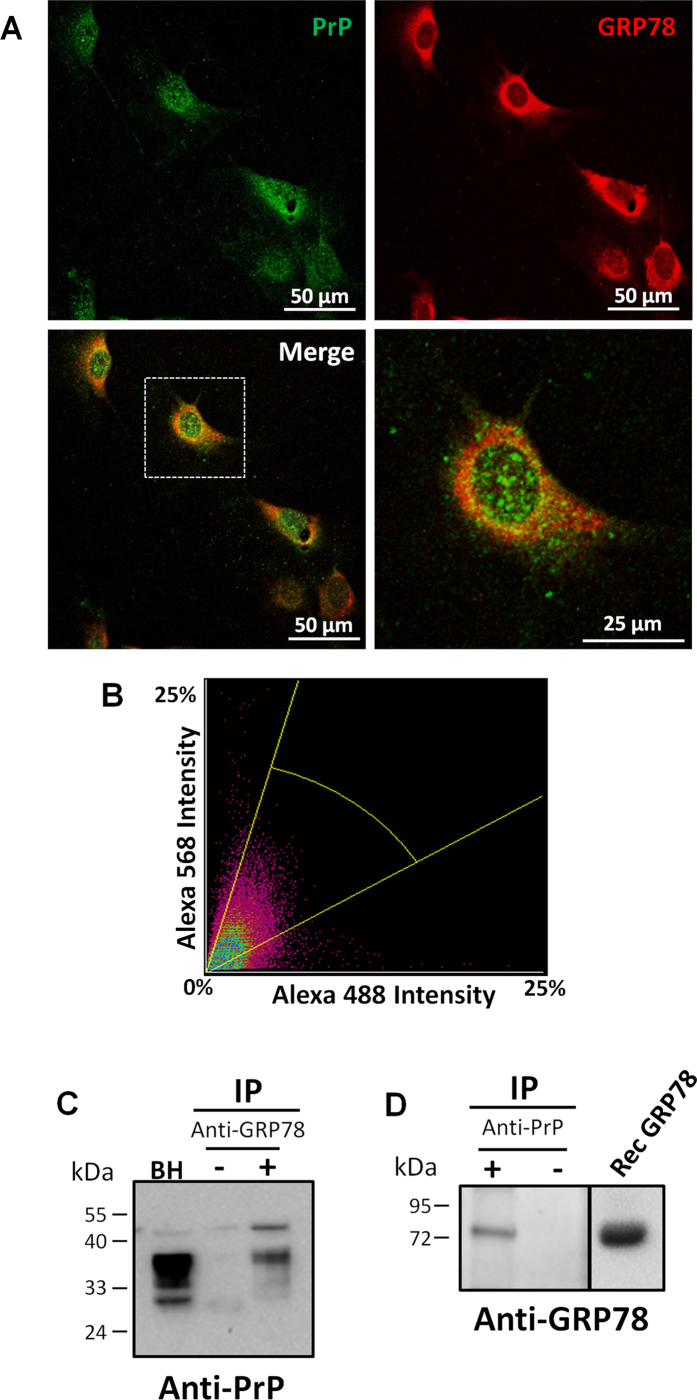
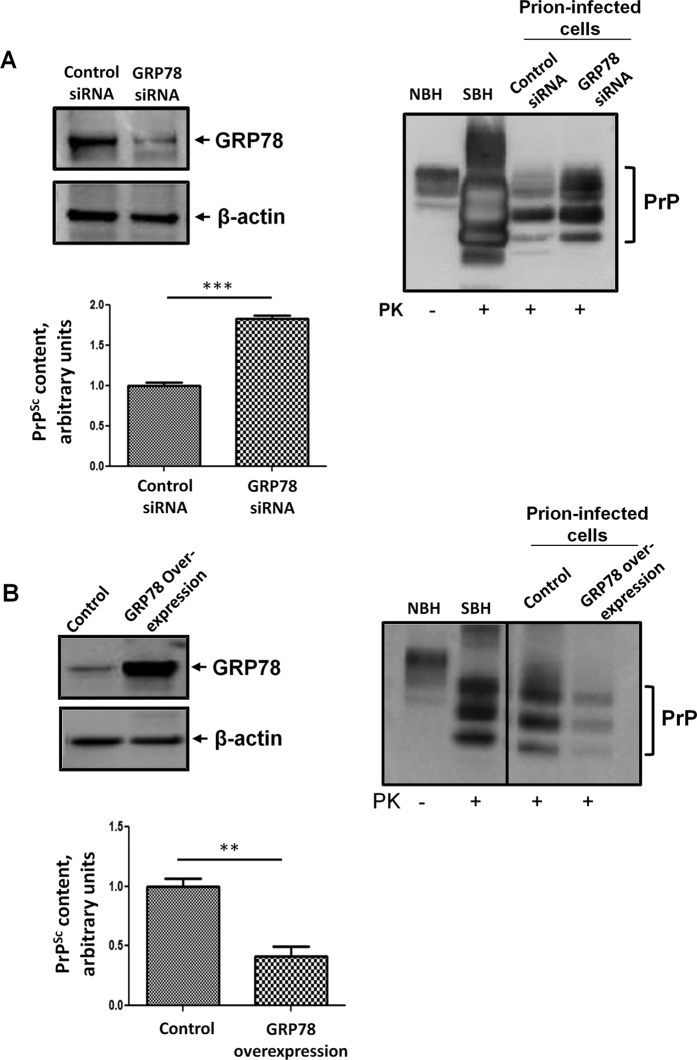
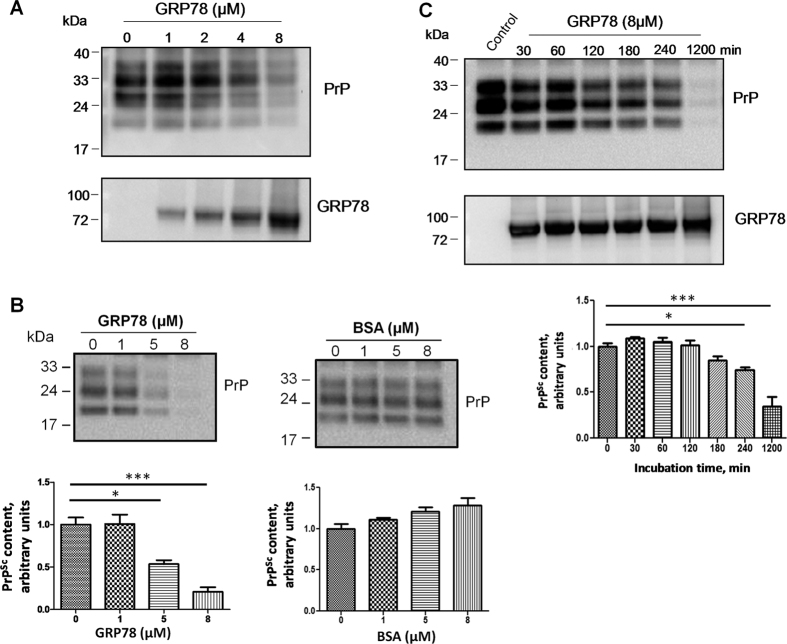
Prion diseases are fatal neurodegenerative disorders affecting several mammalian species, characterized by the accumulation of the misfolded form of the prion protein, which is followed by the induction of endoplasmic reticulum (ER) stress and the activation of the unfolded protein response (UPR). GRP78, also called BiP, is a master regulator of the UPR, reducing ER stress levels and apoptosis due to an enhancement of the cellular folding capacity. Here, we studied the role of GRP78 in prion diseases using several in vivo and in vitro approaches. Our results show that a reduction in the expression of this molecular chaperone accelerates prion pathogenesis in vivo. In addition, we observed that prion replication in cell culture was inversely related to the levels of expression of GRP78 and that both proteins interact in the cellular context. Finally, incubation of PrPSc with recombinant GRP78 led to the dose-dependent reduction of protease-resistant PrPSc in vitro. Our results uncover a novel role of GRP78 in reducing prion pathogenesis, suggesting that modulating its levels/activity may offer a novel opportunity for designing therapeutic approaches for these diseases. These findings may also have implications for other diseases involving the accumulation of misfolded proteins.


Conflict of interest statement

The authors declare no competing financial interests.

Figures

Figure 1
Figure 1. Decreased levels of GRP78 accelerate prion disease in mice.
(A) Survival curve of GRP78 heterozygous (GRP78+/−) and wild type (GRP78+/+) mice intra-cerebrally inoculated with RML prions. Differences in animal survival were analyzed by the Log-rank (Mantel Cox) test and found highly significant (P = 0.0018). (B) Average incubation periods of the different groups showed in panel A. Data is expressed as averages ± standard errors. Differences among the groups were analyzed by student’s t-test. ***P < 0.001.
Figure 2
Figure 2. GRP78 expression does not alter the vacuolation profile of terminally ill prion infected mice.
(A) Thalamus and frontal cortex sections of brains from RML-symptomatic GRP78 heterozygous (Grp78+/−) and wild type (Grp78+/+) mice were analyzed histologically for spongiform degeneration after hematoxylin-eosin staining. Bar in the lower right panel depict 100 μm and is representative of all pictures in this panel. (B) The vacuolation lesion profiles were determined on H&E stained sections from 5 different animals in each group. Degree of vacuolation was analyzed by scoring midbrain; hypothalamus; thalamus; hippocampus and motor cortex.
Figure 3
Figure 3. Expression levels of ER stress-responsive proteins in prion infected GRP78+/+ and GRP78+/− mice.
(A) Protein expression levels of UPR signaling proteins and ER chaperones from brains of GRP78+/+ and GRP78+/− mice infected with prions were examined by Western blot. Proteins analyzed included GRP78, GRP94, PDI, IRE1, CHOP, PERK, eIF2α, calnexin, calreticulin as well as the phosphorylated forms of PERK and eIF2α. PrPSc content was assessed after treating brain extracts with PK as explained in Experimental Procedures. β-actin is shown as a loading control. Numbers at the top of the panel represent samples from three different animals in each group. For all samples, the same amount of total protein was loaded in each lane. For space constrains blots were cropped, but all samples were run using the same conditions and in the same gel. (B) Quantifications of Western blot signals from 3 replicates of the experiment shown in panel A are represented as averages ± standard errors. Statistical differences were analyzed by using student’s t-test. *P < 0.05, ***P < 0.001.
Figure 4
Figure 4. GRP78 interacts with PrP.
(A) Primary cultures of mouse fibroblasts were doubly labeled with antibodies against PrP and GRP78 proteins. Top left panel represents cells that have been labeled with the 6H4 anti-PrP antibody and detected with Alexa488 secondary antibody (green). Top right panel represents cells that have been stained with anti-GRP78/BiP and detected with Alexa568 secondary antibody (red). Bottom left panel represents the merge between the two staining. Bottom right panel is a zoomed picture of one cell of the merged pictures (depicted in the dotted box in the bottom left panel). Samples were visualized by a confocal microscope. Scale bar: 50 μm or 25 μm. (B) Representative fluorogram indicating the signal intensity for both stainings and the colocalization of 6H4 (Alexa 488) and GRP78 (Alexa 568) obtained from confocal images. (C) Wild type mouse brain homogenates were immunoprecipitated with the anti-GRP78 antibody. Samples were analyzed by Western blot using an anti-PrP antibody (6D11). Lane 1 represents untreated brain homogenates used as a control, lane 2 corresponds to precipitation done with uncoated beads (without anti-GRP78 antibody), and lane 3 represents the immunoprecipitation with anti-GRP78 antibody. (D) Wild type mouse brain homogenates were immunoprecipated with the 6D11 anti-PrP antibody and samples analyzed by Western blot with anti-GRP78 antibody. First lane corresponds to the immoprecipitation with the 6D11 antibody, whereas the second line is the precipitation with the beads alone. Third lane depicts recombinant GRP78. Numbers on the left side of the gels correspond to the molecular weight standards. Separation line in the right blot indicate gel splicing to remove some irrelevant lines, even though all the samples were run in the same gel.
Figure 5
Figure 5. Expression levels of GRP78 modify prion replication in chronically infected CAD5 cells.
(A) Prion-infected CAD5 cells transfected with GRP78 siRNA or control siRNA were harvested and lysed. The expression of GRP78, actin (loading control), and PrPSc was analyzed by Western blotting. Left blot shows the staining with GRP78 antibody. Right blot corresponds to the staining with anti-PrP antibody. The graph shows the densitometric analysis of the levels of PrPSc in cells treated with control or GRP78 siRNA. (B) Prion-infected CAD5 cells transfected with GRP78 overexpressing plasmid or control plasmid were harvested and lysed. The expression of GRP78, actin, and PrPSc was analyzed by Western blotting. Left blot depicts the staining for GRP78. Right blot corresponds to the staining for PrP. In this panel, the vertical line indicates gel splicing to remove some irrelevant lanes, but samples were run in the same gel and were developed with the same exposition. The graph shows the densitometric analysis of PrPSc levels in cells expressing endogenous amounts of GRP78 (control) or over-expressing this protein. In both panels A and B, NBH: normal brain homogenate, not treated with PK, used as a marker of PrPC migration. SBH: RML-infected brain homogenate treated with PK, used as a marker of protease-resistant PrPSc migration. For space constrains some blots were cropped, but all samples were run using the same conditions and in the same gel. Statistical differences were analyzed by using student’s t-test. **P < 0.01, ***P < 0.001.
Figure 6
Figure 6. GRP78 reduces the amount of protease-resistant PrPSc in vitro.
(A) RML infected brain homogenates were incubated with different concentrations of purified recombinant GRP78 for 20 h (1200 minutes), and the amount of PrPSc remaining resistant to PK digestion was assessed by Western blotting (top panel). Numbers at the top represent GRP78 concentrations, expressed as μM. (B) Highly purified PrPSc preparations were incubated with different concentrations of GRP78 for 20 h, and reactions were analyzed by Western blotting. As a control, BSA (bovine serum albumin) was used at the same concentrations. Numbers at top of each gel represent μM protein concentration supplemented in each case. Graphs below each blot represent the densitometric analysis of 3 replicates for each respective experiment. Values correspond to the average ± standard error and differences were analyzed by one-way ANOVA followed by Tukey’s multiple comparison test. (C) Purified PrPSc preparations were incubated with 8 μM of GRP78 for different time points ranging from 30 to 1200 minutes. “Control” represents a purified PrPSc aliquot without any treatment. The graph below represents the densitometric analysis of 3 replicates showed as the average ± standard error. Differences were analyzed by one-way ANOVA followed by Tukey’s multiple comparison test. All samples used to evaluate PrPSc signal were first treated with PK. Immunoblot was used to assess remaining protease-resistant PrPSc in each case. *P < 0.05; ***P < 0.001.

Similar articles

Cited by

References

    1. Prusiner S. B. Prions. Proc. Natl. Acad. Sci. USA 95, 13363–13383 (1998). - PMC - PubMed
    1. Soto C. & Saborio G. P. Prions: disease propagation and disease therapy by conformational transmission. Trends Mol. Med. 7, 109–114 (2001). - PubMed
    1. Hetz C. A. & Soto C. Stressing Out the ER: A Role of the Unfolded Protein Response in Prion-Related Disorders. 6, 37–43 (2006). - PMC - PubMed
    1. Halliday M. & Mallucci G. R. Targeting the unfolded protein response in neurodegeneration: A new approach to therapy. 76 Pt A, 169–174 (2014). - PubMed
    1. Malhotra J. D. & Kaufman R. J. The endoplasmic reticulum and the unfolded protein response. Semin. Cell Dev. Biol. 18, 716–731 (2007). - PMC - PubMed

Publication types