Review
. 2017 Mar 16;7(2):321-382.
doi: 10.1002/cphy.c160016.

Regulation of Coronary Blood Flow

Affiliations
Review

Regulation of Coronary Blood Flow

Adam G Goodwill et al. Compr Physiol. .

Abstract

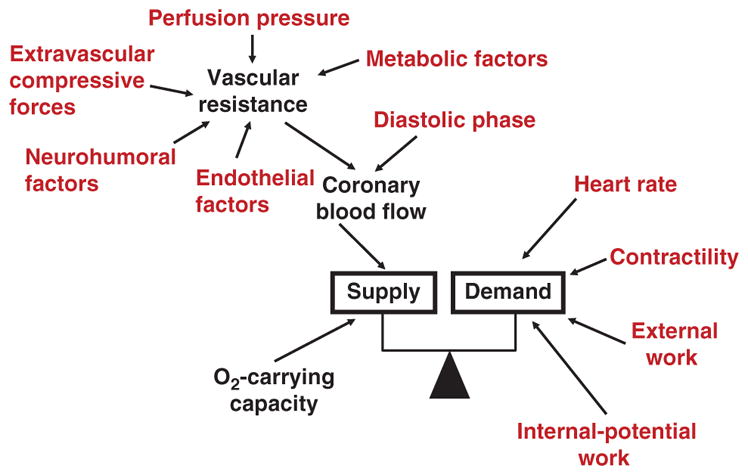
The heart is uniquely responsible for providing its own blood supply through the coronary circulation. Regulation of coronary blood flow is quite complex and, after over 100 years of dedicated research, is understood to be dictated through multiple mechanisms that include extravascular compressive forces (tissue pressure), coronary perfusion pressure, myogenic, local metabolic, endothelial as well as neural and hormonal influences. While each of these determinants can have profound influence over myocardial perfusion, largely through effects on end-effector ion channels, these mechanisms collectively modulate coronary vascular resistance and act to ensure that the myocardial requirements for oxygen and substrates are adequately provided by the coronary circulation. The purpose of this series of Comprehensive Physiology is to highlight current knowledge regarding the physiologic regulation of coronary blood flow, with emphasis on functional anatomy and the interplay between the physical and biological determinants of myocardial oxygen delivery. © 2017 American Physiological Society. Compr Physiol 7:321-382, 2017.


Figures

Figure 1
Figure 1
Schematic diagram of the determinants of myocardial oxygen supply and demand. Adapted, with permission, from Ardehali and Ports (16) and reported by Tune (918).
Figure 2
Figure 2
(A) Relationship between coronary blood flow and myocardial oxygen consumption during exercise in swine [data, with permission, from Berwick et al. (94)]. (B) Relationship between coronary blood flow and coronary perfusion pressure in swine [data, with permission, from Berwick et al. (96)]. (C) Coronary blood flow response to reductions in arterial oxygen content via hemodilution-anemia [data, with permission, from Tarnow et al. (905) and Fan (323)] or hypoxia [data, with permission, from Merrill et al. (670); Walley et al. (958); and Hermann and Feigl (458)]. (D) Coronary response to a transient coronary artery occlusion [data, with permission, from Borbouse et al. (110)].
Figure 3
Figure 3
Representative pictures of the anatomy of the coronary circulation. Right atrium (RA), RCA, right ventricle (RV); interventricular vein (IVV); LAD coronary artery; left atrium (LA); circumflex coronary artery (CFX); left ventricle (LV); posterior vein (PV); PDA [data, with permission, from Tune (918)].
Figure 4
Figure 4
(A) Radiograph of left ventricular free wall from a 52-year-old man who died of acute arsenic poisoning. He had no occlusive coronary disease and no valvular or myocardial abnormalities. Adapted, with permission, from Estes et al. (321). (B) Microvasculature of the left ventricular myocardium showing an arteriole, A (about 35–40 μm diameter), and two venae comitantes, V. The scale below gives 10- and 100-μm intervals. The venule on the right is about 40 × 80 μm. This arrangement is the usual one for arterioles from l-mm diameter down to those of 15-μm diameter [data, with permission, from Bassingthwaighte et al. (62)].
Figure 5
Figure 5
Left: Representative photograph illustrating the apical view of a canine heart 4 months following placement of an ameroid occluder around the proximal left circumflex coronary artery (entering from the left side of the photograph). Typical canine coronary collateral arteries are clearly visible on the epicardial surface, including both large (~1 mm diameter) and smaller, tortuous arterial connections between a branch of the completely occluded left circumflex coronary artery and a branch of the nonoccluded RCA (446). Right: Green fluorescent replica material was infused in the LAD, and red was infused in the LCX and RCA. Visual inspection reveals at least 2 coronary collaterals between the LAD and LCX as indicated by the two arrows on the right. The arrow on the left indicates a subendocardial collateral connection between LCA and LCX. The inset on the left is an enlarged detail of the inner half of the myocardium corresponding to the border between LAD an RCA (see square in the main image), showing mixing of colors along arterioles. Note that the perfusion areas are well defined, yet borders may be frayed between the LAD and LCX or RCA perfusion territories. Some green vessel segments within the red LCX area indicate that a small amount of green contrast may have entered through collateral connections that then has been pushed to smaller vessels upon the arrival of the red dye (932).
Figure 6
Figure 6
Phasic tracing of right coronary blood flow [adapted, with permission, from Lowensohn et al. (628)] and left circumflex coronary blood flow [adapted, with permission, from Tune et al. (923)] relative to aortic pressure.
Figure 7
Figure 7
Left: Schematic representation of a vascular waterfall in which flow is dependent on the elevation between the rim of the falls [tissue pressure (PT)] and the highest point upstream [arterial pressure (PA)], irrespective of the overall height of the falls [arterial pressure (PA) – venous pressure (PV)]. Right: Principle of the intramyocardial pump. Top: Pressure within a closed elastic tube Pi is in equilibrium with the pressure outside Po. Enlarging Po by ΔP leads to an increase in Pi also by ΔP. Bottom: When the flexible tube is open, ΔP also will be transmitted now causing flow which is impeded by viscous forces [data, with permission, from Spaan et al. (871)].
Figure 8
Figure 8
Schematic cross-section of the myocardial wall at end-diastole and end-systole [data, with permission, from Bell and Fox (72)].
Figure 9
Figure 9
Left: Example of interaction between pressure-induced myogenic response and flow-dependent dilation in isolated, pressurized subepicardial arteriole. Right: Pressure-diameter relationship of arterioles with and without flow [data, with permission, from Kuo et al. (590)].
Figure 10
Figure 10
Relationship between coronary blood flow and coronary vascular resistance relative to coronary perfusion pressure [data, with permission, from Berwick et al. (96)].
Figure 11
Figure 11
Left: Schematic diagram for series-coupled segmental responses of coronary vasculature to flow, pressure, metabolic, and adrenergic stimuli [data, with permission, from Davis et al. (225)]. Right: Proposed interaction between metabolic, myogenic, and flow-mediated regulation of coronary microvascular resistance during increases in myocardial metabolism [data, with permission, from Muller et al. (692)].
Figure 12
Figure 12
Relationship between coronary blood flow (left) and coronary venous PO2 (right) versus myocardial oxygen consumption in conscious instrumented swine at rest and during exercise under control conditions, following inhibition of pathway that produces similar reductions in coronary flow and myocardial oxygen consumption (tonic), and during a condition that produces progressive limitation in coronary vasodilation with increases in oxygen consumption (metabolic). The physiologic limit of these relationships are depicted by the red line (maximal physiology response) which represents the condition in which all oxygen delivered in extracted and consumed (i.e., 100% oxygen extraction) [data for each plot were derived, with permission, from the same animal (swine) under the same conditions from the study of Berwick et al. (94)].
Figure 13
Figure 13
Left: Relationship between coronary blood flow and coronary venous PO2 in the right and left ventricle at rest and during exercise in dogs [data, with permission, from Tune et al. (923) and Hart et al. (441)]. Right: Relationship between coronary blood flow and coronary venous PO2 in response to exercise in swine [data, with permission, from Duncker et al. (281)] and isovolemic hemodilution-induced anemia [data, with permission, from Van Woerkens et al. (935)].
Figure 14
Figure 14
Berne’s adenosine hypothesis of local metabolic control of coronary blood flow as a negative feedback control system [data, with permission, from Berne (85)].
Figure 15
Figure 15
Left: Relationship between coronary blood flow and myocardial oxygen consumption with and without adenosine receptor blockade [8-phenyltheophylline (8-PT) or 8-sulfophenyltheophylline (8-PST)] in dogs at rest and during graded treadmill exercise. Right: Relationship between estimated interstitial adenosine concentration and myocardial oxygen consumption with and without adenosine receptor blockade in dogs at rest and during graded treadmill exercise [data, with permission, from Tune et al. (923)].
Figure 16
Figure 16
Relationship between coronary venous hemoglobin saturation versus myocardial oxygen consumption (left) and coronary blood flow versus coronary venous hemoglobin saturation (right) in instrumented dogs at rest and during exericse with and without inhibition of adenosine receptors [8-phenyltheophylline (8-PT), P2Y1 receptors (MRS 2500), and nitric oxide synthase: L-nitro-arginine (LNA)] [data, with permission, from Gorman et al. (388)].
Figure 17
Figure 17
Relationship between cardiac H2O2 concentration and myocardial oxygen consumption (top) and coronary blood flow and H2O2 concentration (bottom) in anesthetized, open-chest dogs at baseline, during cardiac pacing, or norepinephrine infusion [data, with permission, from Saitoh et al. (820)].
Figure 18
Figure 18
Endothelium-derived vasoactive substances. ACE, angiotensin-converting enzyme; Ach, acetylcholine; AI, angiotensin I; AII, angiotensin II; AT1, angiotensin 1 receptor; Bk, bradykinin; COX, cyclooxygenase; ECE, ET-converting enzyme; EDHF, endothelium-derived hyperpolarizing factor; ETA and ETB, endothelin A and B receptors; ET-1, endothelin- 1; l-Arg, l-arginine; M, muscarinic acetylcholine receptor; PGH2, prostaglandin H2; ROS, reactive oxygen species; S1, serotoninergic receptor; TX, thromboxane receptor; TXA2, thromboxane; 5-HT, serotonin [from, with permission, Gutierrez et al. (415)].
Figure 19
Figure 19
Relationship between coronary blood flow (left) and coronary venous PO2 (right) versus myocardial oxygen consumption in dogs at rest and during exercise with and without the inhibition of nitric oxide synthase with LNA [data, with permission, from Tune et al. (920)].
Figure 20
Figure 20
Coronary blood flow response to intracoronary arachidonate before (left) and after inhibition of cyclooxygenase with indomethacin (middle). Right: Relationship between coronary blood flow and myocardial oxygen consumption in dogs at rest and during exercise with and without indomethacin [data, with permission, from Dai and Bache (213)].
Figure 21
Figure 21
Left: Biosynthesis and bioavailability of EC-derived EETs and H2O2. The activation of phospholipase A2 (PLA2) following stimulation with shear stress or secondary to IP3-sensitive ER Ca2+ store depletion by agonists leads to synthesis of AA, which is metabolized by CYP 2C or 2J isoenzymes to produce EETs, with (sEH; for all EET regioisomers) and COX (for 5,6-EET only) metabolizing EETs to DHETs and prostaglandins (PGs), respectively, thereby influencing EET bioavailability. Right: Shear stress and agonist stimulation also result in the reduction of molecular O2 to form the ROS superoxide (O2•−), as a byproduct of metabolism, by a number of sources, including NOS, CYP, COX, lipoxygenase (LOX), and mitochondria (mito). O2•− is then further reduced by SOD to form H2O2, the bioavailability of which is determined by endogenous antioxidant enzymes, which include Cat and glutathione peroxidase (GSH-Px). Nox isoforms (Nox2 and Nox4) synthesize ROS as their sole enzymatic product, with Nox2 producing O2•− and Nox4 mainly H2O2 [adapted, with permission, from Ellinsworth et al. (307)].
Figure 22
Figure 22
Left: Effect of intracoronary endothelin administration on coronary blood flow in anesthetized dogs in the absence and presence of endothelin (ET) receptor blockade. Right: Relationship between coronary blood flow and myocardial oxygen consumption in dogs at rest and during exercise in the absence and presence of ET receptor blockade [data, with permission, from Gorman et al. (386)].
Figure 23
Figure 23
Graphs showing the descending limb of the coronary pressure-flow relation in the presence of intact vasomotor tone in exercising dogs with and without the nitric oxide synthase inhibitor LNNA [data, with permission, from Duncker and Bache (269)].
Figure 24
Figure 24
Representative drawing of innervation of a coronary artery (cat) from Woollard (989).
Figure 25
Figure 25
Schematic diagram of combined adrenergic feedforward (open-loop) and local metabolic feedback (closed-loop) control of coronary blood flow [data, with permission, from Feigl (335)].
Figure 26
Figure 26
Relationship between coronary blood flow (left) and coronary venous PO2 (right) versus myocardial oxygen consumption in dogs at rest and during exercise with and without the inhibition of α-adrenoceptors or α + β-adrenoceptors [data, with permission, from Gorman et al. (389)].
Figure 27
Figure 27
Recordings from one dog during norepinephrine infusion (0.25 μg · kg−1 · min−1) before and after α-adrenoceptor blockade with phenoxybenzamine, with a right atrial paced heart rate of 140 beats/min during low-level vagal stimulation to slow the intrinsic heart rate. FFT of the septal artery flow velocity is shown with the envelope of the FFT calculated at one-half the maximum power. Shown at bottom are septal artery velocity profiles determined every 8 ms during individual cardiac cycles, before and after α-blockade. Forward flow is shown as a curvature of the velocity profile to the right, and retrograde flow is shown by a bowing to the left. Note that negative value retrograde flow velocity was greater after α-receptor blockade than before blockade during norepinephrine infusion [data, with permission, from Morita et al. (689)].
Figure 28
Figure 28
Effects of a 20-s vagal stimulation (30 Hz, 8 volts, and 2 ms) on blood pressure, left circumflex coronary blood flow, and heart rate in an anesthetized dog [data, with permission, from Feigl (329)].
Figure 29
Figure 29
Left: Coronary blood flow response to systemic (intravenous) administration of angiotensin II [data, with permission, from Doursout et al. (258)]. Right: Coronary blood flow response to intracoronary administration of angiotensin II with coronary perfusion pressure held constant at 100 mmHg by a servo-controlled extracorporeal perfusion system [data, with permission, from Zhang et al. (1018)].
Figure 30
Figure 30
Patch clamp recordings of voltage-gated Ca2+ current in smooth muscle cells from the rabbit coronary artery. Panel A shows a representative I–V relationship in 2.2 mmol/L Ca2+ before (open symbols) and after (filled symbols) 500 μmol/L Cd2+. Panel B contains a portion of the family of traces, leak subtracted, used to create the I–V in panel A. Currents were elicited from a holding potential of −80 mV. Panel C is a graph of group data (16 cells) [data, with permission, from Matsuda et al. (647)].
Figure 31
Figure 31
Dominant role of L-type Ca2+ channels in regulating coronary vascular resistance. The coronary pressure-flow relationship in swine was autoregulated under control conditions (filled symbols). Coronary pressure was regulated by a servo-controlled extracorporeal perfusion system while flow was measured. Inhibiting L-type Ca2+ channels with intracoronary diltiazem (10 μg/min) abolished pressure-flow autoregulation, indicating a lack of active adjustments to coronary vascular resistance [data, with permission, from Berwick et al. (96)].
Figure 32
Figure 32
Three components of macroscopic K+ current in smooth muscle cells from the human coronary artery. Panel A contains representative current tracings before and after the addition of glibenclamide (Glib; 3 μmol/L), an inhibitor of KATP channels. Only 2 of the 3 major components of K+ current are active under control conditions: BKCa and KV channels (see text for details). Panel B shows that KATP channels, while not open under control conditions, can be activated by pinacidil (Pin; 1 μmol/L) and blocked by glibenclamide [data, with permission, from Gollasch et al. (382)].
Figure 33
Figure 33
Voltage-dependence of coronary vascular tone: central role of the L-type Ca2+ channel in coronary smooth muscle. A cartoon schematic represents a coronary myocyte (1), a coronary endothelial cell (2), and metabolic dilators from the adjacent myocardium (3). The L-type Ca2+ channel in coronary vascular smooth muscle is a major target of regulatory mechanisms, as Ca2+ influx largely controls the amount of Ca2+ available to activate the contractile apparatus. Ca2+ release from the sarcoplasmic reticulum (SR; with ryanodine- and IP3-sensitive Ca2+ release channels) and Ca2+ influx via nonselective cation channels (NSCC) also contribute. NSCC in smooth muscle also contribute to contraction by depolarizing the membrane potential (Em) and activating L-type Ca2+ channels. Endothelial receptor stimulation (paracrine and mechanical factors) increases Ca2+ in endothelial cells, leading to the production of relaxing/hyperpolarizing factors and hyperpolarization of endothelial Em. Myo-endothelial junctions can spread Em hyperpolarization to coronary smooth muscle. Relaxing/hyperpolarizing factors diffuse to the smooth muscle, where they activate cell signaling mechanisms to control the contractile apparatus or hyperpolarize Em via K+ channels. The most important physiological stimulus regulating coronary vascular resistance on a beat-to-beat basis is metabolic dilators from the myocardium. These factors, which have not been identified conclusively, relax coronary smooth muscle, in large part, by the activation of K+ (especially KV) channels and subsequent inhibition of L-type Ca2+ channels.
Figure 34
Figure 34
Stretch-activated nonselective cation current in coronary vascular smooth muscle: effects on the intracellular Ca2+ concentration. Panel A contains a photomicrograph of representative porcine coronary smooth muscle cells. A patch clamp pipette is used to hold one end of a cell and record electrical activity (1) while longitudinal stretch is applied with a second pipette and piezoelectric translator; (2) panel B shows that the magnitude of depolarizing inward current (I, lower trace) is related to the degree of longitudinal stretch (L, upper trace) in a porcine coronary smooth muscle cell [data, with permission, from Wu and Davis (991)]. Panel C demonstrates that, in porcine coronary myocytes, stretch-induced increases in intracellular Ca2+ ultimately depend upon extracellular Ca2+. Arrows indicate the initiation of longitudinal stretch. In the presence of extracellular Ca2+, stretch-induced increases in intracellular Ca2+ were rapid and repeatable. In the absence of extracellular Ca2+, longitudinal stretch still elicited Ca2+ transients, but internal stores were quickly depleted [data, with permission, from Davis et al. (226)].
Figure 35
Figure 35
Role of KV1 channels in coronary metabolic vasodilation. Panel A contains coronary blood flow data from five pigs treated with correolide, a selective KV1 channel blocker, and four pigs treated with vehicle only. Myocardial oxygen consumption (MvO2) was elevated from rest by infusing dobutamine at three increasing doses. KV1 channels are important for the increase in coronary blood flow elicited by cardiac metabolism, as correolide depressed the relationship between oxygen supply and demand [data, with permission, from Goodwill et al. (384)]. Panel B shows myocardial blood flow versus cardiac double product, an index of cardiac metabolic demand, in wild-type mice (WT), global KV1.5 knockout mice (KV1.5−/−), and mice with smooth muscle-specific restoration of KV1.5 expression (KV1.5−/− RC). Myocardial blood flow was lower at any given level of myocardial demand in global KV1.5 knockout mice (P < 0.05 vs. WT). Smooth muscle-specific restoration of KV1.5 expression normalized the relationship between myocardial blood flow and metabolic demand [not significant from WT; P < 0.05 versus global knockout; data, with permission, from Ohanyan et al. (725)].
Figure 36
Figure 36
Left: Relationship between coronary venous PO2 and myocardial oxygen consumption at rest and during exercise before and during triple blockade of KATP channels, nitric oxide synthase and adenosine receptors [data, with permission, from Tune et al. (921)]. Right: Relationship between coronary venous PO2 and myocardial oxygen consumption at rest and during exercise before and during inhibition of adenosine receptors (8PT), KATP channels (Glib) and/or nitric oxide synthase (LNNA) [data, with permission, from Ishibashi et al. (497)].

References

    1. Abid MR, Sellke FW. Antioxidant therapy: Is it your gateway to improved cardiovascular health? Pharm Anal Acta. 2015;6 pii:323. - PMC - PubMed
    1. Afonso S, Bandow GT, Rowe GG. Indomethacin and the prostaglandin hypothesis of coronary blood flow regulation. J Physiol. 1974;241:299–308. - PMC - PubMed
    1. Ahmed A, Waters CM, Leffler CW, Jaggar JH. Ionic mechanisms mediating the myogenic response in newborn porcine cerebral arteries. Am J Physiol Heart Circ Physiol. 2004;287:H2061–H2069. - PubMed
    1. Alexander RW, Kent KM, Pisano JJ, Keiser HR, Cooper T. Regulation of postocclusive hyperemia by endogenously synthesized prostaglandins in the dog heart. J Clin Invest. 1975;55:1174–1181. - PMC - PubMed
    1. Algranati D, Kassab GS, Lanir Y. Mechanisms of myocardiumcoronary vessel interaction. Am J Physiol Heart Circ Physiol. 2010;298:H861–H873. - PMC - PubMed

Publication types

MeSH terms