

The Association Between Clinical Features Seen on Fundus Photographs and Glaucomatous Damage Detected on Visual Fields and Optical Coherence Tomography Scans
- PMID: 28333890
- PMCID: PMC5408322
- DOI: 10.1097/IJG.0000000000000640
The Association Between Clinical Features Seen on Fundus Photographs and Glaucomatous Damage Detected on Visual Fields and Optical Coherence Tomography Scans
Abstract
Purpose: To classify the appearance of the optic disc seen on fundus photographs of healthy subjects and patients with or suspected glaucoma whose diagnosis was based upon visual fields (VFs) and spectral-domain optical coherence tomography (sdOCT) results.
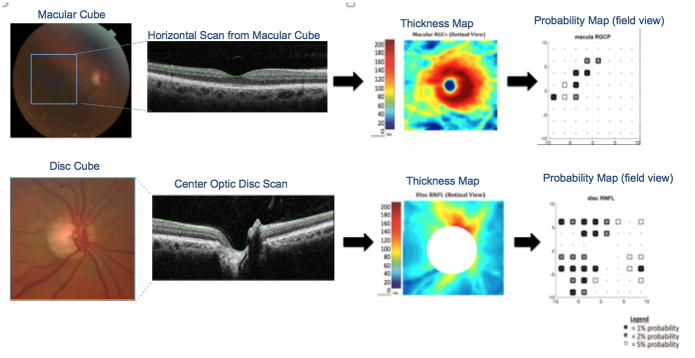
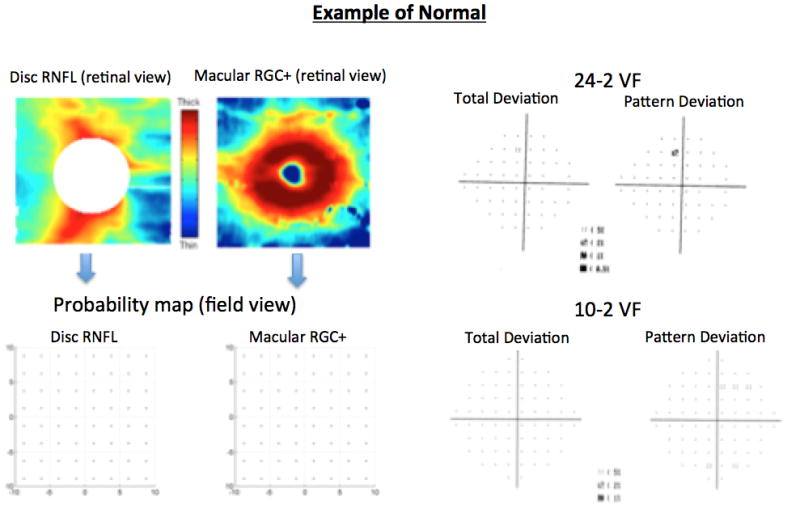
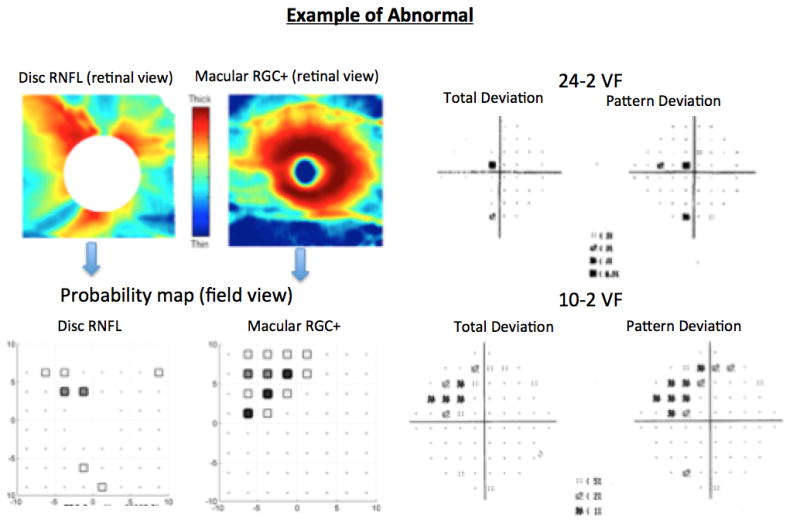
Patients and methods: One eye of 100 patients with or suspected glaucoma and 62 healthy subjects were prospectively tested with 24-2 and 10-2 VF and macular and disc sdOCT cube scans. All eyes with or suspected glaucoma had a 24-2 mean deviation better than -6.0 dB and an abnormal appearing disc on stereophotographs. The retinal ganglion cell plus inner plexiform layer (RGC+) from the macular scans and the retinal nerve fiber layer (RNFL) from the macular and disc scans were segmented and converted to probabilities plots. An eye was considered "glaucoma" if the sdOCT probability plots showed an abnormality in a region that corresponded to a defect seen on the 24-2 and/or 10-2 VF total deviation plot. Similarly, an eye was considered "suspect" only if both the sdOCT and VF plots were normal. Healthy subjects (normal VFs and sdOCT) were classified as "controls" and used as reference for comparisons. Glaucoma specialists reviewed the stereophotographs and classified eyes based on the presence of signs suggestive of glaucomatous optic neuropathy.
Results: The pattern of clinical signs of glaucomatous optic neuropathy seen on stereophotographs was statistically different between glaucoma (P<0.001) and suspects (P<0.001) vs. controls and explained up to 68% of the total variance of the diagnosis based upon sdOCT and VFs. Vertical cup-to-disc>0.6, focal neuroretinal rim thinning, focal RNFL loss, and violation of the ISNT rule had the best performance to differentiate glaucoma and suspects from controls. Compared with the suspect group, glaucoma eyes (abnormal sdOCT and VF tests) were more likely to have vertical cup-to-disc>0.6 (92% vs. 69%, P=0.003), diffuse rim (53% vs. 9%, P<0.001) and RNFL (61% vs. 26%, P<0.001) thinning, and β-zone parapapillary atrophy (68% vs. 17%, P<0.001).
Conclusions: Focal and diffuse signs of glaucoma damage seen on stereophotographs often match damage shown on VFs and sdOCT. In addition, damage shown on VFs and sdOCT is often missed during clinical evaluation. Longitudinal studies ought to differentiate focal signs of glaucoma damage seen on stereophotography from false-positives or very early loss.
Conflict of interest statement
Figures
Similar articles
-
Early glaucoma involves both deep local, and shallow widespread, retinal nerve fiber damage of the macular region.Invest Ophthalmol Vis Sci. 2014 Feb 3;55(2):632-49. doi: 10.1167/iovs.13-13130. Invest Ophthalmol Vis Sci. 2014. PMID: 24370831 Free PMC article.
-
Diffuse glaucomatous structural and functional damage in the hemifield without significant pattern loss.Arch Ophthalmol. 2009 Nov;127(11):1442-8. doi: 10.1001/archophthalmol.2009.196. Arch Ophthalmol. 2009. PMID: 19901209
-
A Deep Learning Algorithm to Quantify Neuroretinal Rim Loss From Optic Disc Photographs.Am J Ophthalmol. 2019 May;201:9-18. doi: 10.1016/j.ajo.2019.01.011. Epub 2019 Jan 26. Am J Ophthalmol. 2019. PMID: 30689990 Free PMC article.
-
On improving the use of OCT imaging for detecting glaucomatous damage.Br J Ophthalmol. 2014 Jul;98 Suppl 2(Suppl 2):ii1-9. doi: 10.1136/bjophthalmol-2014-305156. Br J Ophthalmol. 2014. PMID: 24934219 Free PMC article. Review.
-
Correlating Structural and Functional Damage in Glaucoma.J Glaucoma. 2019 Dec;28(12):1079-1085. doi: 10.1097/IJG.0000000000001346. J Glaucoma. 2019. PMID: 31478953 Review.
Cited by
-
Superficial and Deep Macula Vessel Density in Healthy, Glaucoma Suspect, and Glaucoma Eyes.J Glaucoma. 2021 Jun 1;30(6):e276-e284. doi: 10.1097/IJG.0000000000001860. J Glaucoma. 2021. PMID: 33899812 Free PMC article.
-
3D engineering for optic neuropathy treatment.Drug Discov Today. 2021 Jan;26(1):181-188. doi: 10.1016/j.drudis.2020.09.034. Epub 2020 Oct 7. Drug Discov Today. 2021. PMID: 33038525 Free PMC article. Review.
-
Pluripotent Stem Cell-Based Approaches to Explore and Treat Optic Neuropathies.Front Neurosci. 2018 Sep 20;12:651. doi: 10.3389/fnins.2018.00651. eCollection 2018. Front Neurosci. 2018. PMID: 30294255 Free PMC article. Review.
-
Coherent Interpretation of Entire Visual Field Test Reports Using a Multimodal Large Language Model (ChatGPT).Vision (Basel). 2025 Apr 11;9(2):33. doi: 10.3390/vision9020033. Vision (Basel). 2025. PMID: 40265401 Free PMC article.
-
Evaluation and management of systemic corticosteroids-induced ocular hypertension in children with non-Hodgkin lymphoma.Front Pediatr. 2022 Aug 12;10:982224. doi: 10.3389/fped.2022.982224. eCollection 2022. Front Pediatr. 2022. PMID: 36034558 Free PMC article.
References
-
- Heijl A, Leske MC, Bengtsson B, et al. Reduction of intraocular pressure and glaucoma progression: results from the Early Manifest Glaucoma Trial. Arch Ophthalmol. 2002;120:1268–79. - PubMed
-
- Peters D, Bengtsson B, Heijl A. Lifetime risk of blindness in open-angle glaucoma. Am J Ophthalmol. 2013;156:724–30. - PubMed
-
- Hattenhauer MG, Johnson DH, Ing HH, et al. The probability of blindness from open-angle glaucoma. Ophthalmology. 1998;105:2099–104. - PubMed
-
- Sommer A, Miller NR, Pollack I, Maumenee AE, George T. The nerve fiber layer in the diagnosis of glaucoma. Arch Ophthalmol. 1977;95:2149–56. - PubMed
Publication types
MeSH terms
Grants and funding
LinkOut - more resources
Full Text Sources
Other Literature Sources
Medical
Miscellaneous
