. 2018 Sep 28;19(5):776-792.
doi: 10.1093/bib/bbx008.

Selecting between-sample RNA-Seq normalization methods from the perspective of their assumptions

Affiliations

Selecting between-sample RNA-Seq normalization methods from the perspective of their assumptions

Ciaran Evans et al. Brief Bioinform. .

Abstract

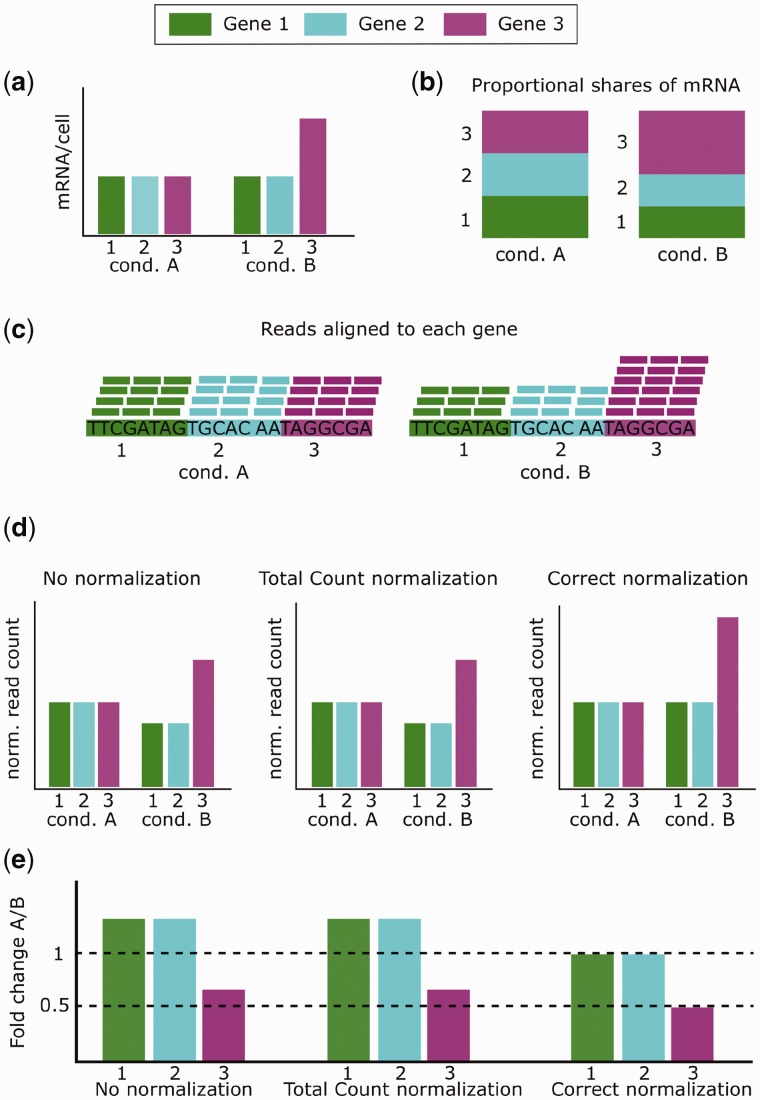
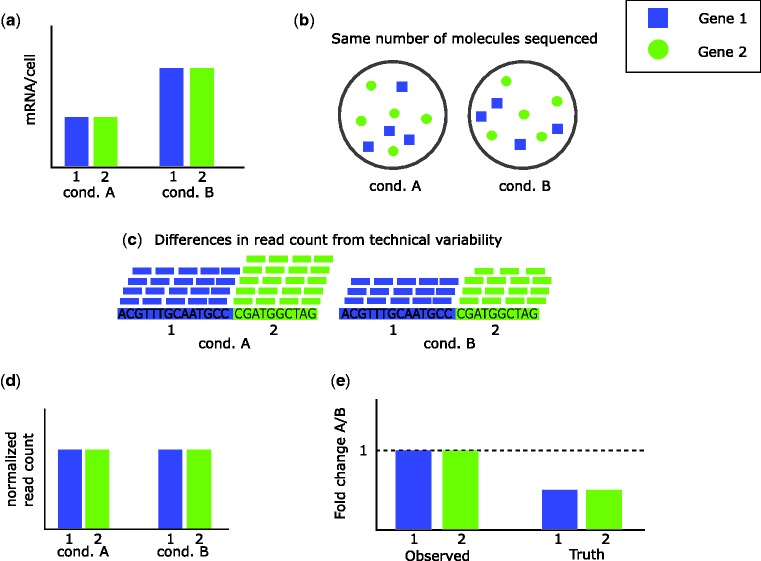
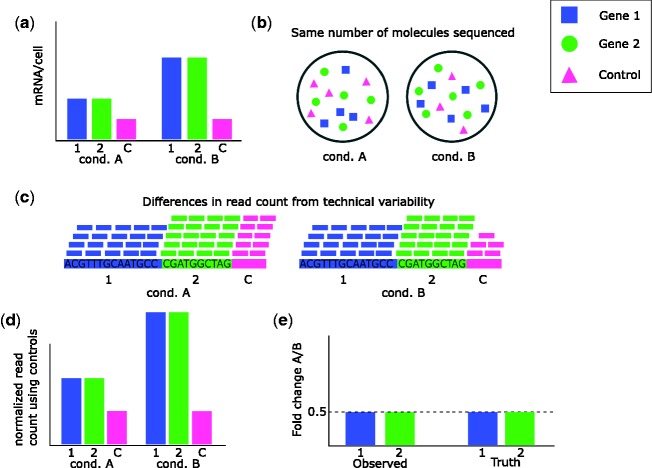
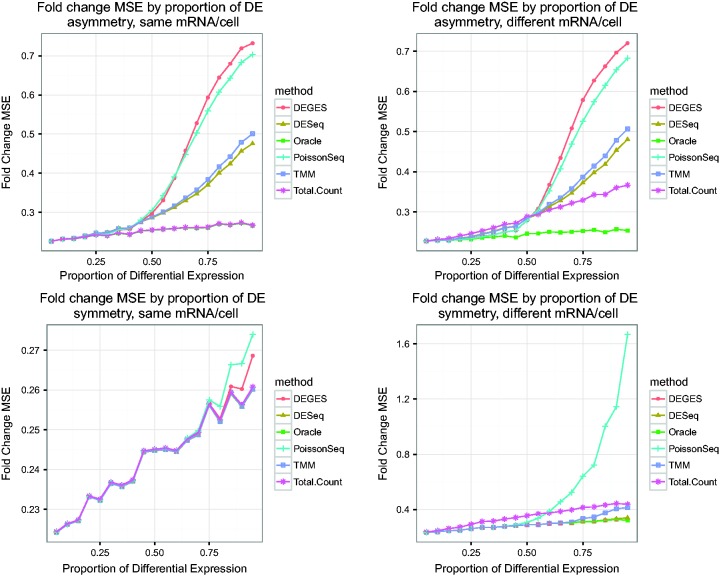
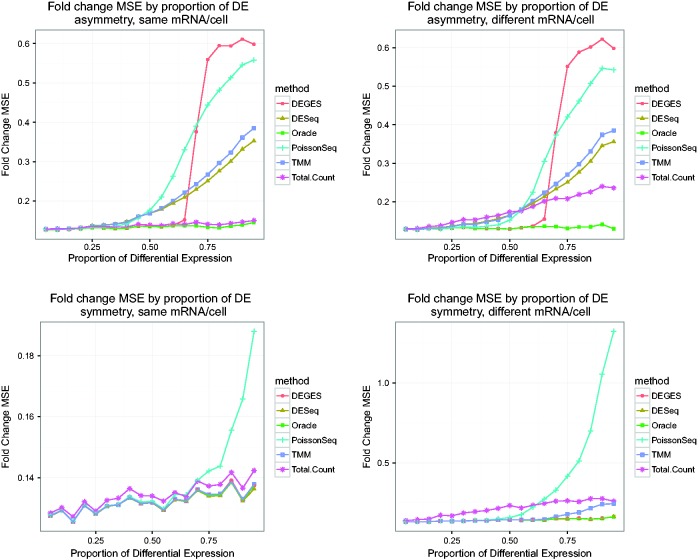
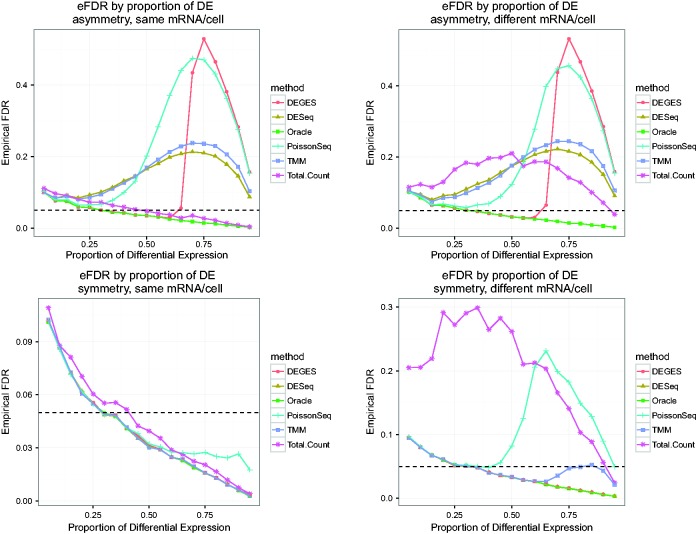
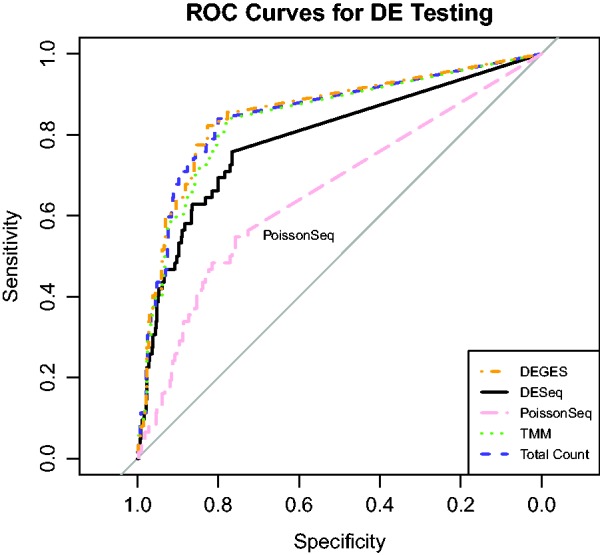
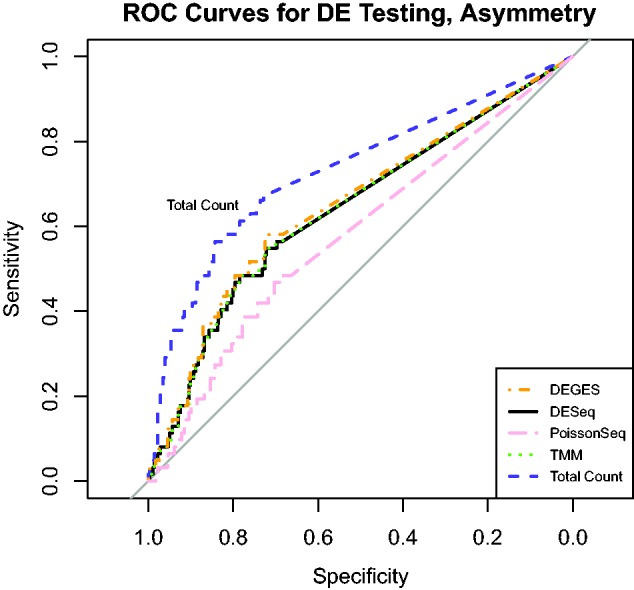
RNA-Seq is a widely used method for studying the behavior of genes under different biological conditions. An essential step in an RNA-Seq study is normalization, in which raw data are adjusted to account for factors that prevent direct comparison of expression measures. Errors in normalization can have a significant impact on downstream analysis, such as inflated false positives in differential expression analysis. An underemphasized feature of normalization is the assumptions on which the methods rely and how the validity of these assumptions can have a substantial impact on the performance of the methods. In this article, we explain how assumptions provide the link between raw RNA-Seq read counts and meaningful measures of gene expression. We examine normalization methods from the perspective of their assumptions, as an understanding of methodological assumptions is necessary for choosing methods appropriate for the data at hand. Furthermore, we discuss why normalization methods perform poorly when their assumptions are violated and how this causes problems in subsequent analysis. To analyze a biological experiment, researchers must select a normalization method with assumptions that are met and that produces a meaningful measure of expression for the given experiment.


Figures

Figure 1
Figure 1
One highly expressed gene. An experiment is performed with conditions A and B to compare expression for the three genes (1, 2 and 3). (A) Gene 3 is 2-fold up-regulated under condition B, while the other genes are not DE; the quantity of mRNA/cell (in bp) is the same for genes 1 and 2, but is twice as high for gene 3 under condition B. (B) Because of the change in expression of gene 3, the shares of mRNA in the cell are different between conditions. Under condition A, each gene gets one-third, whereas under condition B, gene 3 gets half while the other two get one-fourth. (C) Differences in shares of mRNA are reflected in the shares of reads. Each sample has the same total number of reads, but the distribution is different between the conditions, matching the distribution of mRNA in (B). (D) When no normalization is performed, there are apparent differences in read counts for all three genes. Total count normalization produces the exact same result as no normalization at all, as the total read count for each sample is the same. In truth, there is no difference in expression for genes 1 and 2, and the relative count for gene 3 should be higher than found by no normalization or total count normalization. Correct normalization, therefore, makes the read counts of the non-DE genes equivalent, which also makes the relative expression of gene 3 correct. (E) No normalization and total count normalization fail to equilibrate the read counts of the non-DE genes, resulting in each gene appearing DE, and the truly DE gene (gene 3) having the wrong fold change. Correct normalization reveals no difference in expression for the non-DE genes and the correct fold change for gene 3.
Figure 2
Figure 2
Global shift in expression. There are two genes, and an experiment is performed to compare expression between condition A and condition B. (A) There is global up-regulation under condition B versus condition A, with both genes having twice the expression under condition B. Within each condition, the two genes produce the same amount of mRNA/cell (measured in bp). (B) In the RNA-Seq experiment, the same number of molecules are sequenced from each of the two samples. Proportionally, the mRNA composition is the same under each condition, and so the composition of molecules sequenced is also the same. Within each condition, the two genes produce the same amount of mRNA (in bp) but gene 2 is four-fifth the length of gene 1, so must produce five-fourth the number of molecules that gene 1 does. (C) Sequenced reads are aligned to the reference genome and mapped to each gene. The distribution of reads is the same in each sample, but by chance the sample for condition A happens to have more reads in total. (D) Normalization is performed, which removes the differences in read count from technical variability, so the read count for each gene is the same across conditions. (E) Because the normalized read counts are the same, the observed fold change for each gene is 1, indicating no differential expression. However, genes are really twice as expressed under condition B and so in truth we should see half the expression when comparing A with B.
Figure 3
Figure 3
Differential expression and (a)symmetry. There are six genes, and two experimental conditions. (A) Differential expression is asymmetric (three up-regulated genes under condition A, one under condition B). The total mRNA/cell (summed over the six genes) is the same under both conditions. (B) Differential expression is asymmetric. The total mRNA/cell is different (less total mRNA/cell under condition B). (C) Differential expression is symmetric (two up-regulated genes under each condition). The total mRNA/cell is the same under both conditions. (D) Differential expression is symmetric. The total mRNA/cell is different (more total mRNA/cell under condition B).
Figure 4
Figure 4
Use of negative controls with shift in expression. Two genes are investigated for differential expression between condition A and condition B. A negative control is used for normalization (could be a known non-DE gene or spike-in control). (A) Both non-control genes are up-regulated under condition B versus condition A, having twice the expression under condition B. As a negative control, the control has the same expression under both conditions. (B) In the RNA-Seq experiment, the same number of molecules is sequenced from each sample. As the control has a smaller share of the mRNA in condition B, there are fewer control molecules in the sample for condition B. (C) Variability leads to differences in the total read count for the two samples. The share of the reads aligned to the control is the share of mRNA from the control. (D) The control should have the same expression in both conditions, so normalization is performed to equalize the normalized read count for the control, resulting in normalized read counts that reflect the correct mRNA/cell levels. (E) Because normalized counts correctly reflect mRNA/cell, the observed fold change agrees with the truth.
Figure 5
Figure 5
Impact of amount of asymmetry and amount of mRNA/cell on fold change estimates, 10 000 genes and four samples. These plots show the average log fold-change MSE for non-DE genes of several methods. Simulated data are used, with 10 000 genes and two replicates per condition, and varying proportions of differential expression (5–95%). Genes simulated to be non-DE should have an observed log fold-change close to 0; the MSE is thus calculated by averaging the squared observed log fold-changes for each non-DE gene (treating the true log fold-change as 0). Because of variability in the generation of read count data, the observed log fold-change will in general not be exactly 0, so the Oracle normalization method (normalizing the data with the correct normalization factors given the simulation) serves as a baseline. Methods with MSEs that closely follow those of Oracle normalization are doing well. Asymmetric differential expression was simulated as 75% of the set of DE genes up-regulated in one condition and 25% up-regulated in the other. Under symmetric differential expression, 50% of DE genes are up-regulated in each condition. For simulations with the same mRNA/cell, non-DE genes had the same proportion of reads in each condition; simulations with different mRNA/cell resulted in non-DE genes having different shares of the reads in the different conditions.
Figure 6
Figure 6
Impact of amount of asymmetry and amount of mRNA/cell on error control, 10 000 genes and four samples. These plots show the average empirical FDR of several methods on simulated data with varying proportions of differential expression (5–95%). The simulations are performed with two conditions, with 10 000 genes and two replicates per condition. Asymmetric differential expression was simulated as 75% of the set of DE genes up-regulated in one condition and 25% up-regulated in the other. Under symmetric differential expression, 50% of DE genes are up-regulated in each condition. For simulations with the same mRNA/cell, non-DE genes had the same proportion of reads in each condition; simulations with different mRNA/cell resulted in non-DE genes having different shares of the reads in the different conditions. The black dashed line is at 0.05, the nominal FDR using the Benjamini–Hochberg adjustment. Deviations of the oracle value from the nominal value (starting above 0.05 and falling below as the proportion of DE increases) are a result of DESeq2 hypothesis testing and the conservativeness of Benjamini–Hochberg.
Figure 7
Figure 7
Impact of amount of asymmetry and amount of mRNA/cell on fold change estimates, 1000 genes and 10 samples. These plots show the average log fold-change MSE for non-DE genes of several methods. Simulated data are used, with 1000 genes and 5 replicates per condition, and varying proportions of differential expression (5–95%). Genes simulated to be non-DE should have an observed log fold-change close to 0; the MSE is thus calculated by averaging the squared observed log fold-changes for each non-DE gene (treating the true log fold-change as 0). Because of variability in the generation of read count data, the observed log fold-change will in general not be exactly 0, so the Oracle normalization method (normalizing the data with the correct normalization factors given the simulation) serves as a baseline. Methods with MSEs that closely follow those of Oracle normalization are doing well. Asymmetric differential expression was simulated as 75% of the set of DE genes up-regulated in one condition and 25% up-regulated in the other. Under symmetric differential expression, 50% of DE genes are up-regulated in each condition. For simulations with the same mRNA/cell, non-DE genes had the same proportion of reads in each condition; simulations with different mRNA/cell resulted in non-DE genes having different shares of the reads in the different conditions.
Figure 8
Figure 8
Impact of amount of asymmetry and amount of mRNA/cell on error control, 1000 genes and 10 samples. These plots show the average empirical FDR of several methods on simulated data with varying proportions of differential expression (5–95%). The simulations are performed with two conditions, with 1000 genes and five replicates per condition. Asymmetric differential expression was simulated as 75% of the set of DE genes up-regulated in one condition and 25% up-regulated in the other. Under symmetric differential expression, 50% of DE genes are up-regulated in each condition. For simulations with the same mRNA/cell, non-DE genes had the same proportion of reads in each condition; simulations with different mRNA/cell resulted in non-DE genes having different shares of the reads in the different conditions. The black dashed line is at 0.05, the nominal FDR using the Benjamini–Hochberg adjustment. Deviations of the oracle value from the nominal value (starting above 0.05 and falling below as the proportion of DE increases) are a result of DESeq2 hypothesis testing and the conservativeness of Benjamini–Hochberg.
Figure 9
Figure 9
Distribution of qRT-PCR mean LFC. The histogram shows the distribution of the LFC comparing the average PCR measures of expression between SEQC samples A and B in each gene. The distribution is symmetric around 0, indicating that each sample has the same number of up- and down-regulated genes. Additionally, the shape of the distribution is similar on both sides of 0, suggesting that there are similar amounts of mRNA/cell for each sample.
Figure 10
Figure 10
ROC curves for each normalization method using SEQC data. This figure displays the ROC performance of each method using RNA-Seq data for 733 PCR-validated genes. False positives and false negatives are determined by the PCR validation, and no-call genes are ignored in the construction of the ROC curves.
Figure 11
Figure 11
ROC curves for each normalization method using SEQC data. This figure displays the ROC performance of each method using RNA-Seq data for 619 PCR-validated genes. False positives and false negatives are determined by the PCR validation, and no-call genes are ignored in the construction of the ROC curves. The genes are a subset chosen for asymmetric differential expression, so that 75% of DE genes are up-regulated in sample A and 25% are up-regulated in sample B.

References

    1. Shendure J. The beginning of the end for microarrays? Nat Methods 2008;5(7):585–7. - PubMed
    1. Oshlack A, Robinson MD, Young MD.. From RNA-seq reads to differential expression results. Genome Biol 2010;11(12):220. - PMC - PubMed
    1. Wang Z, Gerstein M, Snyder M.. RNA-Seq: a revolutionary tool for transcriptomics. Nat Rev Genet 2009;10(1):57–63. - PMC - PubMed
    1. Auer PL, Srivastava S, Doerge R.. Differential expression - the next generation and beyond. Brief Funct Genomics 2012;11(1):57–62. - PubMed
    1. Oshlack A, Wakefield MJ.. Transcript length bias in RNA-seq data confounds systems biology. Biol Direct 2009;4(1):1–10. - PMC - PubMed

Publication types

MeSH terms