

Variance component score test for time-course gene set analysis of longitudinal RNA-seq data
- PMID: 28334305
- PMCID: PMC5862256
- DOI: 10.1093/biostatistics/kxx005
Variance component score test for time-course gene set analysis of longitudinal RNA-seq data
Abstract
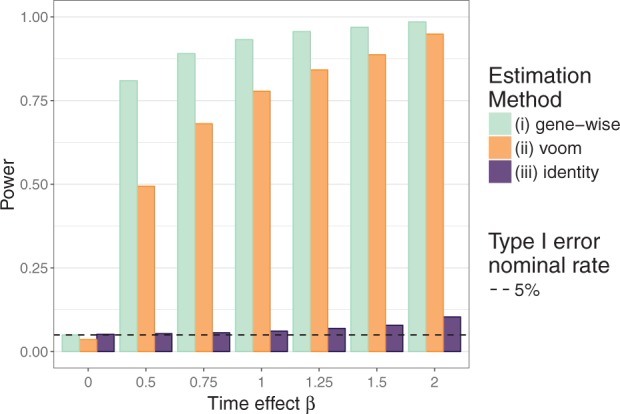
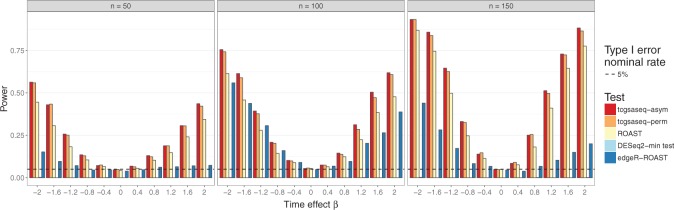
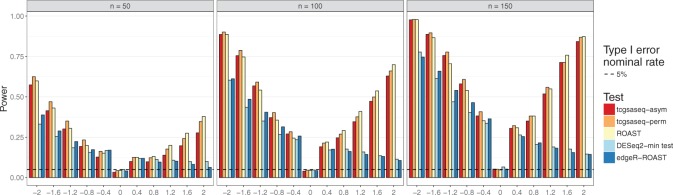
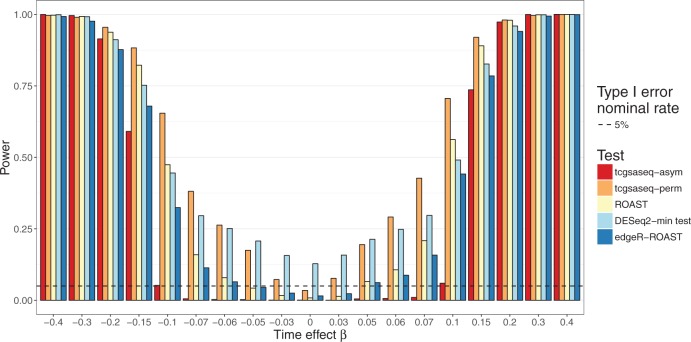
As gene expression measurement technology is shifting from microarrays to sequencing, the statistical tools available for their analysis must be adapted since RNA-seq data are measured as counts. It has been proposed to model RNA-seq counts as continuous variables using nonparametric regression to account for their inherent heteroscedasticity. In this vein, we propose tcgsaseq, a principled, model-free, and efficient method for detecting longitudinal changes in RNA-seq gene sets defined a priori. The method identifies those gene sets whose expression varies over time, based on an original variance component score test accounting for both covariates and heteroscedasticity without assuming any specific parametric distribution for the (transformed) counts. We demonstrate that despite the presence of a nonparametric component, our test statistic has a simple form and limiting distribution, and both may be computed quickly. A permutation version of the test is additionally proposed for very small sample sizes. Applied to both simulated data and two real datasets, tcgsaseq is shown to exhibit very good statistical properties, with an increase in stability and power when compared to state-of-the-art methods ROAST (rotation gene set testing), edgeR, and DESeq2, which can fail to control the type I error under certain realistic settings. We have made the method available for the community in the R package tcgsaseq.
Keywords: Gene Set Analysis; Heteroscedasticity; Longitudinal data; RNA-seq data; Variance component testing.
© The Author 2017. Published by Oxford University Press. All rights reserved. For permissions, please e-mail: journals.permissions@oup.com.
Figures
References
-
- Carroll, R. J. (1982). Adapting for heteroscedasticity in linear models. The Annals of Statistics 10, 1224–1233.
-
- Commenges, D. and Andersen, P. K. (1995). Score test of homogeneity for survival data. Lifetime Data Analysis 1, 145–156. - PubMed
MeSH terms
LinkOut - more resources
Full Text Sources
Other Literature Sources
