Case Reports
. 2018 May 1;28(5):1685-1699.
doi: 10.1093/cercor/bhx066.

A Template and Probabilistic Atlas of the Human Sensorimotor Tracts using Diffusion MRI

Affiliations
Case Reports

A Template and Probabilistic Atlas of the Human Sensorimotor Tracts using Diffusion MRI

Derek B Archer et al. Cereb Cortex. .

Abstract

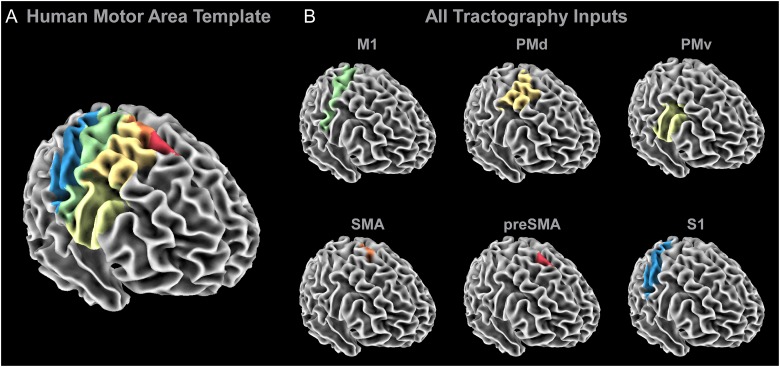
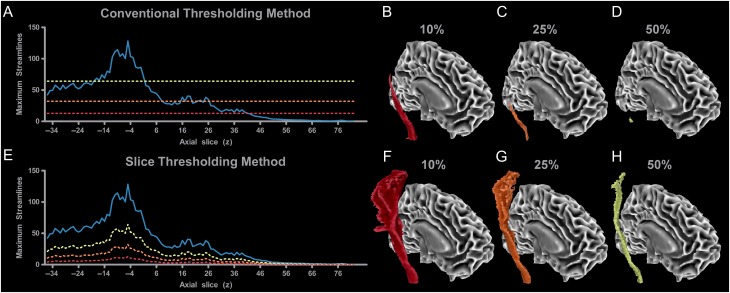
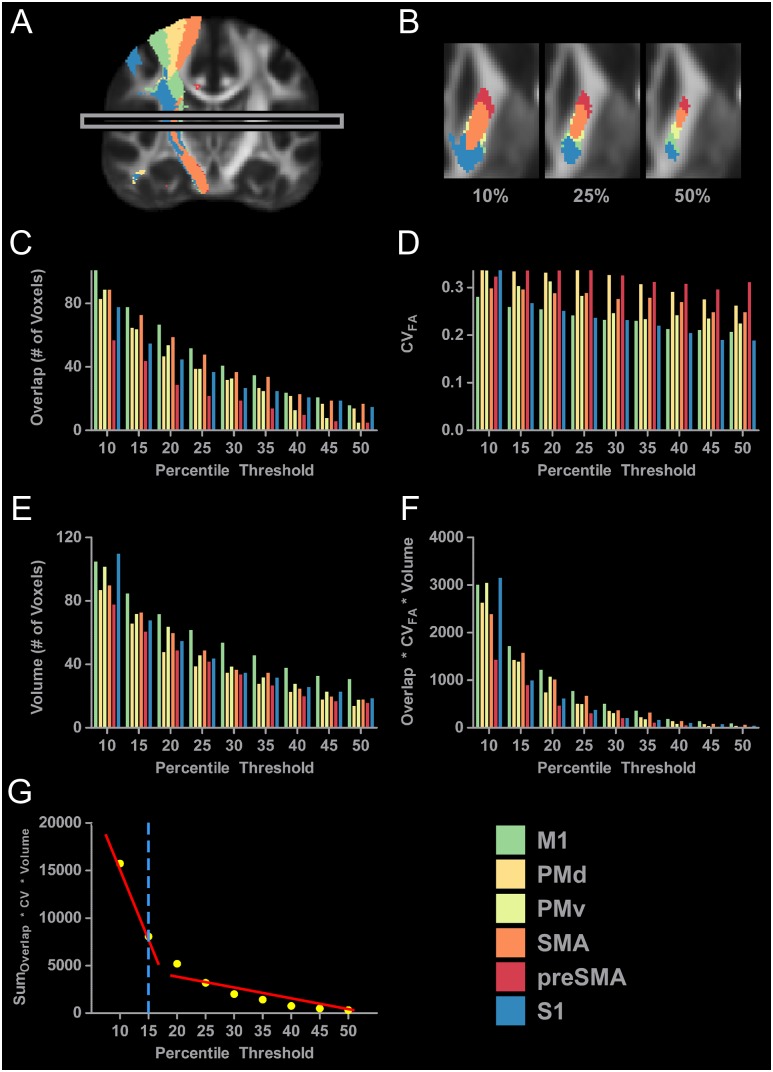
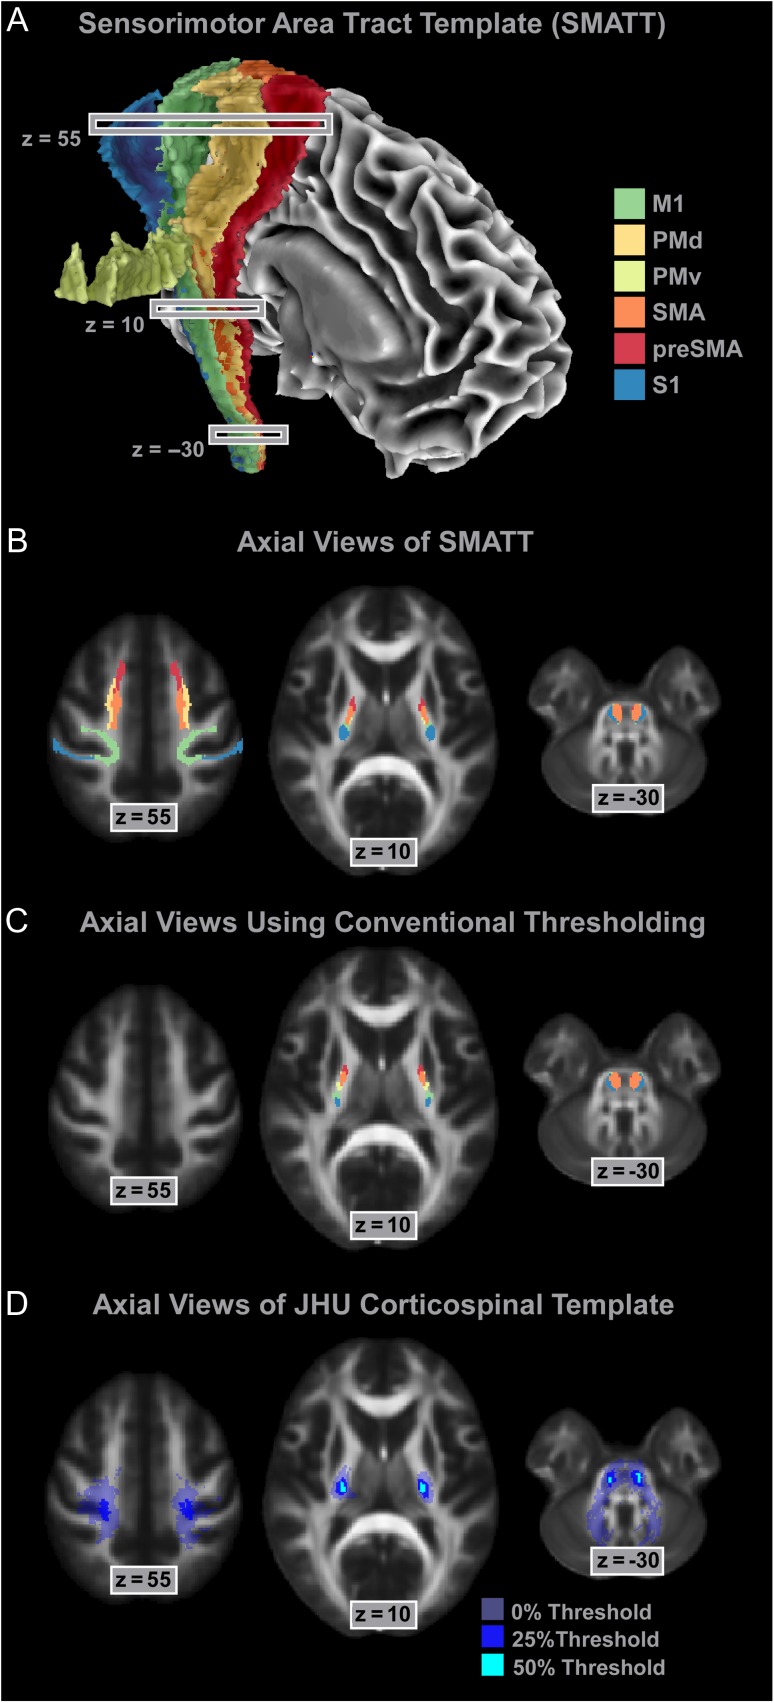
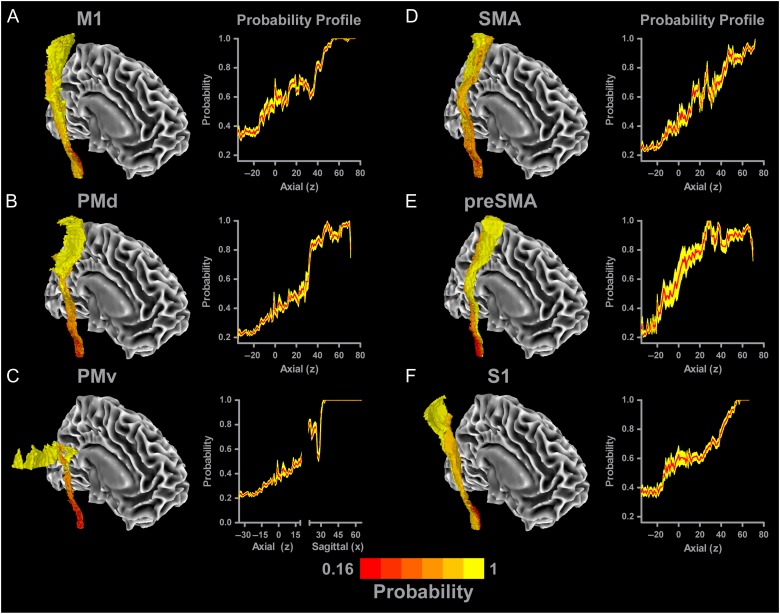
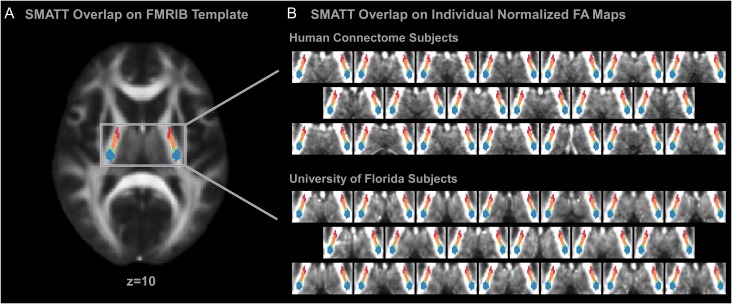
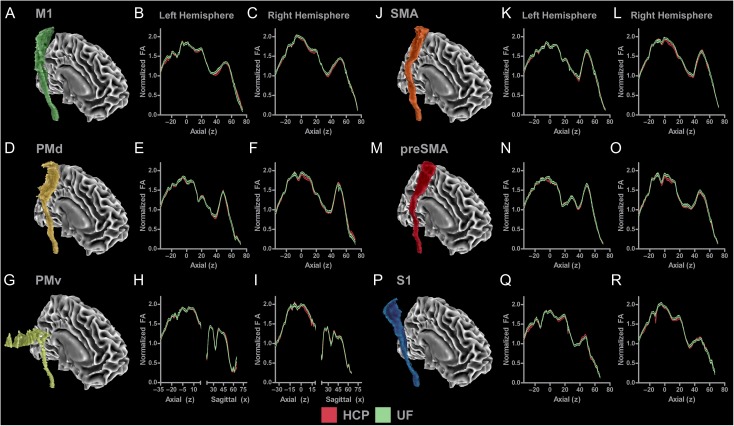
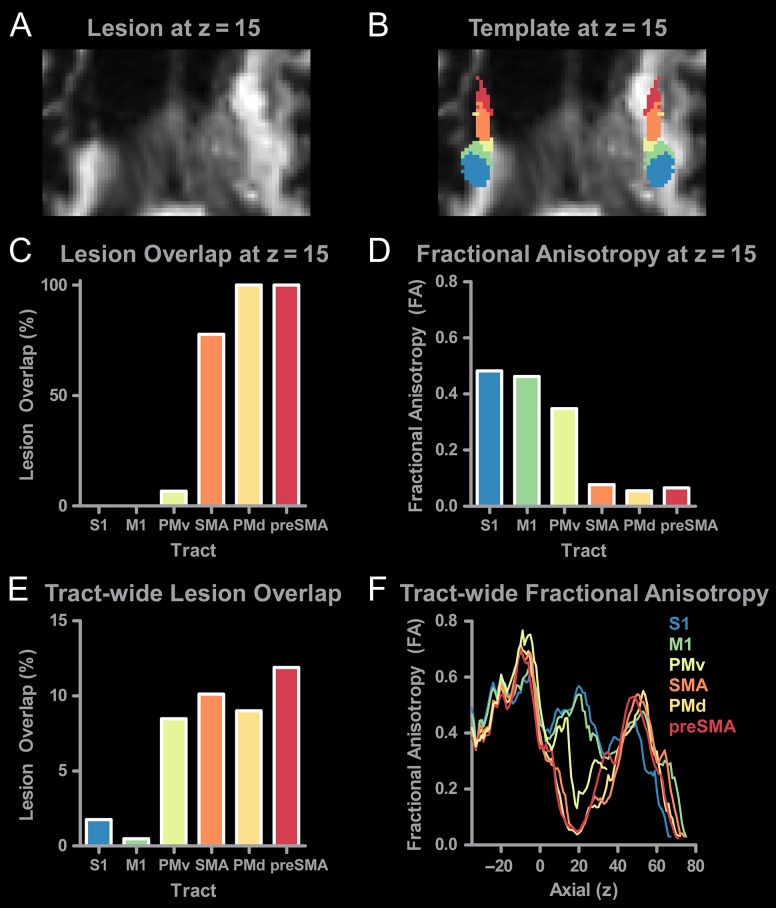
The purpose of this study was to develop a high-resolution sensorimotor area tract template (SMATT) which segments corticofugal tracts based on 6 cortical regions in primary motor cortex, dorsal premotor cortex, ventral premotor cortex, supplementary motor area (SMA), pre-supplementary motor area (preSMA), and primary somatosensory cortex using diffusion tensor imaging. Individual probabilistic tractography analyses were conducted in 100 subjects using the highest resolution data currently available. Tractography results were refined using a novel algorithm to objectively determine slice level thresholds that best minimized overlap between tracts while preserving tract volume. Consistent with tracing studies in monkey and rodent, our observations show that cortical topography is generally preserved through the internal capsule, with the preSMA tract remaining most anterior and the primary somatosensory tract remaining most posterior. We combine our results into a freely available white matter template named the SMATT. We also provide a probabilistic SMATT that quantifies the extent of overlap between tracts. Finally, we assess how the SMATT operates at the individual subject level in another independent data set, and in an individual after stroke. The SMATT and probabilistic SMATT provide new tools that segment and label sensorimotor tracts at a spatial resolution not previously available.


Figures

Figure 1.
Figure 1.
Probabilistic tractography inputs. (A) The regions within the HMAT were used as seed regions in the probabilistic tractography analyses. (B) A separate probabilistic tractography analysis was conducted for M1 (green), PMd (dark yellow), PMv (light yellow), SMA (orange), preSMA (red), and S1 (blue), in which a planar waypoint was placed at the level of the PLIC (z = 7 to 9) and the CP (z = −31 to −29). Additionally, transcallosal streamlines were excluded by including a planar exclusion mask at the midline (x = −1 to 1).
Figure 2.
Figure 2.
Tract level thresholding versus slice level thresholding in the M1 tract. (A) When performing probabilistic tractography from M1 to the CP, the number of streamlines per slice varies (blue line), in which there is a peak number of streamlines at z = −5. Conventional tract level thresholding calculates the maximum number of streamlines within the profile and bases the threshold on a percentage of this value. Thresholds can be arbitrarily set at 10% (red line), 25% (orange line), or 50% (yellow line) of the peak value. Higher thresholds lead to a reduction in tract volume (BD). Blue lines that fall below the threshold line would be excluded from the final results. Therefore, a threshold of 10% results in some loss of cortical volume (z > 40 eliminated), while a 25% threshold results in additional loss of volume in the cortex (z > 8 eliminated). At 50%, the only slices which remain are within the PLIC (z = −16 to 0 remain). (E) By splitting the tract into individual slices, each slice can be thresholded independently. A benefit of this method is that it does not result in any excluded slices within the tract. At 10%, tract volume is high. At 25% and 50% the volume of the tract decreases but volume is maintained in every slice of the tract (FH).
Figure 3.
Figure 3.
Slice level thresholding of sensorimotor tract data. (A) The probabilistic tractography results for all 6 sensorimotor tracts in the right hemisphere at the 10% threshold level. At this low threshold, aberrant voxels are still present. For instance, red voxels that are associated with the preSMA tract can be seen above the corpus callosum, and blue and yellow voxels can be been in the ventral temporal lobe. The presence of these aberrant voxels support our position that thresholding the entire tract at one relatively low percentile can lead to the inclusion of lowly probably voxels. The gray box identifies the individual slice (z = 10) that is analyzed in Figure 3BG. (B) Axial slices of the PLIC in the right hemisphere with the sensorimotor tracts thresholded at 10%, 25%, and 50%. Increases in threshold lead to a decrease in volume and a decrease in overlap between the tracts. (C) Overlap of each sensorimotor tract with every other sensorimotor tract was calculated at each percentile. The 6 sensorimotor tracts were thresholded at 9 percentiles. (D) The CVFA of each sensorimotor tract was calculated for each percentile threshold. (E) The volume of each sensorimotor tract was calculated for each percentile threshold. (F) The overlap, CVFA, and volume were incorporated into one variable and calculated for each tract at each percentile threshold. (G) Values shown in 3F were summed across tracts for each percentile (yellow dots) and a segmented regression analysis was conducted. Two lines were fit to the data (red lines), and the breakpoint was calculated to be at 17.24%. Threshold levels were rounded to the nearest multiple of 5 within the 10–50% range. The threshold for this slice was selected as 15% (blue dashed line).
Figure 4.
Figure 4.
The SMATT. (A) The assembled SMATT (M1—green; PMd—dark yellow; PMv—light yellow; SMA—orange; preSMA—red; S1—blue). Note that nonuniformity in the lateral portion of the PMv tract is driven by the tract traveling around gray matter. (B) Axial slices of the SMATT in the cortex (z = 55), PLIC (z = 10), and CP (z = −30). (C) To compare independent slice level thresholding and tract level thresholding, we used the average slice level threshold (18%) to threshold each entire tract. At z = 55 there is no volume in any cortical tracts. At z = 10 and z = −30 tract location follows a similar pattern as the SMATT. (D) Axial slices of the Johns–Hopkins corticospinal template thresholded at 0%, 25%, and 50% in the cortex (z = 55), PLIC (z = 10), and CP (z = −30).
Figure 5.
Figure 5.
Probabilistic SMATT. Each tract was overlaid with one another to quantify the amount of overlap between tracts so that a probabilistic value could be calculated for each voxel in the template. The mean probability of each slice is shown with a red line, with the yellow shading representing the mean ± SEM. A view of each tract (A—M1; B—PMd; C—PMv; D—SMA; E—preSMA; F—S1) is shown, in which darker red colors indicate higher overlap with other tracts (i.e., low probability voxel is only part of one tract), whereas brighter yellow colors identify voxels with low overlap with other tracts (i.e., high probability voxel is only part of one tract). Probability profiles are shown for each tract. As the tracts reach more superior regions, the probability of voxels being unique to a particular sensorimotor tract increases.
Figure 6.
Figure 6.
SMATT overlaid on individual subject data. (A) SMATT overlaid on an axial slice of the FMRIB anatomical template at the level of the PLIC (z = 10). (B) The SMATT overlaid on individual subject anatomical images in standard space. Individual data from 20 subjects collected as part of the Human Connectome Project and individual data from 20 subjects collected at the University of Florida are shown. The SMATT is well aligned in both groups for all tracts. Axial slices are shown at z = 10 which is within the PLIC. M1—green; PMd—dark yellow; PMv—light yellow; SMA—orange; preSMA—red; S1—blue.
Figure 7.
Figure 7.
Mean normalized FA profiles for each tract for each hemisphere for data collected as part of the Human Connectome Project and data collected at the University of Florida (UF). (A) M1 tract in the right hemisphere. (B) Slice-by-slice profile of normalized FA values in M1 tract in the left hemisphere. (C) Slice-by-slice profile of normalized FA values in M1 tract in the right hemisphere. HCP data are represented with black lines and red shading (mean ± SEM). UF data are represented with black lines and green shading (mean ± SEM). HCP and UF profiles show a similar pattern in the M1 tract across group and hemisphere. Profiles were created for each of the 5 remaining sensorimotor tracts in both hemispheres and are shown in Figures (D–R).
Figure 8.
Figure 8.
Correlations of SMATT FA with Age. FA profiles were created for each individual. FA values for each tract were summed to create an area under the curve measure. This measure was correlated with age for all tracts in the left (AF) and the right (GL) hemisphere. No significant correlations were found between FA and age.
Figure 9.
Figure 9.
Using the SMATT to assess tract-specific damage after stroke. (A) Diffusion-weighted image at z = 15 showing lesion damage to the internal capsule. (B) SMATT overlaid on the diffusion-weighted image. (C) Lesion overlap was calculated for each tract in the left hemisphere at z = 15. No lesion overlap was found for S1 or M1. Extensive overlap was found for SMA, preSMA, PMv, and PMd. (D) FA was calculated for each tract at z = 15. FA was greatest in more posterior regions of the tract (S1, M1) as compared to anterior regions (SMA, preSMA, PMd, and PMv). (E) Tract-wide lesion overlap in all left hemisphere tracts. (F) Tract-specific FA profiles were calculated for each slice for each sensorimotor tract. Profiles directly impacted by the stroke (SMA, preSMA, PMd, and PMd) can be identified based on the distinct reductions in FA between z = 5 and z = 40.

References

    1. Andersson JL, Sotiropoulos SN. 2015. Non-parametric representation and prediction of single- and multi-shell diffusion-weighted MRI data using Gaussian processes. Neuroimage. 122:166–176. - PMC - PubMed
    1. Andersson JL, Sotiropoulos SN. 2016. An integrated approach to correction for off-resonance effects and subject movement in diffusion MR imaging. Neuroimage. 125:1063–1078. - PMC - PubMed
    1. Archer DB, Misra G, Patten C, Coombes SA. 2016. Microstructural properties of premotor pathways predict visuomotor performance in chronic stroke. Hum Brain Mapp. 37:2039–2054. - PMC - PubMed
    1. Barnard JW, Woolsey CN. 1956. A study of localization in the corticospinal tracts of monkey and rat. J Comp Neurol. 105(1):25–50. - PubMed
    1. Behrens TE, Berg HJ, Jbabdi S, Rushworth MF, Woolrich MW. 2007. Probabilistic diffusion tractography with multiple fibre orientations: what can we gain? Neuroimage. 34(1):144–155. - PMC - PubMed

Publication types