

PathwayMapper: a collaborative visual web editor for cancer pathways and genomic data
- PMID: 28334343
- PMCID: PMC5859976
- DOI: 10.1093/bioinformatics/btx149
PathwayMapper: a collaborative visual web editor for cancer pathways and genomic data
Abstract
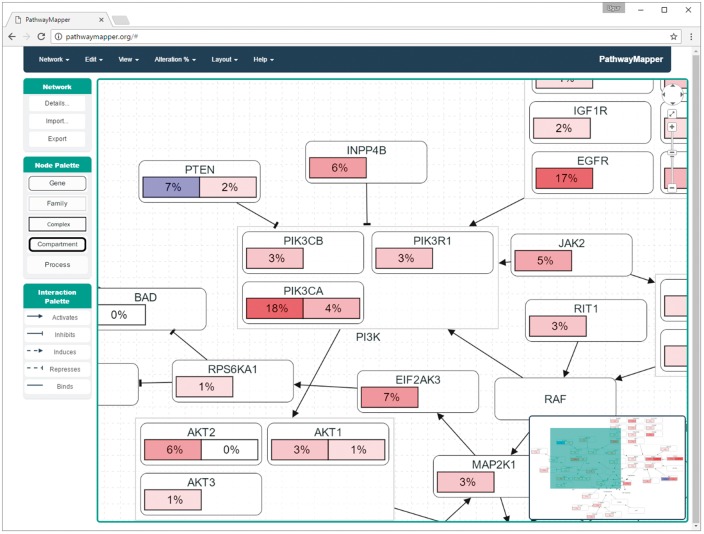
Motivation: While existing network visualization tools enable the exploration of cancer genomics data, most biologists prefer simplified, curated pathway diagrams, such as those featured in many manuscripts from The Cancer Genome Atlas (TCGA). These pathway diagrams typically summarize how a pathway is altered in individual cancer types, including alteration frequencies for each gene.
Results: To address this need, we developed the web-based tool PathwayMapper, which runs in most common web browsers. It can be used for viewing pre-curated cancer pathways, or as a graphical editor for creating new pathways, with the ability to overlay genomic alteration data from cBioPortal. In addition, a collaborative mode is available that allows scientists to co-operate interactively on constructing pathways, with support for concurrent modifications and built-in conflict resolution.
Availability and implementation: The PathwayMapper tool is accessible at http://pathwaymapper.org and the code is available on Github ( https://github.com/iVis-at-Bilkent/pathway-mapper ).
Contact: ivis@cs.bilkent.edu.tr.
Supplementary information: Supplementary data are available at Bioinformatics online.
© The Author (2017). Published by Oxford University Press. All rights reserved. For Permissions, please email: journals.permissions@oup.com
Figures
References
-
- Dogrusoz U. et al. (2009) A layout algorithm for undirected compound graphs. Inf. Sci., 179, 980–994.
-
- Garraway L.A., Lander E.S. (2013) Lessons from the cancer genome. Cell, 153, 17–37. - PubMed
MeSH terms
Grants and funding
LinkOut - more resources
Full Text Sources
Other Literature Sources
