. 2018 May 1;28(5):1610-1624.
doi: 10.1093/cercor/bhx057.

A Critical Role of Inhibition in Temporal Processing Maturation in the Primary Auditory Cortex

Affiliations

A Critical Role of Inhibition in Temporal Processing Maturation in the Primary Auditory Cortex

Dongqin Cai et al. Cereb Cortex. .

Abstract

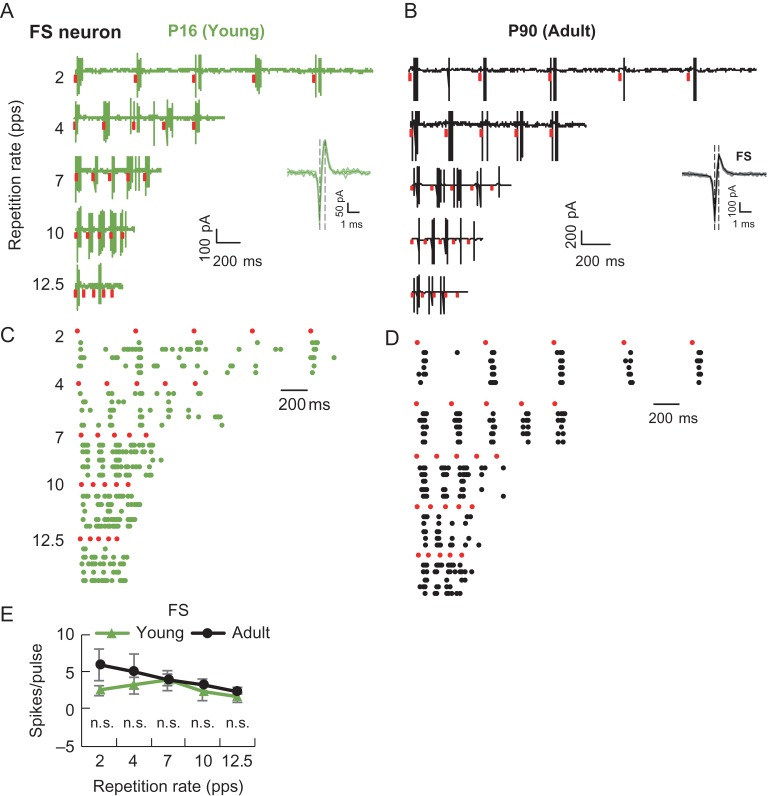
Faithful representation of sound envelopes in primary auditory cortex (A1) is vital for temporal processing and perception of natural sounds. However, the emergence of cortical temporal processing mechanisms during development remains poorly understood. Although cortical inhibition has been proposed to play an important role in this process, direct in-vivo evidence has been lacking. Using loose-patch recordings in rat A1 immediately after hearing onset, we found that stimulus-following ability in fast-spiking neurons was significantly better than in regular-spiking (RS) neurons. In-vivo whole-cell recordings of RS neurons revealed that inhibition in the developing A1 demonstrated much weaker adaptation to repetitive stimuli than in adult A1. Furthermore, inhibitory synaptic inputs were of longer duration than observed in vitro and in adults. Early in development, overlap of the prolonged inhibition evoked by 2 closely following stimuli disrupted the classical temporal sequence between excitation and inhibition, resulting in slower following capacity. During maturation, inhibitory duration gradually shortened accompanied by an improving temporal following ability of RS neurons. Both inhibitory duration and stimulus-following ability demonstrated exposure-based plasticity. These results demonstrate the role of inhibition in setting the pace for experience-dependent maturation of temporal processing in the auditory cortex.


Figures

Figure 1.
Figure 1.
Schematic of electrophysiological recordings from the developing primary ACx (A1). (A) Loose-patch recordings from RS and FS neurons in Layer 4 in vivo. (B) Trains of white-noise pulses with various repetition rates (2–12.5 pps [pulse per second]) were used to characterize the temporal response resolution of cortical neurons. The voltage amplitude corresponds to sound intensity of 80 dB SPL.
Figure 2.
Figure 2.
Regular-spiking (RS) neurons in the developing A1 demonstrated poor stimulus-following ability compared with that in adult A1. (A and B) Respective temporal responses of P16 and P90 RS neurons. Red bars, stimulus pulses. Insets, light color, superimposed individual spikes; dark color, average spike; vertical line, indication of trough and peak time in the action potential. (C and D) Raster plots corresponding to neurons in (A) and (B). (E) Number of spikes evoked by each stimulation pulse in RS neurons. Young, n = 30; adult, n = 30. Data in (E) are means ± SEM (error bars). Mann–Whitney U-test (*P < 0.05; **P < 0.01; ***P < 0.001; n.s. P > 0.05).
Figure 3.
Figure 3.
FS neurons in both developing and adult A1 exhibited superior stimulus-following ability. (A and B) Respective temporal responses of P16 and P90 FS neurons. Red bars, stimulus pulses. Insets, light color, superimposed individual spikes; dark color, average spike; vertical line, indication of trough and peak time in the action potential. (C and D) Raster plots corresponding to neurons in (A) and (B). (E) Number of spikes evoked by each stimulation pulse in FS neurons. Data are means ± SEM (error bars). Young, n = 6; Adult, n = 6. Mann–Whitney U-test (n.s. P > 0.05).
Figure 4.
Figure 4.
Characterization of the adaptation of RS and FS neurons across different repetition rates. (A) Distribution of average trough-to-peak intervals of action potential for young (n = 36) and adult (n = 36) neurons. RS (young, n = 30; adult, n = 30) and FS (young, n = 6; adult, n = 6) neurons were well separated according to the trough-to-peak intervals (young, RS: 0.96 ± 0.22 ms, FS: 0.27 ± 0.08 ms; adult, RS: 0.89 ± 0.19 ms, FS: 0.19 ± 0.04 ms). (B) Left, adaptation indicated by normalized responses of RS neurons across different repetition rates. Green hollow triangles, individual neurons from young animals; black hollow circles, individual neurons from adult animals; green solid triangles, mean value from young animals; black solid circles, mean value from adult animals. Right, comparison of spiking probability between the 2 age groups. Young, n = 22; adult, n = 22. (C) Adaptation indicated by normalized responses of FS neurons across different repetition rates. Data in (B) (Left) and (C) are means ± SD (error bars). Statistical analysis is Mann–Whitney U-test. Data in (B) (right) is means ± SEM (error bars). Statistical analysis is unpaired t-test (*P < 0.05; **P < 0.01; ***P < 0.001; n.s. P > 0.05).
Figure 5.
Figure 5.
Inhibition restrains temporal processing capacity of RS neurons in the developing A1. (A) Left, schematic of in-vivo whole-cell recordings from RS neurons. Middle, synaptic currents recorded at different holding potentials from the same neuron. Black arrowhead, onset of stimuli. Right, IV curves for synaptic currents averaged within 1–2 ms (red) and 21–22 ms (black) windows after response onset. (B) A Layer 4 pyramidal neuron in a P17 rat labelled during in-vivo whole-cell recording. Solid line, pial surface. Dashed lines, layer borders. (C and D) Synaptic temporal inhibition (Inh) and excitation (Exc) evoked in P16 and P90 neurons, respectively. Insets, magnified view of synaptic conductance at 7 pps. Vertical dashed line, onset of second stimulus pulse (all magnified views below conform to this description). (E and F) Comparison of decay time constant (τdecay), peak amplitude of synaptic conductance and the I:E ratio between young and adult rats. Mann–Whitney U-test. Young, n = 48; adult, n = 37. (G) Adaptation of synaptic responses at each repetition rate indicated by normalized response. One-way ANOVA with Bonferroni post-hoc test (**P < 0.01; ***P < 0.001; n.s. P > 0.05). Young, n = 48; adult, n = 37. (H) Comparison of onset latency and the delay of inhibition relative to excitation between the 2 age groups. Young, n = 22; adult, n = 22. Statistical analysis is Mann–Whitney U-test. (I) Comparison of resting membrane potential and firing threshold between the 2 age groups. Young, n = 15; adult, n = 10. Statistical analysis is the Mann–Whitney U-test (***P < 0.001; n.s. P > 0.05). Data in (E) to (G) are means ± SEM (error bars). Colors in (E), (F), and (G) share the same meaning as those in (C) and (D).
Figure 6.
Figure 6.
Maturational course of synaptic decay time and the I:E ratio during development. (A and B) Developmental change in inhibitory and excitatory decay times. (C) Developmental change in the I:E ratio. P12–14, n = 10; P15–17, n = 7; P18–20, n = 10; P21–26, n = 4; P27–35, n = 6; adult, n = 18. Data are means ± SEM (error bars). Kruskal–Wallis test with Dunn's multiple comparisons test (*P < 0.05; **P < 0.01; ****P < 0.0001; n.s. P > 0.05).
Figure 7.
Figure 7.
Exposure significantly improves the stimulus-following ability of RS neurons in the developing A1. (A and B) Effect of 5 min of exposure at 20 pps on temporal responses of a P15 neuron. (C and D) Raster plots of the representative neuron shown in (A) and (B); (E) Adaptation indicated by the normalized responses of young RS neurons before and after 20 pps exposure across different repetition rates, n = 14, 5 recorded by current-clamp recordings and 9 by loose-patch recordings. Green hollow triangles, individual neurons before exposure; black hollow circles, individual neurons after exposure; green solid triangles, mean value before exposure; black solid circles, mean value after exposure. Dashed lines, connecting the same neurons before and after exposure. Statistical analysis is means ± SD (error bars). Wilcoxon matched-pairs signed-rank test (**P < 0.01; n.s. P > 0.05).
Figure 8.
Figure 8.
Exposure weakens the summation of inhibition in the developing A1. (A) Synaptic temporal Inh and Exc of a P16 neuron evoked before and after 20 pps exposure. Insets, magnified view of synaptic conductance. (B) Left, paired comparison of inhibition τdecay before and after 20 pps exposure. Right, average inhibition and excitation τdecay before and after exposure, n = 10. Wilcoxon matched-pairs signed-rank test (**P < 0.01; n.s. P > 0.05). (C) Comparison of normalized integral area in young A1 before and after 20 pps exposure, n = 10. One-way ANOVA with Bonferroni post-hoc test (**P < 0.01; ***P < 0.001). (D) Effective time course of 5 min of exposure on the shortening of inhibition duration. Red dots, inhibition; green dots, excitation, n = 26. (E, F) Effect of exposure on peak conductance and the I:E ratio, n = 10. Wilcoxon matched-pairs signed-rank test (n.s. P > 0.05). (G) Example inhibitory synaptic responses of a P16 neuron, recorded 18 h after 30 min of exposure. Gray, superimposed traces; orange, average trace. (H) Effective time course of 30 min of exposure on the shortening of inhibition duration, n = 11. Left, τdecay at a series of time points after exposure; right, average τdecay of control and exposure groups; control, n = 15; exposure, n = 8. Mann–Whitney U-test (****P < 0.0001). (I) I:E ratio of control and exposure groups. Control, n = 15; exposure, n = 8. Mann–Whitney U-test (n.s. P > 0.05). Data are means ± SEM (error bars).
Figure 9.
Figure 9.
Exposure does not have significant effect on intrinsic properties. (A) Resting membrane potential and firing threshold before and after 20 pps exposure, n = 7. (B) Measurement of series and input resistances before and after 20 pps exposure. Example trace from a P15 neuron, clamped at 0 mV, in response to a noise pulse of 70 dB at 0 s and −10 mv voltage pulse injection at 3 s. Green, inhibitory response before exposure; black, inhibitory response after exposure; bottom trace, voltage injection. (C) Series (Rs) and input resistance (Rm) before and after 20 pps exposure. Data are means ± SEM (error bars). Statistical analysis in (B) is the paired t-test (n.s. P > 0.05), and in (C) is the Wilcoxon matched-pairs signed-rank test (n.s. P > 0.05).

Similar articles

Cited by

References

    1. Ahissar E, Nagarajan S, Ahissar M, Protopapas A, Mahncke H, Merzenich MM. 2001. Speech comprehension is correlated with temporal response patterns recorded from auditory cortex. Proc Natl Acad Sci USA. 98:13367–13372. - PMC - PubMed
    1. Atallah BV, Scanziani M. 2009. Instantaneous modulation of gamma oscillation frequency by balancing excitation with inhibition. Neuron. 62:566–577. - PMC - PubMed
    1. Bakin JS, Weinberger NM. 1996. Induction of a physiological memory in the cerebral cortex by stimulation of the nucleus basalis. Proc Natl Acad Sci USA. 93:11219–11224. - PMC - PubMed
    1. Bao S, Chang EF, Woods J, Merzenich MM. 2004. Temporal plasticity in the primary auditory cortex induced by operant perceptual learning. Nat Neurosci. 7:974–981. - PubMed
    1. Barbour DL, Callaway EM. 2008. Excitatory local connections of superficial neurons in rat auditory cortex. J Neurosci. 28:11174–11185. - PMC - PubMed

Publication types