Vocal Tract Images Reveal Neural Representations of Sensorimotor Transformation During Speech Imitation
- PMID: 28334401
- PMCID: PMC5939209
- DOI: 10.1093/cercor/bhx056
Vocal Tract Images Reveal Neural Representations of Sensorimotor Transformation During Speech Imitation
Abstract
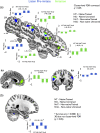
Imitating speech necessitates the transformation from sensory targets to vocal tract motor output, yet little is known about the representational basis of this process in the human brain. Here, we address this question by using real-time MR imaging (rtMRI) of the vocal tract and functional MRI (fMRI) of the brain in a speech imitation paradigm. Participants trained on imitating a native vowel and a similar nonnative vowel that required lip rounding. Later, participants imitated these vowels and an untrained vowel pair during separate fMRI and rtMRI runs. Univariate fMRI analyses revealed that regions including left inferior frontal gyrus were more active during sensorimotor transformation (ST) and production of nonnative vowels, compared with native vowels; further, ST for nonnative vowels activated somatomotor cortex bilaterally, compared with ST of native vowels. Using test representational similarity analysis (RSA) models constructed from participants' vocal tract images and from stimulus formant distances, we found that RSA searchlight analyses of fMRI data showed either type of model could be represented in somatomotor, temporal, cerebellar, and hippocampal neural activation patterns during ST. We thus provide the first evidence of widespread and robust cortical and subcortical neural representation of vocal tract and/or formant parameters, during prearticulatory ST.
Keywords: FMRI; learning.; rtMRI; sensorimotor transformation; speech.
© The Author 2017. Published by Oxford University Press.
Figures


Similar articles
-
Functional brain outcomes of L2 speech learning emerge during sensorimotor transformation.Neuroimage. 2017 Oct 1;159:18-31. doi: 10.1016/j.neuroimage.2017.06.053. Epub 2017 Jun 29. Neuroimage. 2017. PMID: 28669904
-
Human Sensorimotor Cortex Control of Directly Measured Vocal Tract Movements during Vowel Production.J Neurosci. 2018 Mar 21;38(12):2955-2966. doi: 10.1523/JNEUROSCI.2382-17.2018. Epub 2018 Feb 8. J Neurosci. 2018. PMID: 29439164 Free PMC article.
-
Sensory-motor networks involved in speech production and motor control: an fMRI study.Neuroimage. 2015 Apr 1;109:418-28. doi: 10.1016/j.neuroimage.2015.01.040. Epub 2015 Jan 24. Neuroimage. 2015. PMID: 25623499 Free PMC article.
-
Magnetic resonance imaging of the brain and vocal tract: Applications to the study of speech production and language learning.Neuropsychologia. 2017 Apr;98:201-211. doi: 10.1016/j.neuropsychologia.2016.06.003. Epub 2016 Jun 7. Neuropsychologia. 2017. PMID: 27288115 Review.
-
Encoding schemes in somatosensation: From micro- to meta-topography.Neuroimage. 2020 Dec;223:117255. doi: 10.1016/j.neuroimage.2020.117255. Epub 2020 Aug 13. Neuroimage. 2020. PMID: 32800990 Review.
Cited by
-
Altered Functional Connectivity and Brain Network Property in Pregnant Women With Cleft Fetuses.Front Psychol. 2019 Oct 9;10:2235. doi: 10.3389/fpsyg.2019.02235. eCollection 2019. Front Psychol. 2019. PMID: 31649585 Free PMC article.
-
Realistic Dynamic Numerical Phantom for MRI of the Upper Vocal Tract.J Imaging. 2020 Aug 27;6(9):86. doi: 10.3390/jimaging6090086. J Imaging. 2020. PMID: 34460743 Free PMC article.
-
Decoding kinematic information from beta-band motor rhythms of speech motor cortex: a methodological/analytic approach using concurrent speech movement tracking and magnetoencephalography.Front Hum Neurosci. 2024 Apr 5;18:1305058. doi: 10.3389/fnhum.2024.1305058. eCollection 2024. Front Hum Neurosci. 2024. PMID: 38646159 Free PMC article.
-
Neural representation of sensorimotor features in language-motor areas during auditory and visual perception.Commun Biol. 2025 Jan 11;8(1):41. doi: 10.1038/s42003-025-07466-5. Commun Biol. 2025. PMID: 39799186 Free PMC article.
-
Poor neuro-motor tuning of the human larynx: a comparison of sung and whistled pitch imitation.R Soc Open Sci. 2018 Apr 18;5(4):171544. doi: 10.1098/rsos.171544. eCollection 2018 Apr. R Soc Open Sci. 2018. PMID: 29765635 Free PMC article.
References
-
- Boersma P, Weenink D. 2016. Praat: doing phonetics by computer. Version 6.0.13.
-
- Bouchard KE, Conant DF, Anumanchipalli GK, Dichter B, Chaisanguanthum K, Johnson K, Chang EF. 2016. High-resolution, non-invasive imaging of upper vocal tract articulators compatible with human brain recordings. PLoS One. doi:0.1371/journal.pone.0151327. - PMC - PubMed
Publication types
MeSH terms
Substances
LinkOut - more resources
Full Text Sources
Other Literature Sources

