. 2017 Jul;69(7):1418-1428.
doi: 10.1002/art.40104. Epub 2017 Jun 2.

Regulated in Development and DNA Damage Response 1 Deficiency Impairs Autophagy and Mitochondrial Biogenesis in Articular Cartilage and Increases the Severity of Experimental Osteoarthritis

Affiliations

Regulated in Development and DNA Damage Response 1 Deficiency Impairs Autophagy and Mitochondrial Biogenesis in Articular Cartilage and Increases the Severity of Experimental Osteoarthritis

Oscar Alvarez-Garcia et al. Arthritis Rheumatol. 2017 Jul.

Abstract

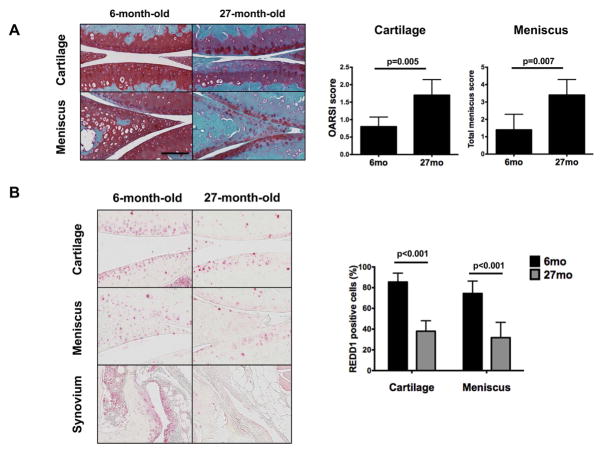
Objective: Regulated in development and DNA damage response 1 (REDD1) is an endogenous inhibitor of mechanistic target of rapamycin (mTOR) that regulates cellular stress responses. REDD1 expression is decreased in aged and osteoarthritic (OA) cartilage, and it regulates mTOR signaling and autophagy in articular chondrocytes in vitro. This study was undertaken to investigate the effects of REDD1 deletion in vivo using a mouse model of experimental OA.

Methods: OA severity was histologically assessed in 4-month-old wild-type and REDD1-/- mice subjected to surgical destabilization of the medial meniscus (DMM). Chondrocyte autophagy, apoptosis, mitochondrial content, and expression of mitochondrial biogenesis markers were determined in cartilage and cultured chondrocytes from wild-type and REDD1-/- mice.

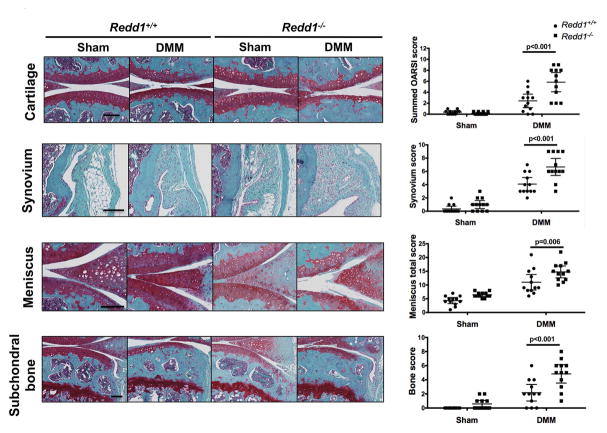
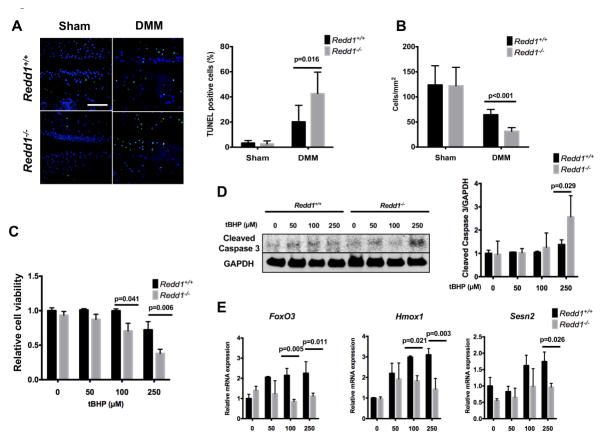
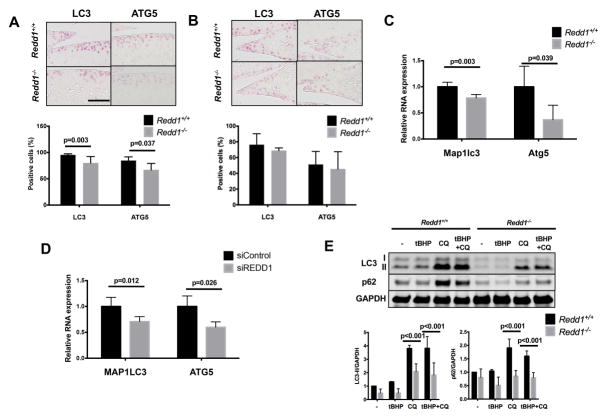
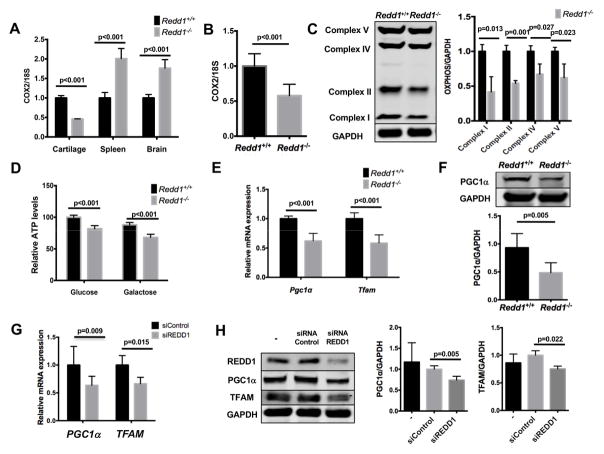
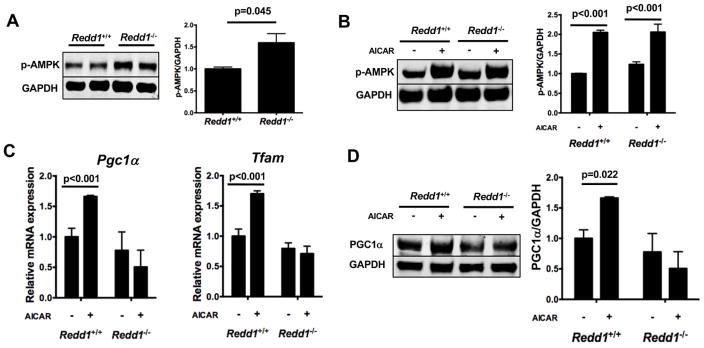
Results: REDD1 deficiency increased the severity of changes in cartilage, menisci, subchondral bone, and synovium in the DMM model of OA. Chondrocyte death was increased in the cartilage of REDD1-/- mice and in cultured REDD1-/- mouse chondrocytes under oxidative stress conditions. Expression of key autophagy markers (microtubule-associated protein 1A/1B light chain 3 and autophagy protein 5) was markedly reduced in cartilage from REDD1-/- mice and in cultured human and mouse chondrocytes with REDD1 depletion. Mitochondrial content, ATP levels, and expression of the mitochondrial biogenesis markers peroxisome proliferator-activated receptor γ coactivator 1α (PGC-1α) and transcription factor A, mitochondrial (TFAM) were also decreased in REDD1-deficient chondrocytes. REDD1 was required for AMP-activated protein kinase-induced PGC-1α in chondrocytes.

Conclusion: Our findings suggest that REDD1 is a key mediator of cartilage homeostasis through regulation of autophagy and mitochondrial biogenesis and that REDD1 deficiency exacerbates the severity of injury-induced OA.


Conflict of interest statement

The authors have no conflicts of interest.

Figures

Figure 1
Figure 1
Increased severity of experimental OA in Redd1−/− mice. A) Representative images of knees showing histological changes in the medial articular cartilage, synovium, meniscus and subchondral bone from 6.5-month-old Redd1+/+ and Redd1−/− mice (n=12 per genotype) subjected to DMM or sham procedure. Right panels show quantification of the histological scores for each joint tissue. All values are mean ± SD. Scale bar = 100 μm.
Figure 2
Figure 2
Reduced expression of REDD1 in join tissues during mouse aging. A) Representative histological images of knee medial articular cartilage and meniscus from 6 and 27-month-old mice (n=5 per group). Panel on the right shows quantification of the histological scores for cartilage and meniscus. B) Representative images of REDD1 immunohistochemical staining in knee joint tissues from 6 and 27-month-old mice (n=5 per group). Panel on the right shows quantification of REDD1 positive cells in cartilage and meniscus. All values are mean ± SD. Scale bar = 100 μm.
Figure 3
Figure 3
Increased chondrocyte death during experimental OA in Redd1−/− mice. A) Representative images of chondrocyte apoptosis in knee articular cartilage from 6.5-month-old Redd1+/+ and Redd1−/− mice (n=6 per genotype) subjected to DMM or sham procedure and assessed by TUNEL staining. Right panel shows quantification of TUNEL positive cells. Magnification bar = 100 μm. B) Quantification of articular cartilage cellularity in knees from 6.5-month-old Redd1+/+ and Redd1−/− mice (n=6 per genotype) subjected to DMM or sham procedure. C) Cell viability in cultured mouse articular chondrocytes treated with 0, 50, 100 or 250 mM tBHP for 24 hours. Data are expressed as relative cell viability with respect to untreated chondrocytes from Redd1+/+ mice. Four independent experiments were performed in triplicate. D) Western blot analysis of cleaved caspase 3 in cultured chondrocytes isolated from Redd1+/+ and Redd1−/− mice treated with different doses of tBHP to induce oxidative stress. Right panel shows quantification. Values are mean ± SD from three different experiments. E) qPCR analysis of FoxO3, Hmox1 and Sesn2 expression in cultured chondrocytes isolated from Redd1+/+ and Redd1−/− mice treated with different doses of tBHP. Values are mean ± SD from three different experiments performed in duplicate.
Figure 4
Figure 4
Reduced expression of autophagy markers in REDD1 deficient articular chondrocytes. A) Representative images of LC3 and ATG5 immunohistochemical staining in knee articular cartilage from 6-month-old Redd1+/+ and Redd1−/− mice (n=6 per genotype). Right panel shows quantification of positive cells. Values are mean ± SD. Magnification bar = 100 μm. B) Representative images of LC3 and ATG5 immunohistochemical staining in medial meniscus from 6-month-old Redd1+/+ and Redd1−/− mice (n=6 per genotype). Right panel shows quantification of positive cells. Values are mean ± SD. Magnification bar = 100 μm. C) qPCR analysis of Map1lc3 and Atg5 expression in cultured chondrocytes isolated from Redd1+/+ and Redd1−/− mice. Values are mean ± SD from three different experiments. D) qPCR analysis of LC3 and ATG5 expression in human cultured chondrocytes transfected with siRNA control or siRNA against REDD1. Values are mean ± SD from four different donors. E) Western blot analysis of p62 and LC3 in cultured chondrocytes isolated from Redd1+/+ and Redd1−/− mice and treated with tBHP or chloroquine. Bottom panel shows quantification. Values are mean ± SD from three different experiments.
Figure 5
Figure 5
Reduced mitochondrial biogenesis in REDD1 deficient articular chondrocytes. A) Mitochondrial DNA copy number in cartilage, spleen and brain from 6-month-old Redd1+/+ and Redd1−/− mice represented as the COX2/18S DNA ratio measured by qPCR. Values are mean ± SD from four different mice. B) Mitochondrial DNA copy number in cultured articular chondrocytes isolated from Redd1+/+ and Redd1−/− mice represented as the COX2/18S DNA ratio measured by qPCR. Values are mean ± SD from three different experiments. C) Western blot analysis of mitochondrial complex proteins expression in cultured chondrocytes isolated from Redd1+/+ and Redd1−/− mice. Right panel shows quantification. Values are mean ± SD from three different experiments. D) Intracellular ATP levels in cultured chondrocytes isolated from Redd1+/+ and Redd1−/− mice in the presence of 25mM glucose or galactose. Values are mean ± SD from four different experiments. E) qPCR analysis of Pgc1α and Tfam expression in cultured chondrocytes isolated from Redd1+/+ and Redd1−/− mice. Values are mean ± SD from three different experiments. F) Western blot analysis of PGC1α expression in cultured chondrocytes isolated from Redd1+/+ and Redd1−/− mice. Bottom panel shows quantification. Values are mean ± SD from three different experiments. G) qPCR analysis of PGC1α and TFAM expression in human cultured chondrocytes transfected with siRNA control or specific against REDD1. Values are mean ± SD from four different donors. H) Western blot analysis of PGC1α and TFAM expression in human cultured chondrocytes transfected with siRNA control or specific against REDD1. Values are mean ± SD from four different donors.
Figure 6
Figure 6
REDD1 is required for AMPK dependent PGC1α expression. A) Western blot analysis of AMPK phosphorylation in cultured chondrocytes isolated from Redd1+/+ and Redd1−/− mice. Right panel shows quantification. Values are mean ± SD from three different experiments. B) Western blot analysis of AMPK phosphorylation in cultured chondrocytes isolated from Redd1+/+ and Redd1−/− mice treated with AICAR or vehicle for 24 hours. Right panel shows quantification. Values are mean ± SD from three different experiments. C) qPCR analysis of Pgc1α and Tfam expression in cultured chondrocytes isolated from Redd1+/+ and Redd1−/− mice and treated with AICAR or vehicle for 24 hours. Values are mean ± SD from three different experiments. Right panel shows quantification. Values are mean ± SD from three different experiments. D) Western blot analysis of PGC1α expression in cultured chondrocytes isolated from Redd1+/+ and Redd1−/− mice and treated with AICAR or vehicle for 24 hours. Right panel shows quantification. Values are mean ± SD from three different experiments.

Similar articles

Cited by

References

    1. Hunter DJ, Schofield D, Callander E. The individual and socioeconomic impact of osteoarthritis. Nat Rev Rheumatol. 2014;10(7):437–41. - PubMed
    1. Loeser RF, Goldring SR, Scanzello CR, Goldring MB. Osteoarthritis: a disease of the joint as an organ. Arthritis Rheum. 2012;64(6):1697–707. - PMC - PubMed
    1. Lotz M, Loeser RF. Effects of aging on articular cartilage homeostasis. Bone. 2012;51(2):241–8. - PMC - PubMed
    1. Choi AM, Ryter SW, Levine B. Autophagy in human health and disease. N Engl J Med. 2013;368(19):1845–6. - PubMed
    1. Carames B, Taniguchi N, Otsuki S, Blanco FJ, Lotz M. Autophagy is a protective mechanism in normal cartilage, and its aging-related loss is linked with cell death and osteoarthritis. Arthritis Rheum. 2010;62(3):791–801. - PMC - PubMed

MeSH terms

Substances