. 2017 Mar 22;93(6):1334-1343.e5.
doi: 10.1016/j.neuron.2017.02.022.

The SARM1 Toll/Interleukin-1 Receptor Domain Possesses Intrinsic NAD+ Cleavage Activity that Promotes Pathological Axonal Degeneration

Affiliations

The SARM1 Toll/Interleukin-1 Receptor Domain Possesses Intrinsic NAD+ Cleavage Activity that Promotes Pathological Axonal Degeneration

Kow Essuman et al. Neuron. .

Abstract

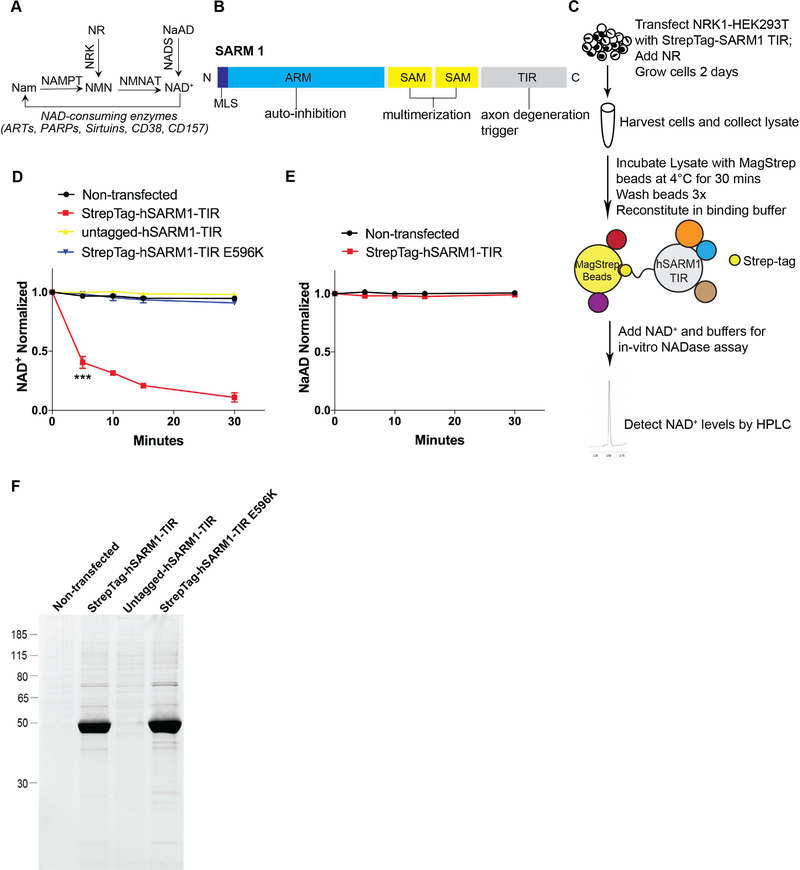
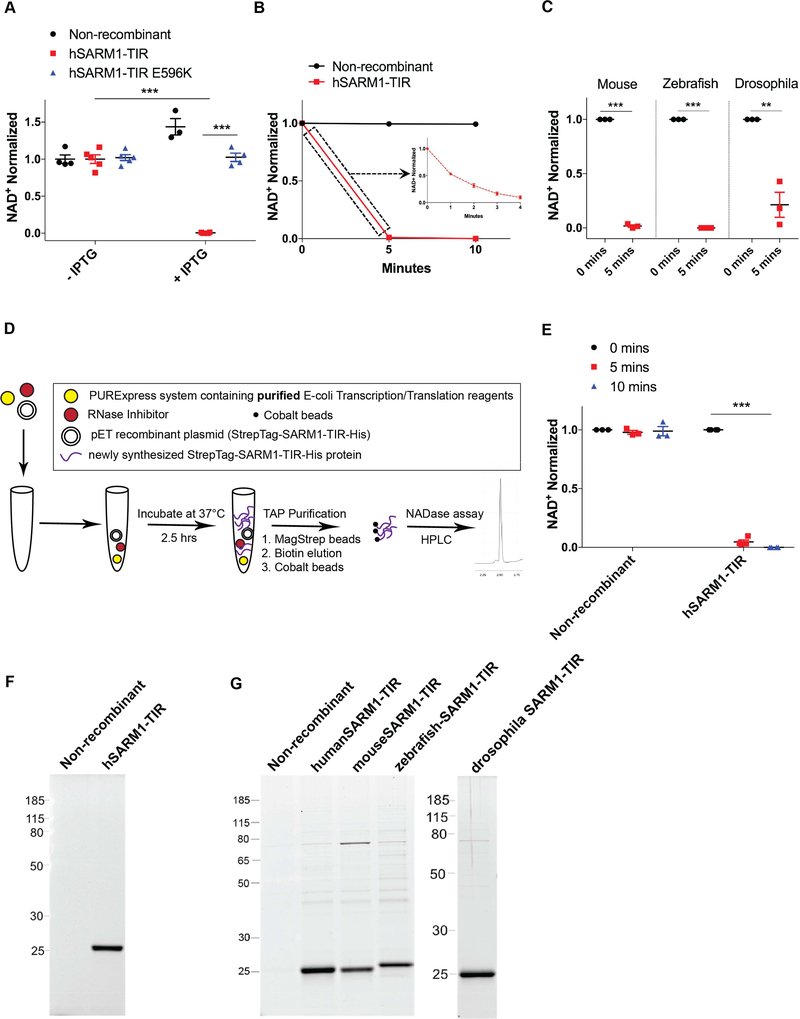
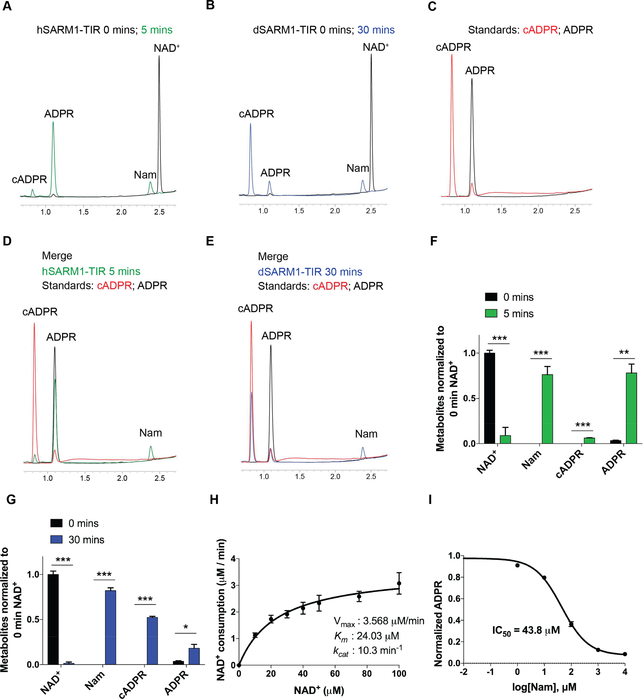
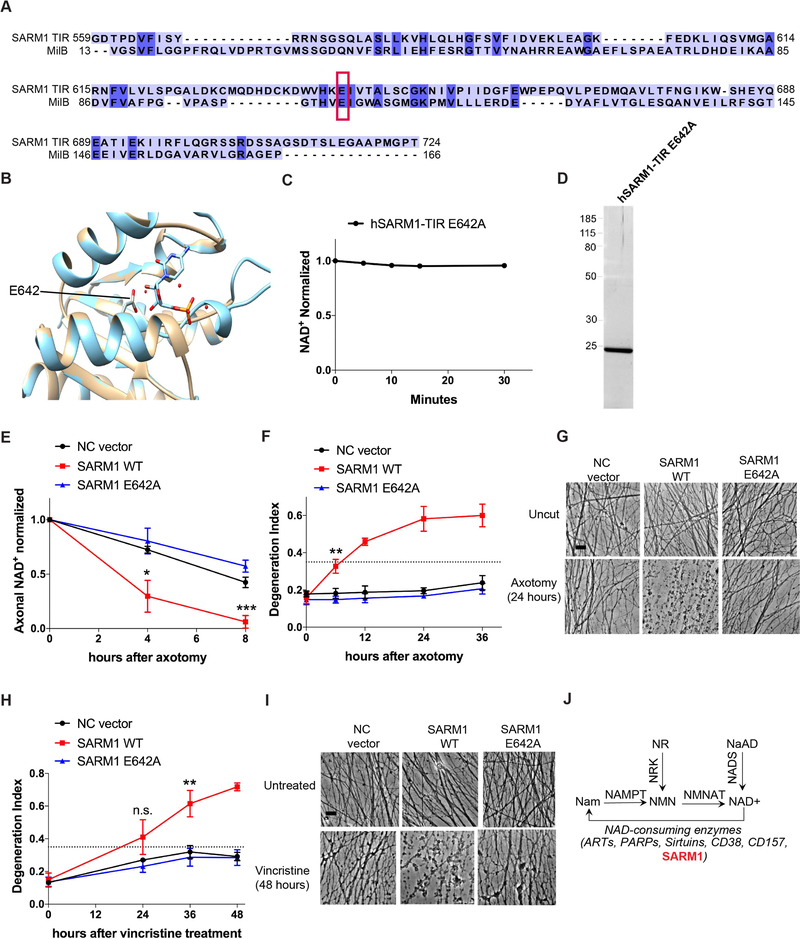
Axonal degeneration is an early and prominent feature of many neurological disorders. SARM1 is the central executioner of the axonal degeneration pathway that culminates in depletion of axonal NAD+, yet the identity of the underlying NAD+-depleting enzyme(s) is unknown. Here, in a series of experiments using purified proteins from mammalian cells, bacteria, and a cell-free protein translation system, we show that the SARM1-TIR domain itself has intrinsic NADase activity-cleaving NAD+ into ADP-ribose (ADPR), cyclic ADPR, and nicotinamide, with nicotinamide serving as a feedback inhibitor of the enzyme. Using traumatic and vincristine-induced injury models in neurons, we demonstrate that the NADase activity of full-length SARM1 is required in axons to promote axonal NAD+ depletion and axonal degeneration after injury. Hence, the SARM1 enzyme represents a novel therapeutic target for axonopathies. Moreover, the widely utilized TIR domain is a protein motif that can possess enzymatic activity.

Keywords: NAD(+); NADase; SARM1; TIR; Toll/interleukin-1 receptor domain; axonal degeneration; enzyme; innate immunity.


Figures

Figure 1:
Figure 1:. Native SARM1-TIR protein complex cleaves NAD+ in an in vitro assay.
A) Selected pathways of NAD+ synthesis and degradation. Nam–Nicotinamide; NMN–Nicotinamide Mononucleotide; NAD+–Nicotinamide Adenine Dinucleotide; NR–Nicotinamide Riboside; NaAD–Nicotinic Acid Adenine Dinucleotide; NAMPT–Nicotinamide Phosphoribosyltransferase; NRK–Nicotinamide Riboside Kinase; NMNAT–Nicotinamide Mononucleotide Adenylyltransferase; NADS– NAD+ synthetase; ART–ADP Ribosyltransferase; PARP–Poly ADP-Ribose Polymerase. B) SARM1 domains. MLS–Mitochondrial Localization Signal; ARM–Armadillo/HEAT Motifs; SAM–Sterile Alpha Motif; TIR–Toll/Interleukin 1 Receptor. C) Schematic illustrating the in vitro NADase assay.D) NAD+ cleavage reaction timecourse of human SARM1-TIR (wild type and mutant) laden beads in NADase assay (normalized to control at 0 min). E) NaAD reaction timecourse of human SARM1-TIR laden beads in NADase assay (normalized to control at 0 min). F) SYPRO Ruby gel of SARM1-TIR laden beads used in assay. Data for each time point was generated from three independent experiments using purified protein from three independent transfection experiments. Data are presented as mean ± SEM; Error bars: SEM; ***P<0.001 one-way ANOVA. See also Figure S1.
Figure 2:
Figure 2:. NAD+ cleavage enzymatic activity is intrinsic to SARM1-TIR
A) Endogenous NAD+ levels in bacteria after IPTG induction of human SARM1-TIR. B) In vitro NAD+ cleavage reaction by human SARM1-TIR protein expressed and purified from bacteria. C) Bacterially expressed mouse, zebrafish, and drosophila SARM1-TIR proteins cleave NAD+ in NADase assay. D) Schematic of cell-free protein expression system. E) Human SARM1-TIR purified from cell-free protein expression system cleaves NAD+ in NADase assay. F) SYPRO Ruby gel of SARM1-TIR laden beads purified from cell-free transcription/translation system. G) SYPRO Ruby gel of SARM1-TIR laden beads purified from bacteria. These cell-free and bacterially expressed proteins lack the Venus fluorescent tag and thus run at a different size than the proteins expressed in NRK1-HEK293T cells (compare to Figure 1). Data was generated from at least three independent reaction experiments using purified protein from at least three independent bacteria clones. Data are presented as mean ± SEM; Error bars: SEM; **P<0.01, ***P<0.001 unpaired two tailed Student’s t-test and one-way ANOVA for multiple comparisons. See also Figure S2.
Figure 3:
Figure 3:. Characterization of the SARM1-TIR NAD+ cleavage reaction.
(A-E) HPLC chromatograms showing NAD+ cleavage products of human and drosophila SARM1-TIR. Retention time: Nam t~2.40 min; cADPR at t~0.85 min; ADPR at t~1.10 min. (F-G) Quantification of metabolites generated by human (F) and drosophila (G) SARM1-TIR as displayed in A-E (normalized to 0 min NAD+). H) Kinetic parameters for human SARM1-TIR cleavage reaction. Vmax, Km, kcat were determined by fitting the data to the Michaelis-Menten equation and are presented as mean ± SEM for three independent biological samples. I) Nam dose response inhibition of human SARM1-TIR enzymatic activity. Data was generated from three independent reaction experiments using purified protein from three independent bacteria clones. Data are presented as mean ± SEM; Error bars: SEM; *P<0.05; **P<0.01; ***P<0.001 unpaired two tailed Student’s t-test. See also Figure S3.
Figure 4:
Figure 4:. SARM1 enzymatic activity functions in axons to promote pathological axonal degeneration.
A) Amino acid sequence alignment of SARM1-TIR with MilB Cytidine 5’ Monophosphate (CMP) Hydrolase. CMP catalytic glutamic acid is highlighted in red box and aligns to glutamic acid 642 in the SARM1-TIR domain. B) Modeling of the SARM1-TIR domain on the crystal structure of CMP Hydrolase bound to CMP. E642 aligns with a catalytic residue of CMP Hydrolase. C) NAD+ reaction timecourse of human SARM1-TIR E642A purified from cell-free protein translation system (normalized to control at 0 min). D) SYPRO Ruby gel of SARM1-TIR E642A purified from cell-free protein translation system. E) Axonal NAD+ levels after axotomy (normalized to control at 0 hr). NC vector, SARM1 WT, and SARM1 E642A constructs were expressed in SARM1−/− DRG neurons, and levels of NAD+ were obtained at indicated timepoints after axotomy. F) Axonal degeneration timecourse after axotomy, quantified as degeneration index (DI) where a DI of 0.35 (indicated by dotted line) or above represents degenerated axons. G) Bright-field micrographs of axons expressing indicated constructs represented in F. H) Axonal degeneration timecourse after vincristine treatment, quantified as DI. I) Bright-field micrographs of axons after vincristine treatment corresponding to selected groups in H. Scale bar, 5μm. Quantification data were generated from at least three independent biological experiments. Data are presented as mean ± SEM; Error bars: SEM.*P<0.05, **P<0.01, ***P<0.001 one-way ANOVA. J) Selected pathways of NAD+ synthesis and degradation including SARM1 as a NAD+ consuming enzyme. See also Figure S4.

References

    1. Araki T, Sasaki Y, and Milbrandt J (2004). Increased nuclear NAD biosynthesis and SIRT1 activation prevent axonal degeneration. Science 305, 1010–1013. - PubMed
    1. Armstrong SR, Cook WJ, Short SA, and Ealick SE (1996). Crystal structures of nucleoside 2-deoxyribosyltransferase in native and ligand-bound forms reveal architecture of the active site. Structure 4, 97–107. - PubMed
    1. Arnold K, Bordoli L, Kopp J, and Schwede T (2006). The SWISS-MODEL workspace: a web-based environment for protein structure homology modelling. Bioinformatics 22, 195–201. - PubMed
    1. Avalos JL, Bever KM, and Wolberger C (2005). Mechanism of sirtuin inhibition by nicotinamide: altering the NAD(+) cosubstrate specificity of a Sir2 enzyme. Mol. Cell 17, 855–868. - PubMed
    1. Berthelier V, Tixier JM, Muller-Steffner H, Schuber F, and Deterre P (1998). Human CD38 is an authentic NAD(P)+ glycohydrolase. Biochem. J 330 ( Pt 3), 1383–1390. - PMC - PubMed