. 2017 Mar 22;93(6):1451-1463.e4.
doi: 10.1016/j.neuron.2017.02.033.

Parvalbumin Interneurons Modulate Striatal Output and Enhance Performance during Associative Learning

Affiliations

Parvalbumin Interneurons Modulate Striatal Output and Enhance Performance during Associative Learning

Kwang Lee et al. Neuron. .

Erratum in

Abstract

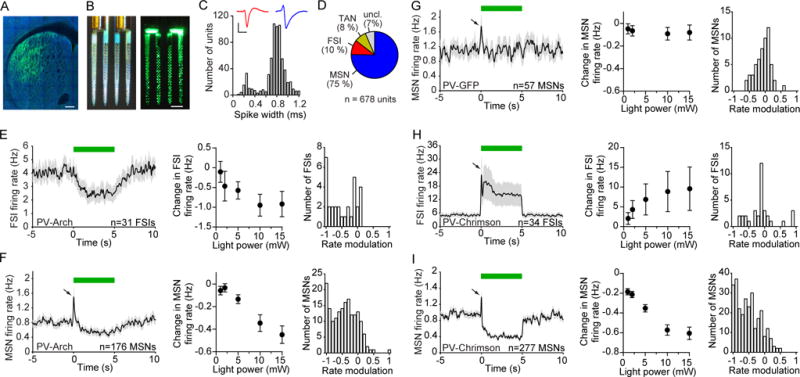
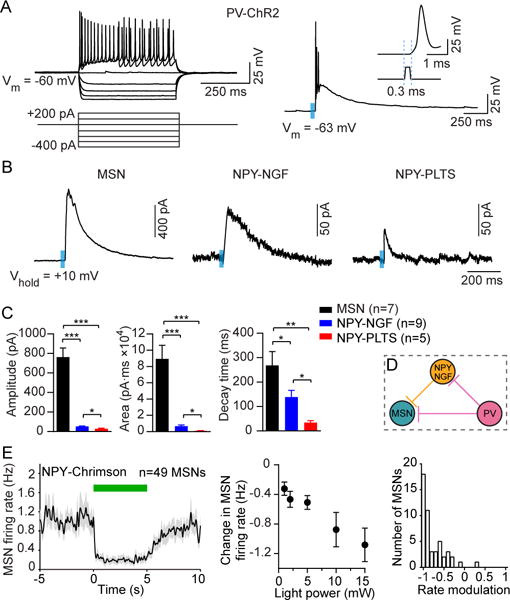
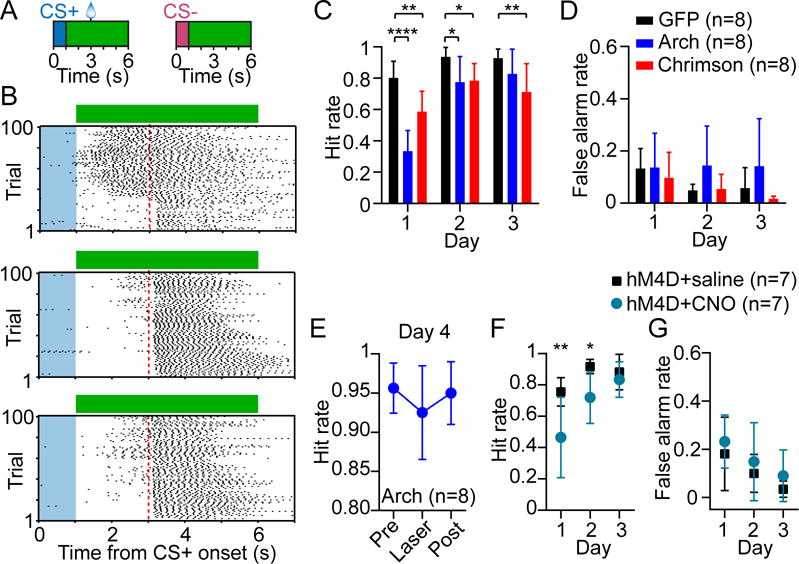
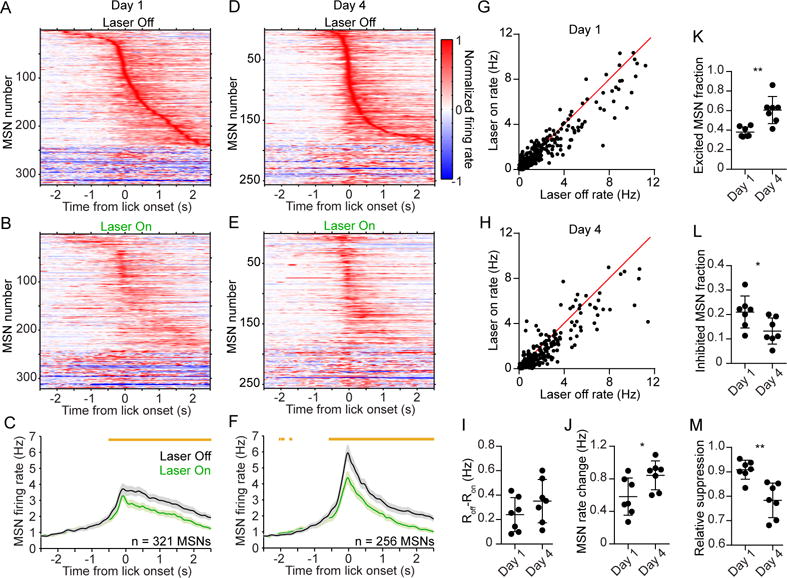
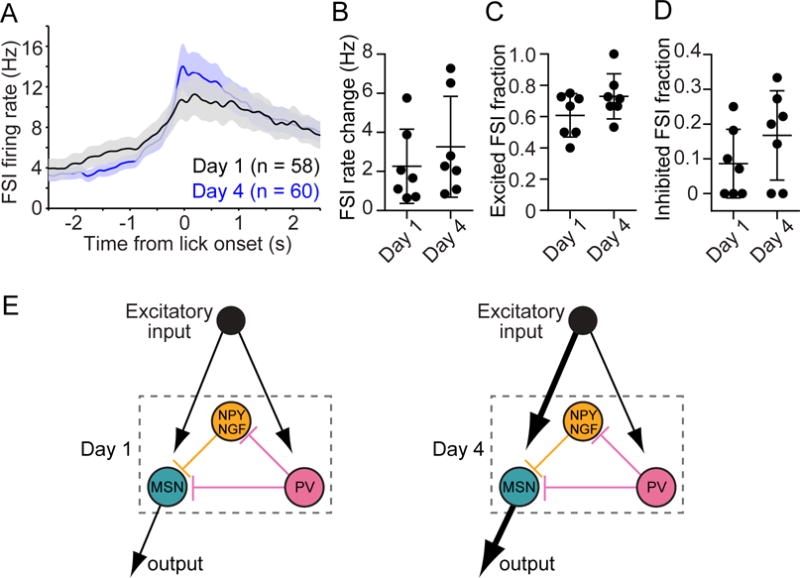
The prevailing view is that striatal parvalbumin (PV)-positive interneurons primarily function to downregulate medium spiny projection neuron (MSN) activity via monosynaptic inhibitory signaling. Here, by combining in vivo neural recordings and optogenetics, we unexpectedly find that both suppressing and over-activating PV cells attenuates spontaneous MSN activity. To account for this, we find that, in addition to monosynaptic coupling, PV-MSN interactions are mediated by a competing disynaptic inhibitory circuit involving a variety of neuropeptide Y-expressing interneurons. Next we use optogenetic and chemogenetic approaches to show that dorsolateral striatal PV interneurons influence the initial expression of reward-conditioned responses but that their contribution to performance declines with experience. Consistent with this, we observe with large-scale recordings in behaving animals that the relative contribution of PV cells on MSN activity diminishes with training. Together, this work provides a possible mechanism by which PV interneurons modulate striatal output and selectively enhance performance early in learning.

Keywords: disynaptic inhibition; learning; neural recording; optogenetics; parvalbumin interneurons; reward conditioning; striatum.


Figures

Figure 1
Figure 1. Striatal PV Interneurons Unidirectionally Control Spontaneous MSN activity
(A) Selective expression of Arch-GFP in PV cells in the dorsolateral striatum of PV-Cre mice. GFP (green) and NeuN (blue). Scale bar, 200 μm. (B) Opto-microprobe device containing a 256 electrode silicon probe combined with 2 optical fibers. Left: view under ambient light. Right: view under laser illumination from the fibers. Scale bar, 200 μm. (C) Distribution of trough-to-peak spike waveform duration of 678 striatal units recorded across 15 animals used in Figure 1. Narrow spiking units (less than 0.475 ms trough-to-peak duration) were mainly classified as putative FSIs, and wide spikes (greater than 0.55 ms trough-to-peak duration) were mainly classified as putative MSNs. Inset shows mean spike waveform of a representative FSI (red) and MSN (blue). Scale bars, 0.5 ms horizontal, 50 μV vertical. (D) Percentage of putatively identified or unclassified striatal units. (E) Response of 31 FSIs recorded in vivo to optical stimulation in Arch-expressing PV-Cre mice (PV-Arch). Left: The mean spontaneous firing rate was transiently reduced during 5 s continuous light delivery (green bar). Middle: The change in firing rate varied with optical fiber output power (one-way ANOVA, F4,120 = 4.3, p = 0.003). Right: Rate modulation index (RMI) distribution at 10 mW power. The median RMI was significantly different from zero (signed-rank test, p < 0.0001). (F) Response of 176 MSNs to optical stimulation in PV-Arch mice. Left: After a brief excitatory response (black arrow) which was subsequently found to be an artifact, the mean activity decreased. Middle: The change in firing rate varied with optical fiber output power (one-way ANOVA, F4,700 = 14, p < 0.0001). Right: RMI distribution at 10 mW. The median RMI was significantly different from zero (signed-rank test, p < 0.0001). (G) Response of 57 MSNs to optical stimulation in PV-GFP mice, which were not injected with optogenetic constructs. Left: There was no sustained change in firing relative to baseline. Middle: The change in firing rate did not significantly depend on optical fiber output power (one-way ANOVA, F4,224 = 0.1, p = 0.99). Right: RMI distribution at 10 mW. The median RMI was not significantly different from zero (signed-rank test, p = 0.77). (H) Response of 34 FSIs to optical stimulation in PV-Chrimson mice. Left: There was an increase in mean firing relative to baseline. Middle: The change in firing rate varied with optical fiber output power (one-way ANOVA, F4,132 = 2.6, p = 0.04). Right: RMI distribution at 10 mW. The median RMI was not significantly different from zero (signed-rank test, p = 0.77). (I) Response of 277 MSNs to optical stimulation in PV-Chrimson mice. Left: There was a decrease in mean firing relative to baseline. Middle: The change in firing rate varied with optical fiber output power (one-way ANOVA, F4,1104 = 33, p < 0.0001). Right: RMI distribution at 10 mW. The median RMI was significantly different from zero (signed-rank test, p < 0.0001). See also Figures S1, S2. Data represent mean ± SEM.
Figure 2
Figure 2. Characterization of a Disynaptic (PV-NPY-MSN) Inhibitory Microcircuit
(A) Striatal PV interneurons are fast-spiking interneurons (FSIs) that are characterized by a high firing frequency in response to depolarizing current injection (left). PV interneurons expressing ChR2 produced action potentials in response to blue light (right, 0.5 ms duration, 470 nm, 3 mW) with a latency of 0.3 ms (right, inset). (B) Sample traces (average of 3 sweeps) of IPSC responses in MSNs, NPY-NGF, and NPY-PLTS cells after optical activation of PV interneurons. (C) Mean evoked IPSC properties in MSNs and NPY interneurons after optical activation of PV interneurons. While the largest IPSC response magnitude was found to be in MSNs (n = 7), NPY-NGF cells (n = 9) produced IPSC responses with higher amplitudes (unpaired t-test, p = 0.02), larger areas (p = 0.015) and longer decay times (p = 0.018) compared to light-responsive NPY-PLTS cells (n = 5). (D) Schematic model of microcircuitry of striatal PV interneurons coupled to MSNs both monosynaptically and disynaptically via NPY-NGF interneurons. (E) Response of 49 MSNs recorded in vivo to optical stimulation in NPY-Chrimson mice. Left: The mean activity decreased during 5 s continuous light delivery (green bar). Middle: The change in firing rate varied with optical fiber output power (one-way ANOVA, F4,192 = 7.7, p < 0.0001). Right: RMI distribution at 10 mW. The median RMI was significantly different from zero (signed-rank test, p < 0.0001). Data in (C) and (E) represent mean ± SEM.*p < 0.05;**p < 0.01; ****p < 0.0001.
Figure 3
Figure 3. Striatal PV Interneurons Control Behavior during Early Reward Conditioning
(A) Stimulus-reward conditioning and optogenetic stimulation paradigm. Green bars denote the duration of bilateral optical stimulation. (B) CS+ trial lick raster from day 1 of training of a PV-GFP (top), PV-Arch (middle), and PV-Chrimson (bottom) mouse receiving optical stimulation. Blue shaded area represents cue duration, green bar represents laser duration, dashed red line represents reward delivery time. (C) Optogenetically suppressing or over-activating PV interneurons (n = 8 mice per group) selectively disrupted reward-anticipatory behavior (hit rate, two-way ANOVA, group effect: F2,21 = 15, p < 0.0001; time effect: F2,42 = 43.7, p < 0.0001). Post hoc Bonferroni’s test revealed that hit rate was selectively reduced by PV suppression on day 1 and 2 of training relative to GFP controls, but was reduced across all days by PV over-activation. (D) False alarm rate was not significantly affected by optogenetic manipulation (two-way ANOVA, group effect: F2,21 = 1.7, p = 0.22; time effect: F2,42 = 6.6, p = 0.003). (E) In this cohort, PV-Arch animals (n = 8) were trained without laser for 3 days and tested with laser in the middle of day 4. The hit rate was not significantly affected (one-way ANOVA, F2,14 = 2.5, p = 0.12). Absolute maximum difference of the 95% confidence intervals = 0.07. (F) Chemogenetically inhibiting PV interneurons using hM4D and CNO (n = 7 mice per group) selectively disrupted hit rate in the early stage of training (two-way ANOVA, group effect: F1,12 = 8.2, p = 0.014; time effect: F2,24 = 20.8, p < 0.0001). Post hoc Bonferroni’s test revealed that hit rate was selectively reduced on day 1 and 2. (G) False alarm rate was not significantly affected by chemogenetic inhibition (two-way ANOVA, group effect: F1,12 = 1.4, p = 0.25; time effect: F2,24 = 7, p = 0.004). Data in (C–G) are represented as mean ± SD. See also Figure S3. *p < 0.05; **p < 0.01; ****p < 0.0001.
Figure 4
Figure 4. Experience Diminishes the Relative Influence of PV Interneurons on Preparatory MSN Activity
(A) Mean baseline-subtracted and normalized firing rate as a function of time of 321 MSNs recorded on day 1 of training, aligned to the first lick during hit trials without laser. Units are ordered by their latency to peak firing. (B) Same as (A) but showing hit trials with laser. Note that the rate is normalized to the maximum firing during trials without laser. The order of units is the same as that of (A). (C) Comparison of the mean firing rate of the population in (A–B) during laser off (black) and laser on (green) conditions. Orange bars above the plots denote time bins with significantly different off-on firing rate (paired t-test, p < 0.01). (D) Mean baseline-subtracted and normalized firing rate as a function of time of 256 MSNs recorded on day 4 of training, aligned to the first lick during hit trials without laser. Units are ordered by their latency to peak firing. (E) Same as (D) but showing trials with laser. Note that the rate is normalized to the maximum firing during trials without laser. The order of units is the same as that of (D). (F) Comparison of the mean firing rate of the population in (D–E) during laser off and laser on conditions. Data in (C and F) represent mean ± SEM. (G) Comparison of median firing rate during a 1 s licking-preparatory period, between laser off and laser on conditions. The firing rate of the MSN population was significantly attenuated by optogenetic suppression of PV interneurons (Wilcoxon matched pairs signed-rank test, p < 0.0001). Each data point represents one MSN recorded on day 1 of training. (H) Same as (G) but for day 4 of training. The firing rate of the MSN population was significantly attenuated by optogenetic suppression of PV interneurons (Wilcoxon matched pairs signed-rank test, p < 0.0001). (I) The median level of MSN firing rate suppression per animal (Roff–Ron) did not significantly change from day 1 to day 4 (Mann-Whitney test, p = 0.26). (J) The median level of preparatory MSN activity per animal increased from day 1 to day 4 (Mann-Whitney test, p = 0.026). The firing rate change is with respect to baseline activity. (K) The fraction of MSNs per animal that were significantly excited during the preparatory period increased from day 1 to day 4 (Mann-Whitney test, p = 0.002). (L) The fraction of MSNs per animal that were significantly inhibited during the preparatory period decreased from day 1 to day 4 (Mann-Whitney test, p = 0.019). (M) The relative suppression factor per animal, which quantifies the change in MSN activity due to PV interneuron suppression relative to the total MSN preparatory activity, decreased from day 1 to day 4 (Mann-Whitney test, p = 0.002). Data in (J–L) are derived from non-laser trials, and each data point represents one animal (n = 7 mice per group). See also Figures S4, S5. *p < 0.05; **p < 0.01.
Figure 5
Figure 5. Experience does not Alter Preparatory FSI Activity
(A) Comparison of the mean firing rate as a function of time of the FSI population on day 1 and day 4 of training. Data are aligned to the first lick during hit trials without laser. (B) The median level of preparatory FSI activity per animal did not significantly change from day 1 to day 4 (Mann-Whitney test, p = 0.38). The firing rate change is with respect to baseline activity. (C) The fraction of FSIs per animal that were significantly excited during the preparatory period did not significantly change from day 1 to day 4 (Mann-Whitney test, p = 0.25). (D) The fraction of FSIs per animal that were significantly inhibited during the preparatory period did not significantly change from day 1 to day 4 (Mann-Whitney test, p = 0.25). Data in (A–D) are derived from non-laser trials, and each data point in (B–D) represents one animal (n = 7 mice per group). (E) Illustrative model of how the contribution of PV interneurons on MSN activity diminishes relative to other influences (here depicted as external excitatory input) in an experience-dependent manner. Left and right panels represent day 1 and day 4, respectively. Arrow thickness represents the relative strength of the designated pathway.

Similar articles

Cited by

References

    1. Armbruster BN, Li X, Pausch MH, Herlitze S, Roth BL. Evolving the lock to fit the key to create a family of G protein-coupled receptors potently activated by an inert ligand. Proc Natl Acad Sci U S A. 2007;104:5163–5168. - PMC - PubMed
    1. Bakhurin KI, Mac V, Golshani P, Masmanidis SC. Temporal correlations among functionally specialized striatal neural ensembles in reward-conditioned mice. J Neurophysiol. 2016;115:1521–1532. - PMC - PubMed
    1. Balleine BW, Delgado MR, Hikosaka O. The role of the dorsal striatum in reward and decision-making. J Neurosci. 2007;27:8161–8165. - PMC - PubMed
    1. Barbera G, Liang B, Zhang L, Gerfen CR, Culurciello E, Chen R, Li Y, Lin DT. Spatially Compact Neural Clusters in the Dorsal Striatum Encode Locomotion Relevant Information. Neuron 2016 - PMC - PubMed
    1. Barnes TD, Kubota Y, Hu D, Jin DZ, Graybiel AM. Activity of striatal neurons reflects dynamic encoding and recoding of procedural memories. Nature. 2005;437:1158–1161. - PubMed