. 2017 Mar 22;93(6):1464-1479.e5.
doi: 10.1016/j.neuron.2017.02.034.

Basolateral to Central Amygdala Neural Circuits for Appetitive Behaviors

Affiliations

Basolateral to Central Amygdala Neural Circuits for Appetitive Behaviors

Joshua Kim et al. Neuron. .

Abstract

Basolateral amygdala (BLA) principal cells are capable of driving and antagonizing behaviors of opposing valence. BLA neurons project to the central amygdala (CeA), which also participates in negative and positive behaviors. However, the CeA has primarily been studied as the site for negative behaviors, and the causal role for CeA circuits underlying appetitive behaviors is poorly understood. Here, we identify several genetically distinct populations of CeA neurons that mediate appetitive behaviors and dissect the BLA-to-CeA circuit for appetitive behaviors. Protein phosphatase 1 regulatory subunit 1B+ BLA pyramidal neurons to dopamine receptor 1+ CeA neurons define a pathway for promoting appetitive behaviors, while R-spondin 2+ BLA pyramidal neurons to dopamine receptor 2+ CeA neurons define a pathway for suppressing appetitive behaviors. These data reveal genetically defined neural circuits in the amygdala that promote and suppress appetitive behaviors analogous to the direct and indirect pathways of the basal ganglia. VIDEO ABSTRACT.

Keywords: amygdala circuit; appetitive; basolateral amygdala; central amygdala; direct and indirect pathways; drinking; fear; feeding; freezing; reward.


Figures

Figure 1
Figure 1. Identification of genetically distinct populations in the CeA
(A–C) Quantification of overlap of Prkcd and Calcrl in the CeC (A). Quantification of overlap of Prkcd, Sst, Crh, Tac2, and Nts in the CeL (B). Quantification of overlap of Sst, Nts, Tac2, and Crh in the CeM (C). Values represent percent labelling of overlap of genes in column amongst genes in rows. For example, 56% of CeC Calcrl neurons coexpress Prkcd (A). Values represent percentage of labeling from totaling all cells counted from n = 3 mice. Hierarchical clustering was performed in the CeL using the percent overlap profile of each gene (B). (D–O) Representative histology of CeA expression of Prkcd and Calcrl (D), Prkcd and Sst (E), Prkcd and Nts (F), Prkcd and Tac2 (G), Prkcd and Crh (H), Sst and Calcrl (I), Nts and Sst (J), Nts and Tac2 (K), Nts and Crh (L), Sst and Tac2 (M), Sst and Crh (N), Tac2 and Crh (O) in the anterior CeA (anterior-posterior (AP) distance from Bregma −0.8 mm) and posterior CeA (AP distance from Bregma −1.6 mm). Scale bar, 250 μm. (P) 7 major population of neurons that were selected for examination and color selection for subsequent data presentation, CeC Prkcd+ neurons (green), CeL Prkcd+ (light blue), CeL Sst+ (dark blue), CeL Crh+Nts+Tac2+ (teal), CeM Sst+ (light purple), CeM Nts+ (dark purple), and CeM Tac2+ (magenta) neurons.
Figure 2
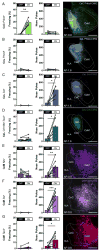
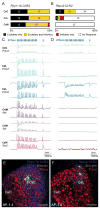
Figure 2. Genetically distinct CeA neurons drive appetitive and defensive behaviors
(A–G) Behavioral assessment of percent freezing without (OFF) or with (ON) photostimulation (first column) and total number of nose pokes in unstimulated (OFF) or photostimulated (ON) port in self-stimulation experiments (second column) from optogenetic activation of CeC Prkcd+ (n = 5) (A), CeL Prkcd+ (n = 4) (B), CeL Sst+ (n = 6) (C), CeL Crh+Nts+Tac2+ (n = 6) (D), CeM Nts+ (n = 7) (E), CeM Sst+ (n = 7) (F), and CeM Tac2+ (n = 8) (G) neurons. Representative histology of ChR2 expression in the targeted CeA neurons (third column). Anterior-posterior distribution of ChR2 expression found in Figure S2A. All animals underwent the optogenetic freezing test, followed by the optogenetic self-stimulation test. ChR2 expression was pseudocolored in correspondence with selected color scheme (Figure 1P). Significance for paired t-test, *P< 0.05, **P<0.01, ***P<0.001 (A–G). Anterior-posterior (AP) distance from Bregma (mm), scale bar, 250 μm.
Figure 3
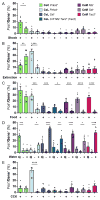
Figure 3. Genetically distinct CeA neurons are activated by distinct stimuli
(A–E) The percent overlap of Fos within CeC Prkcd+, CeL Prkcd+, CeL Sst+, CeL Crh+Nts+Tac2+, CeM Nts+, CeM Sst+, and CeM Tac2+ neurons in response to Shock (+) or No Shock (−) (A); Contextual Extinction Recall (+) or Contextual Fear Recall (−) (B); ad libitum Food (+) or No Food (−) in food-deprived mice (C); Quinine Water (Q), No Water (−) or ad libitum Water (+) in water-deprived mice (D); Cholecystokinin (CCK) (+) or Saline (−) injection (E). CeL Crh+Nts+Tac2+ neurons were measured by quantifying Fos in Tac2+ neurons in the CeL. Significance for unpaired t-test (A,B,C, E) and one-way ANOVA with Bonferroni’s multiple hypothesis correction comparing experimental groups with no water control (D), *P< 0.05, **P< 0.01, ***P<0.001, ****P<0.0001 (A–G). Values are mean ± s.e.m. from 1–2 sections per mouse from up to n = 4 mice, individual values are shown by black dots, some values that are too large and beyond the limit of the y-axis are not shown.
Figure 4
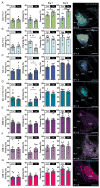
Figure 4. Inhibition of genetically defined CeA neurons during feeding, drinking, and defensive behaviors
(A–G) Behavioral assessment of percent feeding during food presentation in food-deprived mice (first column); percent drinking during water presentation in water-deprived mice (second column); percent freezing during presentation of footshocks on Day 1 (third column) and contextual recall without optogenetic inhibition on Day 2 (fourth column) from optogenetic inhibition of CeC Prkcd+ (n = 8, 8) (A), CeL Prkcd+ (n = 10, 8) (B), CeL Sst+ (n = 8, 8) (C), CeL Crh+Nts+Tac2+ (n = 8, 8) (D), CeM Nts+ (n = 9, 8) (E), CeM Sst+ (n = 8, 8) (F), and CeM Tac2+ (n = 9, 8) (G) neurons. All animals underwent the feeding test, followed by the drinking test, followed by contextual fear conditioning. Representative histology of eArch 3.0 expression and optic fiber placement in the targeted CeA neurons (fifth column). eArch 3.0 expression was pseudocolored in correspondence with selected color scheme (Figure 1P). Significance for unpaired t-test, *P< 0.05, **P<0.01, ***P<0.001, sample size (n = experimental,control) (A–G). Anterior-posterior (AP) distance from Bregma (mm), scale bar, 250 μm.
Figure 5
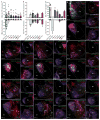
Figure 5. Monosynaptic retrograde tracing from genetically defined CeA neurons
(A) Quantification of rabies-mediated retrograde labeled PPP1R1B+ and PPP1R1B neurons in the BLA from genetically defined CeA neurons. Individual points represent the number of retrograde labeled neurons per section in the BLA from n = 8 sections per mouse from n = 3 mice, bars represent mean ± s.e.m.. Arbitrary threshold of 2.5 neurons per section was used to construct a connectivity model (Figure 8A). (B) Quantification of rabies-mediated retrograde labeled PKC-δ+ and PKC-δ neurons in the CeC from genetically defined CeA neurons. Individual points represent the number of retrograde labeled neurons per single section in the CeC from n = 3 sections from 3 mice, bars represent mean ± s.e.m.. Arbitrary threshold of 2.5 neurons per section was used to construct a connectivity model (Figure 8A). (C) Quantification of rabies-mediated retrograde labeled PKC-δ + and PKC-δ neurons in the CeL from genetically defined CeA neurons. Individual points represent the number of retrograde labeled neurons per single section in the CeL from n = 3 sections from 3 mice, bars represent mean ± s.e.m.. Arbitrary threshold of 5 neurons per section was used to construct a connectivity model (Figure 8A). (D–J) Representative histology of rabies-mediated retrograde tracing from CeC Prkcd+ neurons (D), CeL Prkcd+ neurons (E), CeL Sst+ neurons (F), CeL Crh+Nts+Tac2+ neurons (G), CeM Nts+ neurons (H), CeM Sst+ neurons (I), CeM Tac2+ neurons (J) in the CeA and BLA. Starter cells are labeled with eGFP (green) and mCherry (red) and mouse line of starter cells are noted (italicized), Rabies virus is labeled with mCherry (red). Prkcd protein (purple) was labeled in the CeA. Ppp1r1b protein (purple) was labeled in BLA. The anterior-posterior (AP) distance from Bregma (mm), scale bar, 250 μm.
Figure 6
Figure 6. BLA Ppp1r1rb + and Rspo2+ neurons make monosynaptic excitatory and disynaptic inhibitory connections to distinct CeA neurons
(A–B) The proportion and number of CeC, CeL, and CeM neurons that receive only excitatory (black), both excitatory and inhibitory (yellow), only inhibitory (red), or no response (white) from blue light stimulation of BLA Ppp1r1b-ChR2 fibers (A) or BLA Rspo2-ChR2 fibers (B). Numbers inside bars represent total number of neurons for each case. (C–D) Example voltage clamped traces of IHC or qPCR-confirmed CeC Prkcd+, CeL Prkcd+, CeL Prkcd, CeM Nts+, CeM Sst+, and CeM Tac2+ neurons in response to blue light stimulation of BLA Ppp1r1b-ChR2 fibers (C) or BLA Rspo2-ChR2 fibers (D). Bottom traces represent responses at ~−70 mV and top traces represent responses at ~−50 mV. Counts of genetically confirmed neurons found in Figure S6J and S6K. (E–F) Representative histology of IHC confirmation of CeL Prkcd+ neurons in BLA Ppp1r1b-ChR2 slices (E) and CeL Prkcd neurons in BLA Rspo2-ChR2 slices (F). The anterior-posterior (AP) distance from Bregma (mm), scale bar, 100 μm.
Figure 7
Figure 7. BLA to CeA pathway for appetitive behavior is genetically analogous to corticostriatal circuits
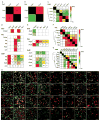
(A–C) Expression of striatal genetic markers in the CeA. Quantification of overlap of Drd2 and Penk in the CeC (A). Quantification of overlap of Pdyn and Penk in the CeL (B). Quantification of overlap of Drd2, Penk, Drd1, Tac1, and Pdyn in the CeM (C). Values represent percent labelling of overlap of genes in column amongst genes in rows. For example, 35% of CeL Penk labeled neurons coexpress Pdyn (B). Values represent percentage of labeling from totaling all cells counted from n = 3 mice. Hierarchical clustering was performed in the CeM using the percent overlap profile of each gene (C). (D–E) Quantification of overlap of striatal markers—Drd1, Drd2, Pdyn, Penk and Tac1—amongst Prkcd+ neurons in the CeC; Prkcd+, Sst+, Nts+, Tac2+, and Crh+ neurons in the CeL; Sst+, Nts+, Tac2+, and Crh+ neurons in the CeM (D). Quantification of overlap of Prkcd, Sst, Nts, Tac2, Crh amongst Drd1+ and Penk+ neurons in the CeC; Pdyn+ and Penk+ neurons in the CeL; Drd1+, Drd2+, Pdyn+, Penk+ and Tac1+ neurons in the CeM (E). Values represent percentage of labeling from totaling all cells counted from n = 3 mice. (F–G) Overlap matrix of genes expressed in the CeL (F) and CeM (G). Values represent percentage of labeling from totaling all cells counted from n = 3 mice and include the percentage of labeling values found in Figure 1. Hierarchical clustering was performed from using the overlap profile of each gene. (H) Representative histology of CeA expression of CeA genetic markers (Prkcd, Sst, Nts, Tac2, Crh) with striatal markers (Drd1, Drd2, Pdyn, Penk Tac1). Scale bar, 50 μm.
Figure 8
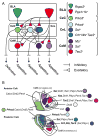
Figure 8. Summary of anatomical and genetic results
(A) Structural and functional model of cell-type specific BLA to CeA connectivity derived from monosynaptic rabies tracing experiments (Figure 2 and 5). BLA Rspo2+ neurons mainly innervate CeC Prkcd neurons, which in turn innervate several CeA neurons that mediate appetitive behaviors. BLA Ppp1r1b+ neurons innervate all CeA neurons in the model, CeA neurons that mediate appetitive behaviors as well as CeA Prkcd+ neurons, which in turn innervate CeA neurons that mediate appetitive behaviors. (B) Graphical summary of genetically distinct CeA populations and their spatial distribution within the CeA. CeM neurons (Figure 1, 7), though not portrayed intermingled, are intermingled. CeL neurons are overall intermingled but also have a slight spatial segregation as depicted in the cartoon.

Similar articles

Cited by

References

    1. Andero R, Dias BG, Ressler KJ. A role for Tac2, NkB, and Nk3 receptor in normal and dysregulated fear memory consolidation. Neuron. 2014;83:444–454. - PMC - PubMed
    1. Badrinarayan A, Prater KE, Orsini CA. The role of the central amygdala in selecting circuits and responses. The Journal of neuroscience : the official journal of the Society for Neuroscience. 2012;32:8431–8433. - PMC - PubMed
    1. Bandler R, Depaulis A. Elicitation of intraspecific defence reactions in the rat from midbrain periaqueductal grey by microinjection of kainic acid, without neurotoxic effects. Neuroscience letters. 1988;88:291–296. - PubMed
    1. Berridge KC, Robinson TE. Parsing reward. Trends in neurosciences. 2003;26:507–513. - PubMed
    1. Bilkei-Gorzo A, Erk S, Schurmann B, Mauer D, Michel K, Boecker H, Scheef L, Walter H, Zimmer A. Dynorphins regulate fear memory: from mice to men. The Journal of neuroscience : the official journal of the Society for Neuroscience. 2012;32:9335–9343. - PMC - PubMed