. 2017 Jun 2;45(10):5770-5784.
doi: 10.1093/nar/gkx167.

Dynamic changes in chromatin states during specification and differentiation of adult intestinal stem cells

Affiliations

Dynamic changes in chromatin states during specification and differentiation of adult intestinal stem cells

Juri Kazakevych et al. Nucleic Acids Res. .

Abstract

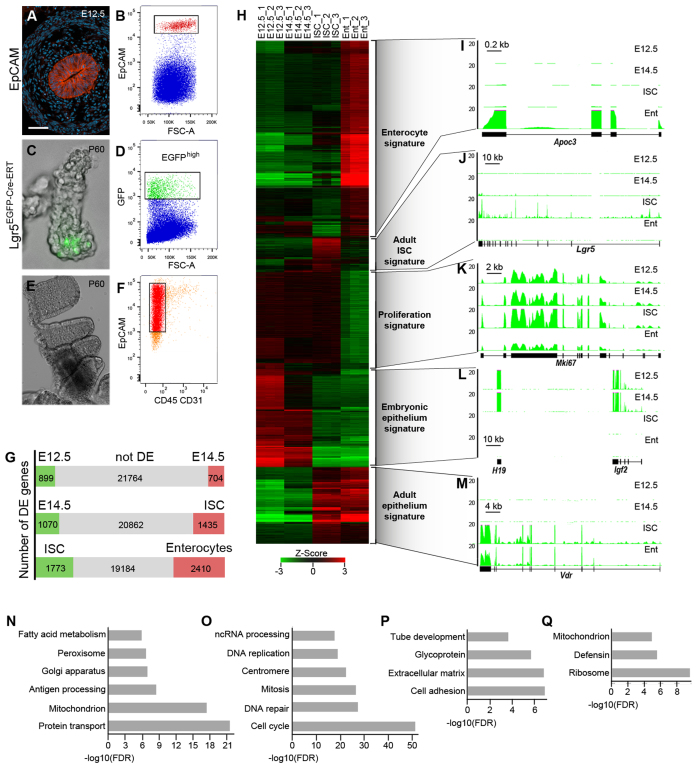
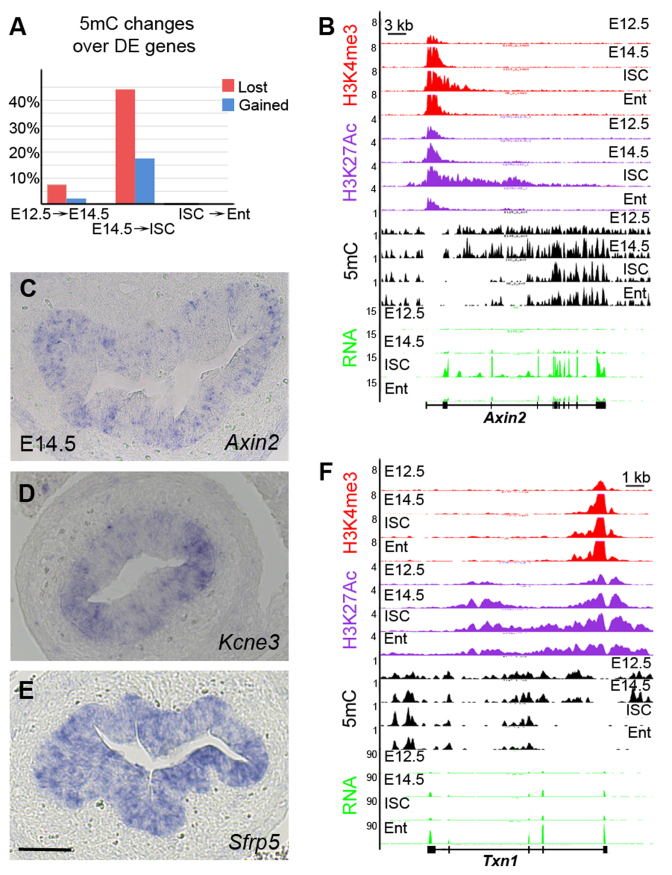
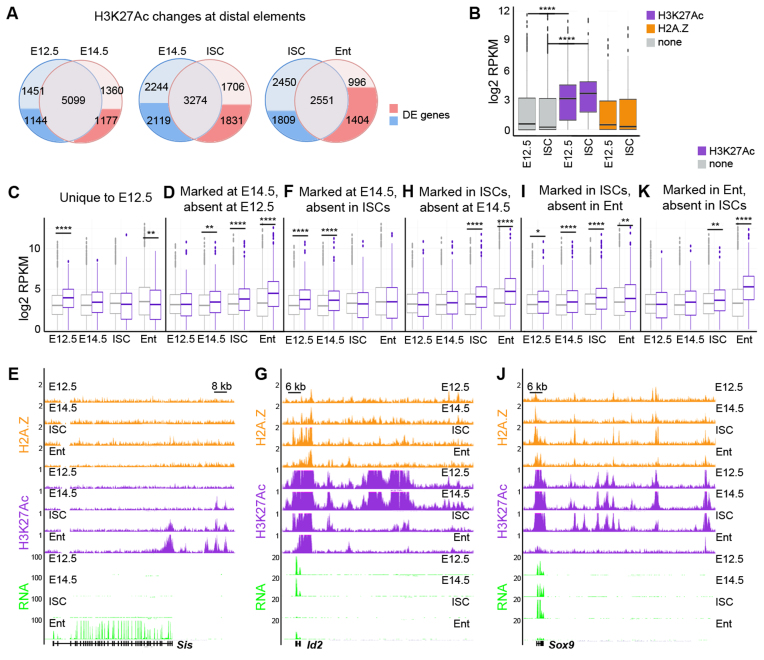
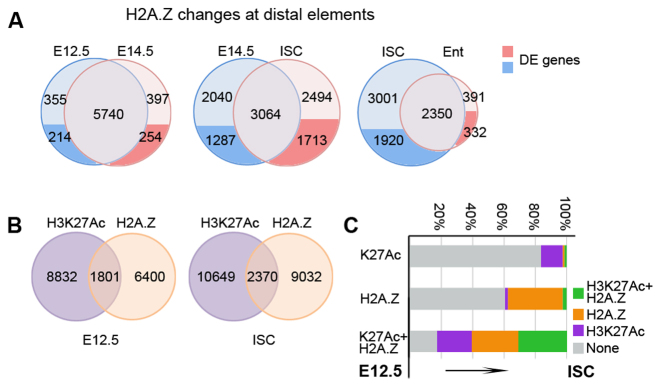
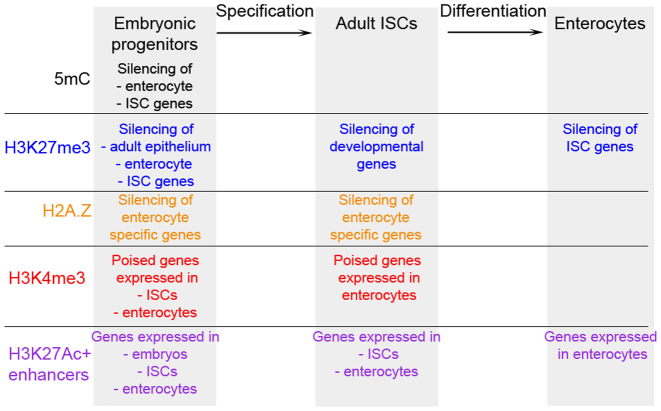
Epigenetic mechanisms, including chromatin structure, chromatin dynamics and histone modifications play an important role for maintenance and differentiation of pluripotent embryonic stem cells. However, little is known about the molecular mechanisms of adult stem cell specification and differentiation. Here, we used intestinal stem cells (ISCs) as a model system to reveal the epigenetic changes coordinating gene expression programs during these processes. We found that two distinct epigenetic mechanisms participate in establishing the transcriptional program promoting ISC specification from embryonic progenitors. A large number of adult ISC signature genes are targets of repressive DNA methylation in embryonic intestinal epithelial progenitors. On the other hand, genes essential for embryonic development acquire H3K27me3 and are silenced during ISC specification. We also show that the repression of ISC signature genes as well as the activation of enterocyte specific genes is accompanied by a global loss of H2A.Z during ISCs differentiation. Our results reveal that, already during ISC specification, an extensive remodeling of chromatin both at promoters and distal regulatory elements organizes transcriptional landscapes operating in differentiated enterocytes, thus explaining similar chromatin modification patterns in the adult gut epithelium.


Figures

Figure 1.
Figure 1.
Transcriptional programs during specification, maintenance and differentiation of the adult ISCs. (A) Immunostaining for EpCAM in E12.5 mouse small intestine. EpCAM (red) specifically labels epithelial cells. DAPI staining (blue) shows nuclei. (B) Fluorescence-Activated Cell Sorting (FACS) plot showing purification of EpCAM+ cells (red) from E12.5 mouse small intestine (n > 10). (C) Immunofluorescence for Lgr5-EGFP expressing adult ISCs (green). (D) FACS plot showing isolation of Lgr5-EGFPhigh adult ISCs (green) (n > 10). (E) Image of intestinal villi. (F) FACS plot showing isolation of EpCAM+CD31CD45 enterocytes (red) (n > 10). Scale bar: 27 μm (A), 100 μm (C), 0.5 mm (E). (G) Pair-wise comparisons of gene expression between successive cell populations. The differentially expressed genes are shown in green or red. (H) Heat map showing clustering of differentially expressed genes for each cell population. (I–M) Representative examples of gene expression patterns for ‘enterocyte’ (I), ‘adult ISC’ (J), ‘proliferation’ (K), ‘embryonic epithelium’ (L) and ‘adult epithelium’ (M) signatures. The y-axis indicates the coverage normalized by library size (reads per million). (N–Q) Gene ontology analysis of ‘enterocyte’ (N), ‘proliferation’ (O), ‘embryonic epithelium’ (P) and ‘adult epithelium’ (Q) signatures.
Figure 2.
Figure 2.
Dynamics of histone marks during specification and differentiation of ISCs. (A–C) Pair-wise comparisons showing changes in H3K27me3 (A), H3K4me3 (B) and H3K27Ac (C) levels at the TSS of differentially expressed genes between successive stages. (D) Heat maps showing distributions of H3K27me3 (blue), H3K4me3 (red) and H3K27Ac (magenta) at the TSS of differentially expressed genes for five transcriptional signatures defined by RNA expression. The heat maps were generated using ChIP/input fold enrichment ratios. (E and F) Representative examples of chromatin and gene expression profiles for ‘adult ISC’ (E) and ‘embryonic epithelium’ (F) signatures. The y-axis indicates the coverage normalized by library size (reads per million).
Figure 3.
Figure 3.
Dramatic changes in DNA methylation during ISC specification. (A) Pair-wise comparisons showing changes in 5mC distribution over the differentially expressed genes between successive stages. Silent genes that lost 5mC mark upon activation are indicated in red, whereas genes that were downregulated and gained 5mC mark are indicated in blue. (B) Representative example of chromatin and gene expression profiles in four cell types for ISC marker Axin2. The y-axis indicates the coverage normalized by library size (reads per million). (C–E) Expression patterns of Axin2 (C), Kcne3 (D) and Sfrp5 (E) in the embryonic small intestine at E14.5. Only a subset of the embryonic intestinal epithelial cells expresses Axin2 or Kcne3, whereas Sfrp5 is expressed in all epithelial cells. Scale bar: 50 μM. (F) Representative example of chromatin and gene expression profiles in four cell types for enterocyte specific Txn1. The y-axis indicates the coverage normalized by library size (reads per million).
Figure 4.
Figure 4.
H2A.Z levels decreases during ISC differentiation. (A) Pair-wise comparisons showing changes in H2A.Z levels at the TSS of differentially expressed genes between successive stages. (B and C) Immunostainings for H2A.Z (B, yellow) and H3K27Ac (C, yellow) in the adult mouse small intestine. H2A.Z levels are decreased in enterocytes (Ent) compared to the crypt cells. Red arrowheads point on the ISCs. In contrast, equal amounts of H3K27Ac are detected in both enterocytes and crypt cells. DAPI staining (blue) shows nuclei. Scale bar: 50 μM. (D) Representative example of chromatin and gene expression profiles in four cell types for Txn1. The y-axis indicates the coverage normalized by library size (reads per million).
Figure 5.
Figure 5.
Epigenetic changes at distal elements during specification and differentiation of the ISCs. (A) Pair-wise comparisons showing changes in H3K27Ac levels at distal elements between successive stages. The distal elements linked to differentially expressed genes are indicated in dark blue and red. (B) Box and whisker plots showing correlations of RNA expression levels (log2) with the presence of either H3K27Ac positive (magenta) or H2A.Z positive (orange) distal elements in all studied cell populations. Genes linked to H3K27Ac distal elements (magenta) are expressed at higher levels than non-linked genes (gray). The expression levels of genes linked to H2A.Z distal elements (orange) do not differ from non-linked genes (gray). ****P < 10−4, by ANOVA test. (C, D, F, H, I, K) Box and whisker plots showing correlations of RNA expression levels (log2) for genes linked to H3K27Ac positive distal elements (magenta) versus control genes (gray) at E12.5 (C), at E14.5 absent at E12.5 (D), at E14.5 absent in ISCs (F), in ISCs absent at E14.5 (H), in ISCs absent in Enterocytes (I) and in Enterocytes (K). Genes linked to H3K27Ac distal elements (magenta) are expressed at higher levels than not linked genes (gray). Furthermore, many distal elements are pre-marked by H3K27Ac prior to the expression of the linked genes, for example enterocyte specific genes at E14.5 (Ent in d) ****P < 10−10, **P < 10−4, *P < 10−2, by ANOVA test. (E, G, J) Representative examples of chromatin and gene expression profiles in four cell types for Sis (E), Id2 (G) and Sox9 (J) loci. The y-axis indicates the coverage normalized by library size (reads per million).
Figure 6.
Figure 6.
H3K27Ac and H2A.Z mark distinct set of inter and intragenic elements. (A) Pair-wise comparisons showing changes in H2A.Z levels at distal elements between successive stages. The distal elements linked to differentially expressed genes are indicated in dark blue and red. (B) Overlap between stage specific H3K27Ac and H2A.Z positive distal elements. (C) Changes of chromatin marks at distal elements during transition from embryonic epithelium to adult ISCs. The distal elements covered by a certain chromatin mark at E12.5 are displayed on the left y-axis. The percentage of distal elements in ISCs is shown on x-axis. Most regions positive for either H3K27Ac or H2A.Z at E12.5 are negative for both marks in ISCs (grey). In contrast, most distal elements double positive at E12.5 stay either double positive (green) or become single H3K27Ac (magenta), or H2A.Z (orange) positive in ISCs.
Figure 7.
Figure 7.
Epigenetic changes during the specification and differentiation of ISCs. In embryonic progenitors, ISC signature, adult epithelium and enterocyte specific genes are repressed by DNA methylation (5mC) or Polycomb complexes (H3K27me3). On the other hand, promoters of ISC and enterocyte specific genes are poised for activation and marked by H3K4me3. Moreover, distal elements linked to embryonic, ISC and enterocyte specific genes are H3K27Ac positive. Upon specification, ISC signature, adult epithelium and enterocyte specific genes lose 5mC and H3K27me3, whereas developmental genes get silenced and acquire H3K27me3. During differentiation of the adult ISCs, while enterocyte specific genes lose H2A.Z and get activated, ISC signature genes get silenced.

References

    1. Allis C.D., Jenuwein T.. The molecular hallmarks of epigenetic control. Nat. Rev. Genet. 2016; 17:487–500. - PubMed
    1. Lee D.Y., Hayes J.J., Pruss D., Wolffe A.P.. A positive role for histone acetylation in transcription factor access to nucleosomal DNA. Cell. 1993; 72:73–84. - PubMed
    1. Guenther M.G., Levine S.S., Boyer L.A., Jaenisch R., Young R.A.. A chromatin landmark and transcription initiation at most promoters in human cells. Cell. 2007; 130:77–88. - PMC - PubMed
    1. Creyghton M.P., Cheng A.W., Welstead G.G., Kooistra T., Carey B.W., Steine E.J., Hanna J., Lodato M.A., Frampton G.M., Sharp P.A. et al. . Histone H3K27ac separates active from poised enhancers and predicts developmental state. Proc. Natl. Acad. Sci. U.S.A. 2010; 107:21931–21936. - PMC - PubMed
    1. Piunti A., Shilatifard A.. Epigenetic balance of gene expression by Polycomb and COMPASS families. Science. 2016; 352:aad9780. - PubMed

MeSH terms