. 2017 May 5;45(8):4667-4686.
doi: 10.1093/nar/gkx116.

In vivo cleavage specificity of Trypanosoma brucei editosome endonucleases

Affiliations

In vivo cleavage specificity of Trypanosoma brucei editosome endonucleases

Jason Carnes et al. Nucleic Acids Res. .

Abstract

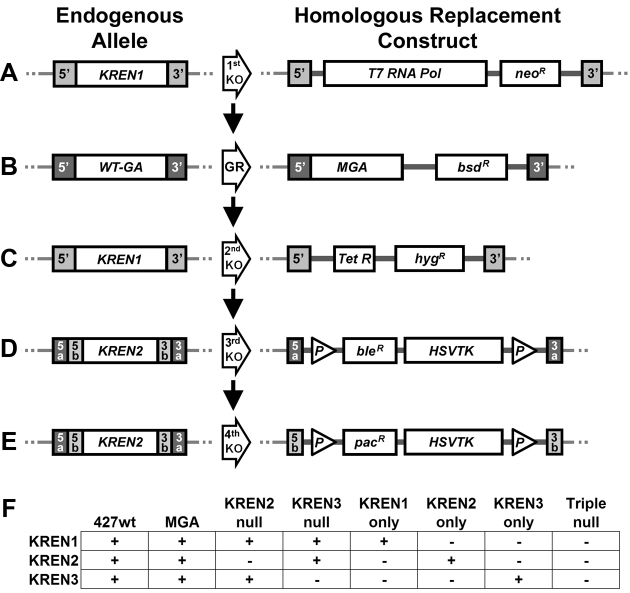
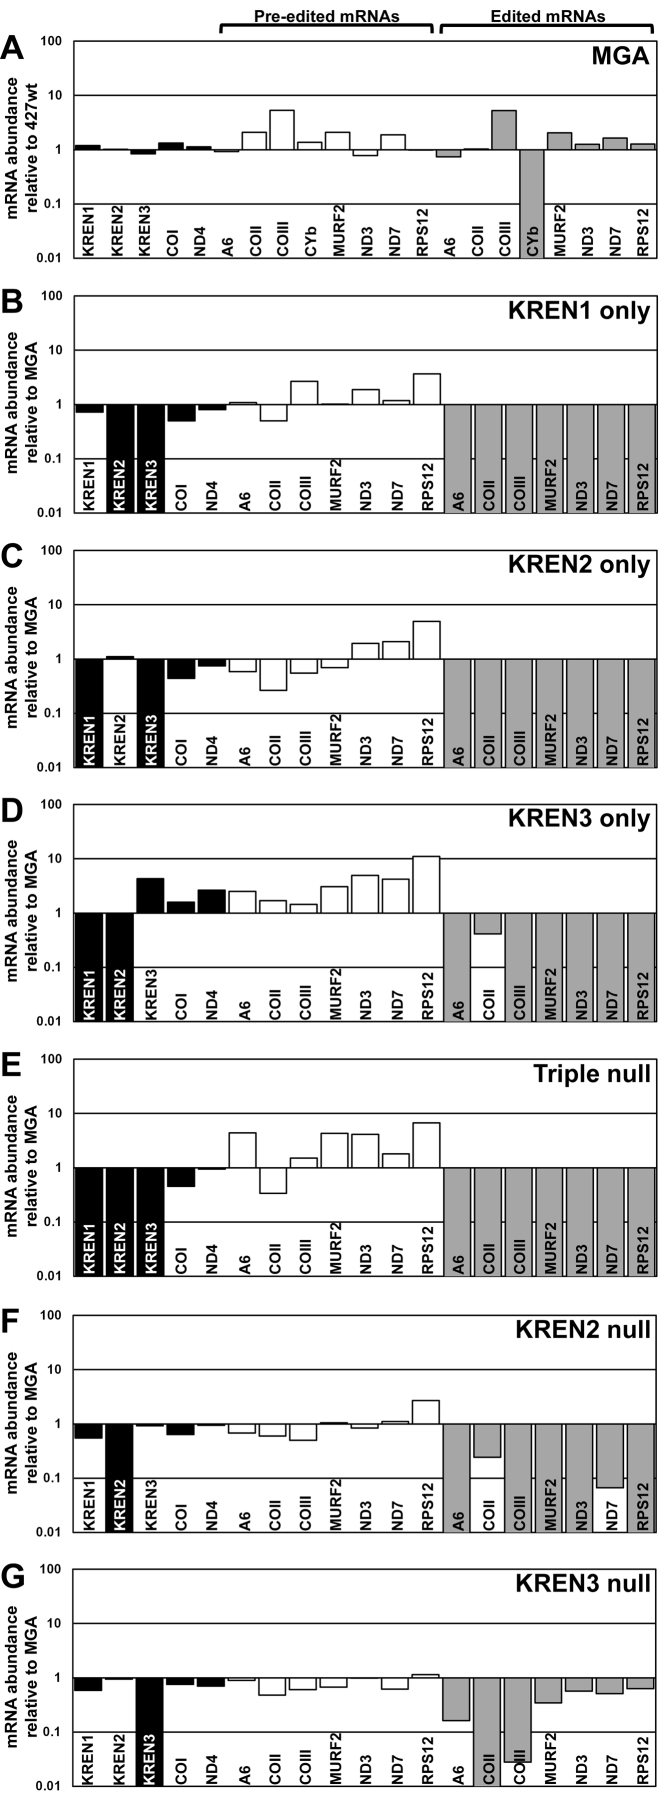
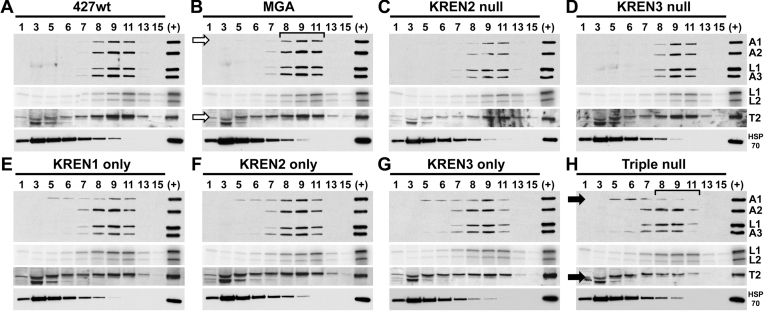
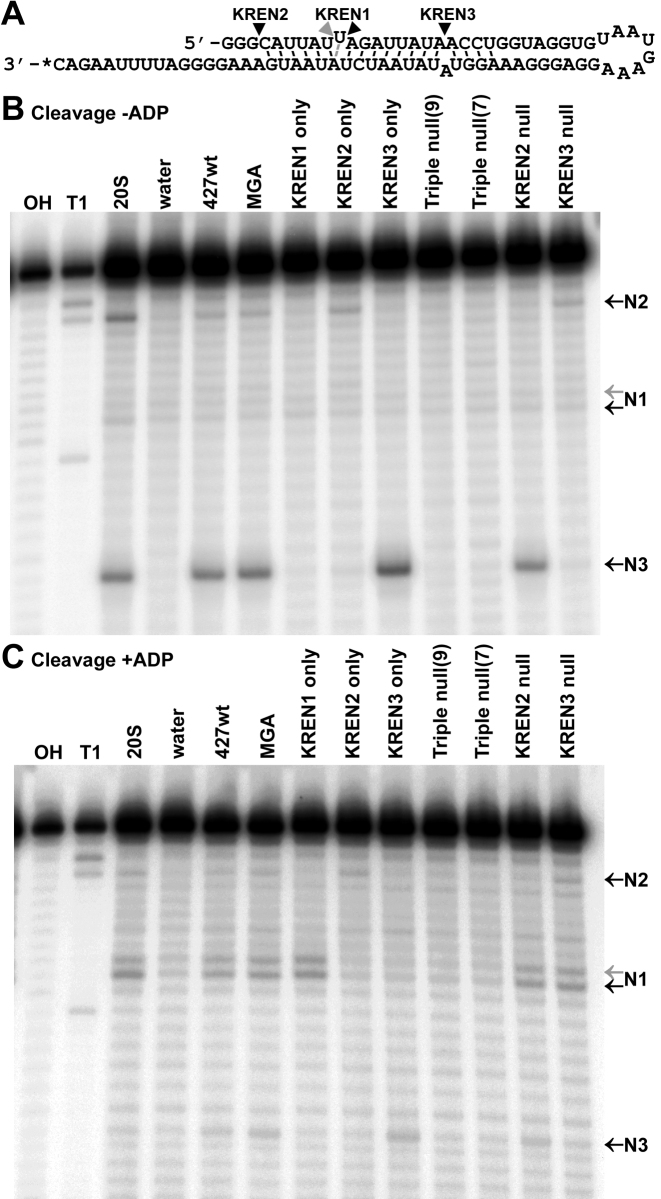
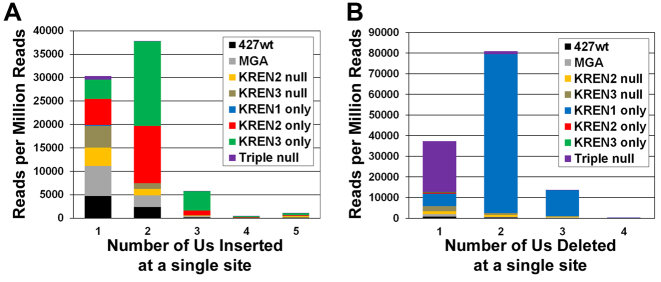
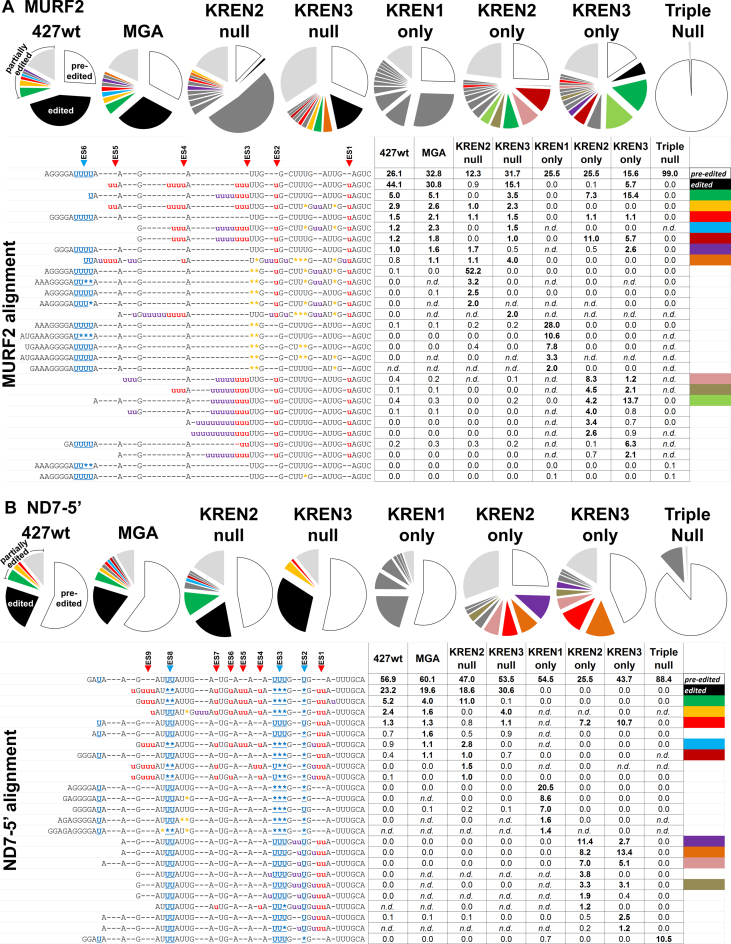
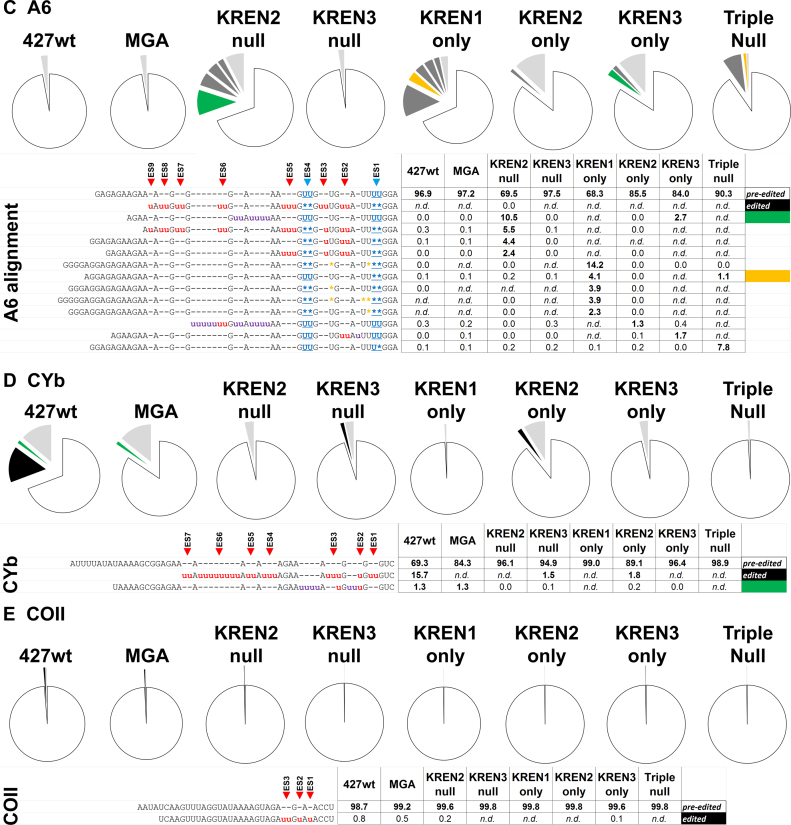
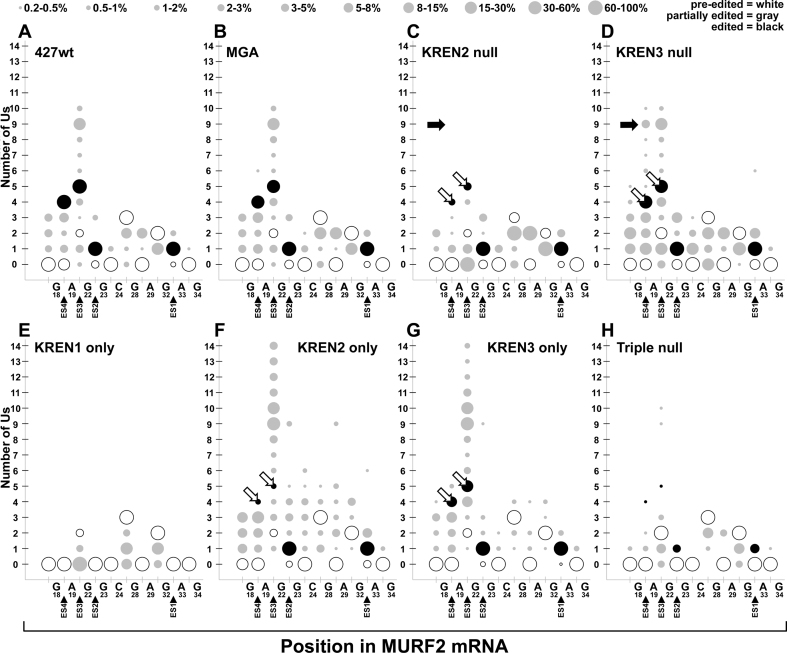
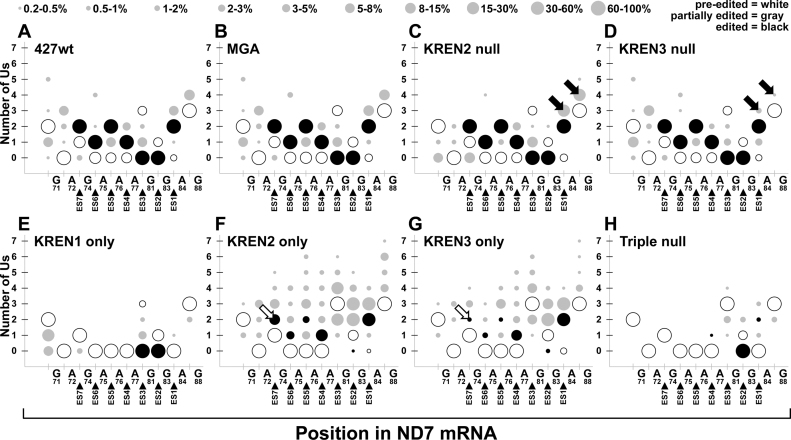
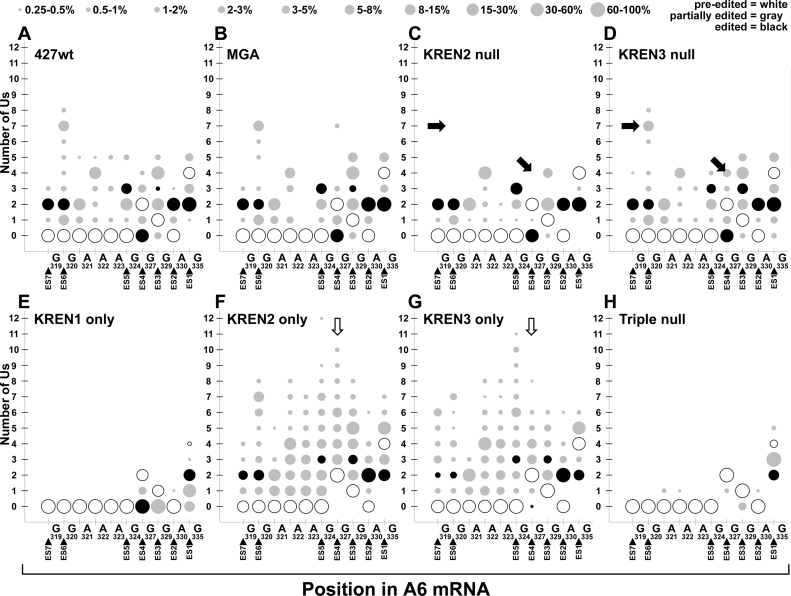
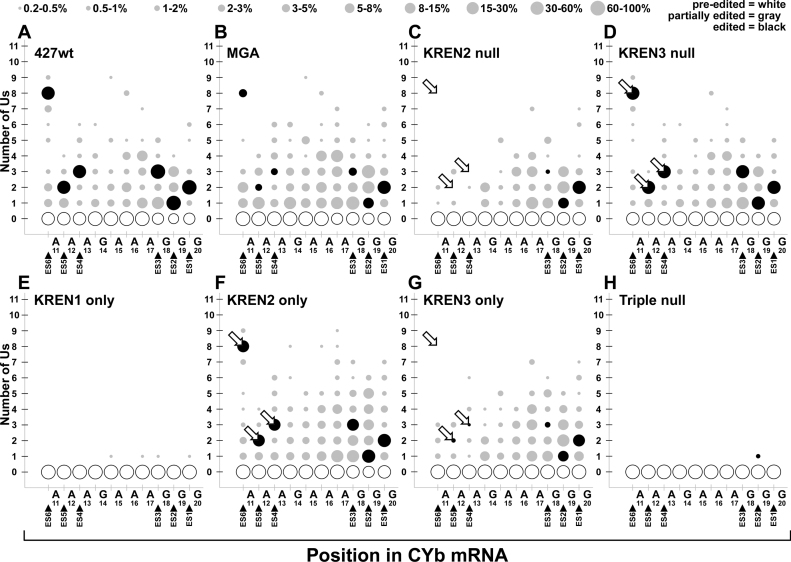
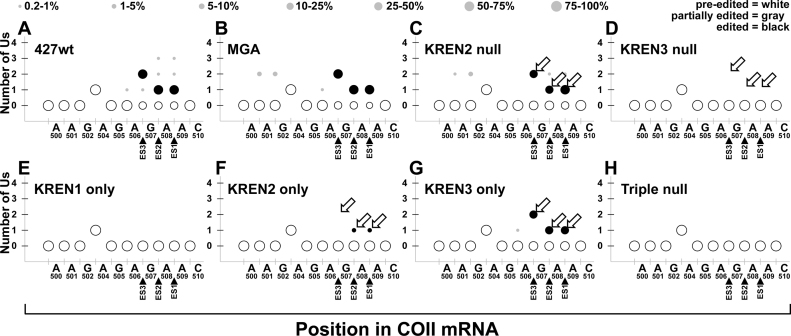
RNA editing is an essential post-transcriptional process that creates functional mitochondrial mRNAs in Kinetoplastids. Multiprotein editosomes catalyze pre-mRNA cleavage, uridine (U) insertion or deletion, and ligation as specified by guide RNAs. Three functionally and compositionally distinct editosomes differ by the mutually exclusive presence of the KREN1, KREN2 or KREN3 endonuclease and their associated partner proteins. Because endonuclease cleavage is a likely point of regulation for RNA editing, we elucidated endonuclease specificity in vivo. We used a mutant gamma ATP synthase allele (MGA) to circumvent the normal essentiality of the editing endonucleases, and created cell lines in which both alleles of one, two or all three of the endonucleases were deleted. Cells lacking multiple endonucleases had altered editosome sedimentation on glycerol gradients and substantial defects in overall editing. Deep sequencing analysis of RNAs from such cells revealed clear discrimination by editosomes between sites of deletion versus insertion editing and preferential but overlapping specificity for sites of insertion editing. Thus, endonuclease specificities in vivo are distinct but with some functional overlap. The overlapping specificities likely accommodate the more numerous sites of insertion versus deletion editing as editosomes collaborate to accurately edit thousands of distinct editing sites in vivo.


Figures

Figure 1.
Figure 1.
Schematic of homologous recombination knockout constructs. The homologous recombination constructs used to create the N3 only cell line are depicted as an example of the methods used to generate all cell lines, with endogenous allele depicted on the left and homologous replacement on the right. (A) Knockout of the first KREN1 allele (first KO) by replacement with T7 RNA polymerase and neomycin resistance gene (neoR) using KREN1 5΄ and 3΄ UTR targeting sequences (light gray). (B) Gene Replacement (GR) of the Wild-Type Gamma ATP synthase (WT-GA) with the Mutant Gamma ATP synthase (MGA) and blasticidin resistance (bsdR) gene using Gamma ATP synthase 5΄ and 3΄ UTR targeting sequences (dark gray). (C) Knockout of the second KREN1 allele (second KO) by replacement with tetracycline repressor (Tet R) and hygromycin resistance gene (hygR) using the same KREN1 5΄ and 3΄ UTR targeting sequences (light gray) used for first KO. (D) Knockout of the first KREN2 allele (third KO) by replacement with a cassette containing phleomycin resistance gene (bleR) fused to Herpes Simplex Virus Thymidine Kinase (HSVTK) flanked by lox P sites (P) using the outer KREN2 5΄ and 3΄ UTR targeting sequences (dark gray; 5a and 3a respectively). (E) Knockout of the second KREN2 allele (fourth KO) by replacement with a cassette containing puromycin resistance gene (pacR) fused to Herpes Simplex Virus Thymidine Kinase (HSVTK) flanked by lox P sites (P) using the inner KREN2 5΄ and 3΄ UTR targeting sequences (light gray; 5b and 3b respectively). (F) Presence or absence of editing endonuclease genes in examined cell lines. The presence (+) or absence (–) of KREN1, KREN2, and KREN3 is shown for the eight cell lines examined in this work. Absence reflects elimination of both alleles of the indicated gene by homologous recombination.
Figure 2.
Figure 2.
Real-time PCR analysis shows loss of endonuclease expression and associated loss of editing. Relative RNA abundance is shown for KREN1, KREN2, KREN3 and never-edited mRNAs COI and ND4 (black bars), pre-edited mRNAs (white bars), and edited mRNAs (gray bars). For each target amplicon, the relative change in RNA abundance was determined by using telomerase reverse transcriptase (TERT) mRNA as an internal control, with each cell line compared relative to either 427wt or MGA control as indicated. (A) MGA cells have no large changes in mRNA abundance relative to 427wt, with the exception of the complete loss of CYb editing. As the remaining cell lines are compared to MGA, CYb is excluded from those analyses. (B) KREN1 only cells have no detectable KREN2 or KREN3 mRNA, and a broad loss of RNA editing. (C) KREN2 only cells have no detectable KREN1 or KREN3 mRNA, and a broad loss of RNA editing. (D) KREN3 only cells have no detectable KREN1 or KREN2 mRNA, and a broad loss of RNA editing, with COII editing notably retained. (E) Triple null cells have no detectable KREN1, KREN2, or KREN3 mRNA, and a broad loss of RNA editing. (F) KREN2 null cells have no detectable KREN2 mRNA, and a broad loss of RNA editing with some amount of COII and ND7 editing retained. (G) KREN3 null cells have no detectable KREN3 mRNA, and a loss of COII RNA editing with variable amounts of other edited mRNAs retained.
Figure 3.
Figure 3.
Western and adenylation analyses of glycerol gradient fractionated editosomes. Gradient fractions from 427wt (A), MGA (B), KREN2 null (C), KREN3 null (D), KREN1 only (E), KREN2 only (F), KREN3 only (G) and triple null (H) were analysed using antibodies recognizing editosome proteins KREPA1, KREPA2, KREL1 and KREPA3 (first panels), by adenylation of ligases KREL1 and KREL2 (second panels), using antibody against KRET2 (third panels), or using antibody against mitochondrial HSP70 as a non-editosome control. Typical ∼20S editosome peak signal is centered on fraction 9, as highlighted by the bracket in the MGA control. In KREN1 only, KREN2 only, KREN3 only, and Triple null cells the sedimentation of KREPA1 is notably shifted toward upper part of the gradient (i.e. smaller in size) relative to 427wt and MGA controls, as is KRET2 in Triple null cells (indicated by solid arrows in Triple null compared to open arrows in MGA). Bracket in Triple null cells highlights difference in the ∼20S region compared to MGA, A control sample of ∼20S fraction from purified mitochondria (+) is included in each analysis.
Figure 4.
Figure 4.
Editing endonuclease cleavage assays using ‘Triple-site’ substrate RNA. (A) Schematic of ‘Triple-site’ substrate RNA, with wedges indicating distinct cleavage sites for KREN1, KREN2 and KREN3 endonucleases. Asterisk denotes location of the radiolabel. Black wedges denote typical cleavage sites corresponding to activity of KREN1 (N1), KREN2 (N2) or KREN3 (N3). Note that the N1 cleavage site can shift +1 nt closer to the 5΄ end (gray wedge) in alternate conformers of the ‘Triple-site’ substrate. (B) Cleavage of ‘Triple-site’ substrate RNA in reactions lacking ADP to favor insertion cleavage by either ∼20S glycerol gradient fraction from purified mitochondria, or ∼20S peak of glycerol gradients (fraction 9) of indicated cell lines. Fraction 7 from Triple null cell line is also included. Water is used as a negative control for background degradation of the substrate. Reference ladders were generated by cleavage using alkaline hydrolysis (OH) or RNase T1 (T1). (C) Cleavage of ‘Triple-site’ substrate RNA in reactions with ADP to favor deletion cleavage, otherwise similar to (B).
Figure 5.
Figure 5.
Frequency of various numbers of Us inserted or deleted in reads edited at a single site. Reads with editing at a single site were counted based on the number of Us either (A) inserted or (B) deleted, and these read counts were normalized to the total number of mapped reads for each sample. Reads from each cell line are indicated by colors noted in legend.
Figure 6.
Figure 6.
Distinct and overlapping endonuclease specificities are revealed by sequencing of in vivo editing products. Analysis of RNAseq reads for MURF2 (A), ND7-5΄ (B), A6 (C), CYb (D) and COII (E) show activities corresponding to endonuclease repertoire in various cells lines. Pie charts show percent of mapped reads for each target that have a unique read sequence. For each sample, the proportion of reads that perfectly match pre-edited sequence are white and those that match fully edited sequence are black. Each partially edited read sequence that represents more than 1% of the samples reads for that transcript is shown in dark gray, unless this read sequence is also found in another sample, in which case it is color-coded. This color-coding is used to identify the same read sequence within other samples, and is also shown in the far right column of the alignment table below to indicate the sequence. The proportion of partially edited read sequences that individually represent less than 1% of the samples reads are pooled into a section shown in light grey. An alignment of the most frequent read sequences is shown below, with a table indicating the proportion of each sample's reads that each sequence represents. Within the alignment, a lowercase red ‘u’ indicates canonical insertion, while a lowercase purple ‘u’ indicates non-canonical insertion. A blue underlined asterisk indicates canonical deletion, while an orange asterisk indicates non-canonical deletion. Hyphens are used to maintain alignment throughout the reads. Within the table numbers are rounded to the nearest tenth of a percent, and bold numbers highlight frequencies greater than 1%. Samples that had two or fewer reads for a given read sequence are classified as not detected (n.d.).
Figure 6.
Figure 6.
Distinct and overlapping endonuclease specificities are revealed by sequencing of in vivo editing products. Analysis of RNAseq reads for MURF2 (A), ND7-5΄ (B), A6 (C), CYb (D) and COII (E) show activities corresponding to endonuclease repertoire in various cells lines. Pie charts show percent of mapped reads for each target that have a unique read sequence. For each sample, the proportion of reads that perfectly match pre-edited sequence are white and those that match fully edited sequence are black. Each partially edited read sequence that represents more than 1% of the samples reads for that transcript is shown in dark gray, unless this read sequence is also found in another sample, in which case it is color-coded. This color-coding is used to identify the same read sequence within other samples, and is also shown in the far right column of the alignment table below to indicate the sequence. The proportion of partially edited read sequences that individually represent less than 1% of the samples reads are pooled into a section shown in light grey. An alignment of the most frequent read sequences is shown below, with a table indicating the proportion of each sample's reads that each sequence represents. Within the alignment, a lowercase red ‘u’ indicates canonical insertion, while a lowercase purple ‘u’ indicates non-canonical insertion. A blue underlined asterisk indicates canonical deletion, while an orange asterisk indicates non-canonical deletion. Hyphens are used to maintain alignment throughout the reads. Within the table numbers are rounded to the nearest tenth of a percent, and bold numbers highlight frequencies greater than 1%. Samples that had two or fewer reads for a given read sequence are classified as not detected (n.d.).
Figure 7.
Figure 7.
Bubble plot analyses of MURF2 edited read sequences show the frequency of site-specific insertion and deletion activities. Bubble plots show number of Us inserted at potential editing sites at the 3΄ end of MURF2 for each cell line. All mapped reads for MURF2 are analyzed to determine the amount (number of Us, y-axis) and position (location within 3΄ end of edited region, x-axis) of editing events within each cell line. The x-axis shows the MURF2 mRNA position using the non-U nucleotide sequence, with position numbering starting at the first base of the start codon in the pre-edited sequence. When the number of Us at a position matches the pre-edited number of Us, the bubble is white; when the number of Us is altered by editing, the number of Us matching a fully edited mRNA is colored black. When the number of Us at a position matches neither pre-edited nor fully edited sequence, bubbles are colored grey to denote partial editing. The size of the bubble correlates with the proportion of reads that have that number of Us at each position, with the legend at top giving the percent range for each size bubble. To decrease noise in these plots, data points that represent <0.25% of reads or fewer than five reads total are not shown. Open arrows highlight differences in fully edited ES3 and ES4 corresponding to differences in KREN2 and KREN3 activities. Closed arrows highlight predominant non-canonical insertions at ES4 that are distinctive in KREN3 null cells.
Figure 8.
Figure 8.
Bubble plot analyses of ND7-5΄ edited read sequences show the frequency of site-specific insertion and deletion activities. Bubble plots of ND7-5΄ editing for each cell line displayed as described for Figure 8. Open arrows highlight differences in fully edited ES7 corresponding to differences in KREN2 and KREN3 activities. Closed arrows highlight predominant non-canonical insertions before and at ES1 that reflect differences in KREN2 and KREN3 activities.
Figure 9.
Figure 9.
Bubble plot analyses of A6 edited read sequences show the frequency of site-specific insertion and deletion activities. Bubble plots of A6 editing for each cell line displayed as described for Figure 8. Closed arrows highlight predominant non-canonical insertions at ES4 and ES6 that are distinctive in KREN3 null cells. Open arrows highlight non-canonical insertions at ES4 corresponding to differences in KREN2 and KREN3 activities, as well as the loss of canonical deletion editing at this site.
Figure 10.
Figure 10.
Bubble plot analyses of CYb edited read sequences show the frequency of site-specific insertion and deletion activities. Bubble plots of CYb editing for each cell line displayed as described for Figure 8. Open arrows highlight differences in fully edited ES4, ES5 and ES6 corresponding to strong preferences for KREN2 compared to KREN3 at these sites.
Figure 11.
Figure 11.
Bubble plot analyses of COII edited read sequences show the frequency of site-specific insertion and deletion activities. Bubble plots of COII editing for each cell line displayed as described for Figure 8. Open arrows highlight differences in fully edited ES1, ES2 and ES3 corresponding to strong preferences for KREN3 compared to KREN2 at these sites.

Similar articles

Cited by

References

    1. Stuart K.D., Schnaufer A., Ernst N.L., Panigrahi A.K.. Complex management: RNA editing in trypanosomes. Trends Biochem. Sci. 2005; 30:97–105. - PubMed
    1. Aphasizheva I., Aphasizhev R.. U-insertion/deletion mRNA-editing holoenzyme: definition in sight. Trends Parasitol. 2016; 32:144–156. - PMC - PubMed
    1. Read L.K., Lukes J., Hashimi H.. Trypanosome RNA editing: the complexity of getting U in and taking U out. Wiley. Interdiscip. Rev. RNA. 2016; 7:33–51. - PMC - PubMed
    1. Schnaufer A., Domingo G.J., Stuart K.D.. Natural and induced dyskinetoplastid trypanosomatids: how to live without mitochondrial DNA. Int. J. Parasitol. 2002; 32:1071–1084. - PubMed
    1. Trotter J.R., Ernst N.L., Carnes J., Panicucci B., Stuart K.. A deletion site editing endonuclease in Trypanosoma brucei. Mol. Cell. 2005; 20:403–412. - PubMed

Publication types

MeSH terms