. 2017 Jun 2;45(10):5691-5706.
doi: 10.1093/nar/gkx131.

H3.Y discriminates between HIRA and DAXX chaperone complexes and reveals unexpected insights into human DAXX-H3.3-H4 binding and deposition requirements

Affiliations

H3.Y discriminates between HIRA and DAXX chaperone complexes and reveals unexpected insights into human DAXX-H3.3-H4 binding and deposition requirements

Lisa-Maria Zink et al. Nucleic Acids Res. .

Abstract

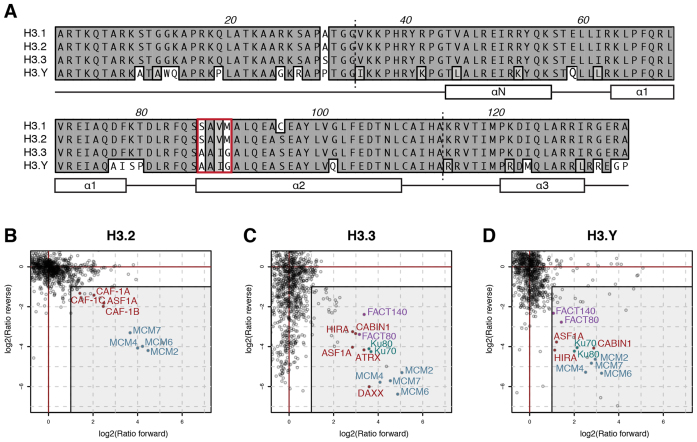
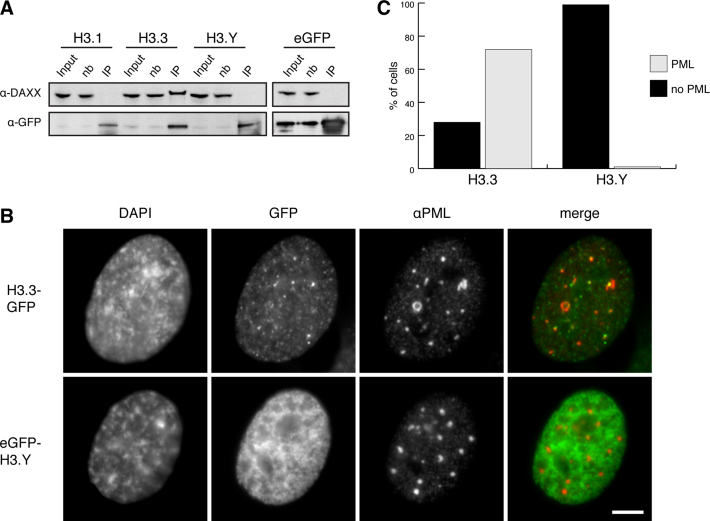
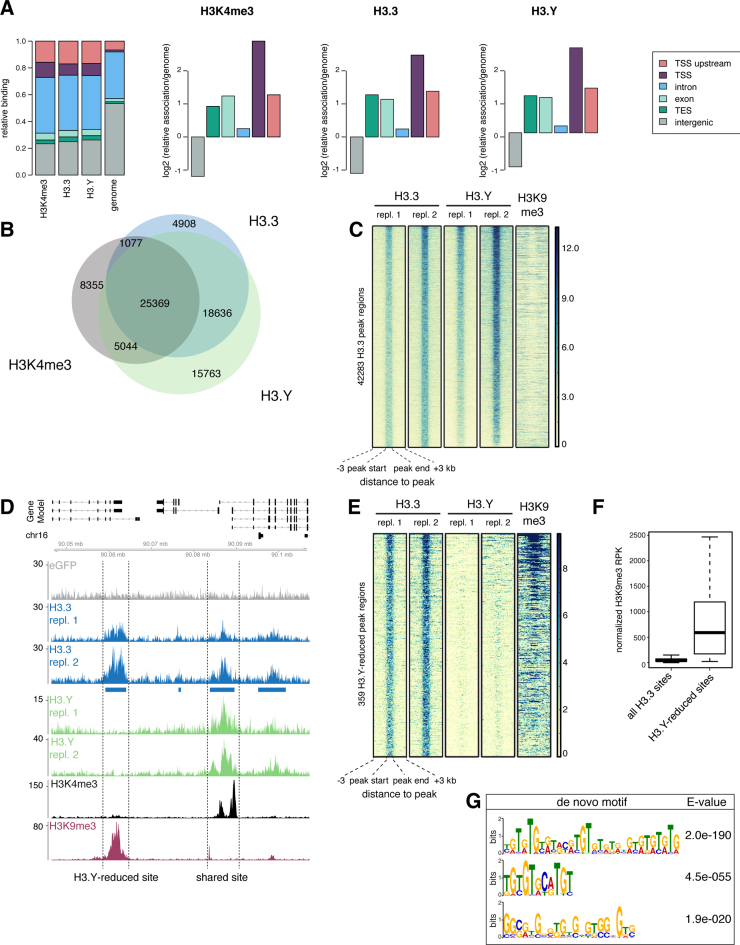
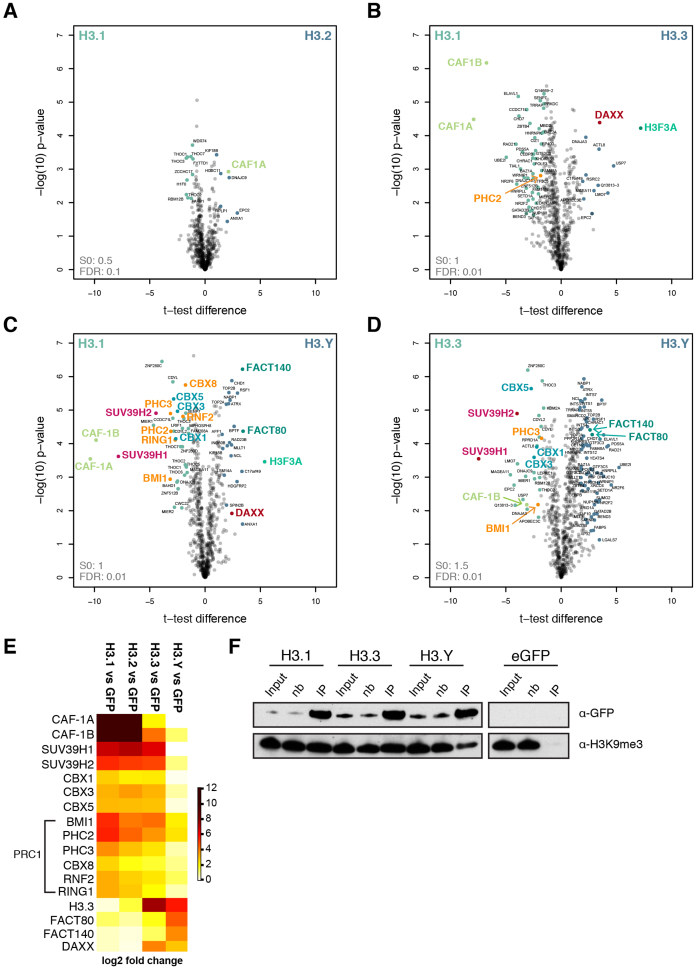
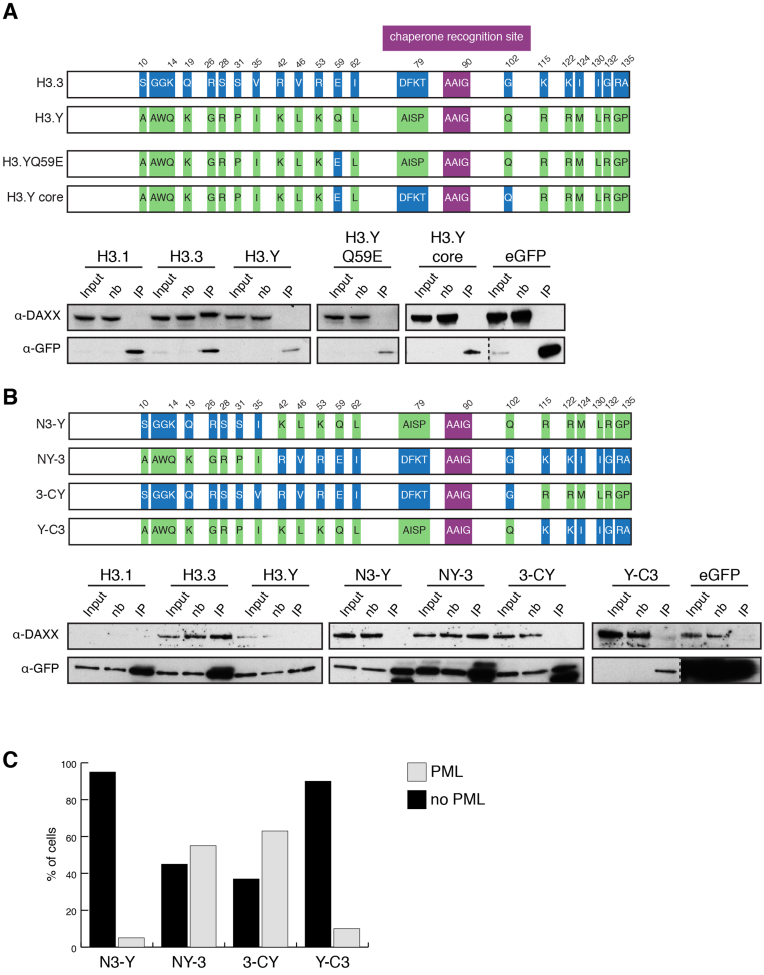
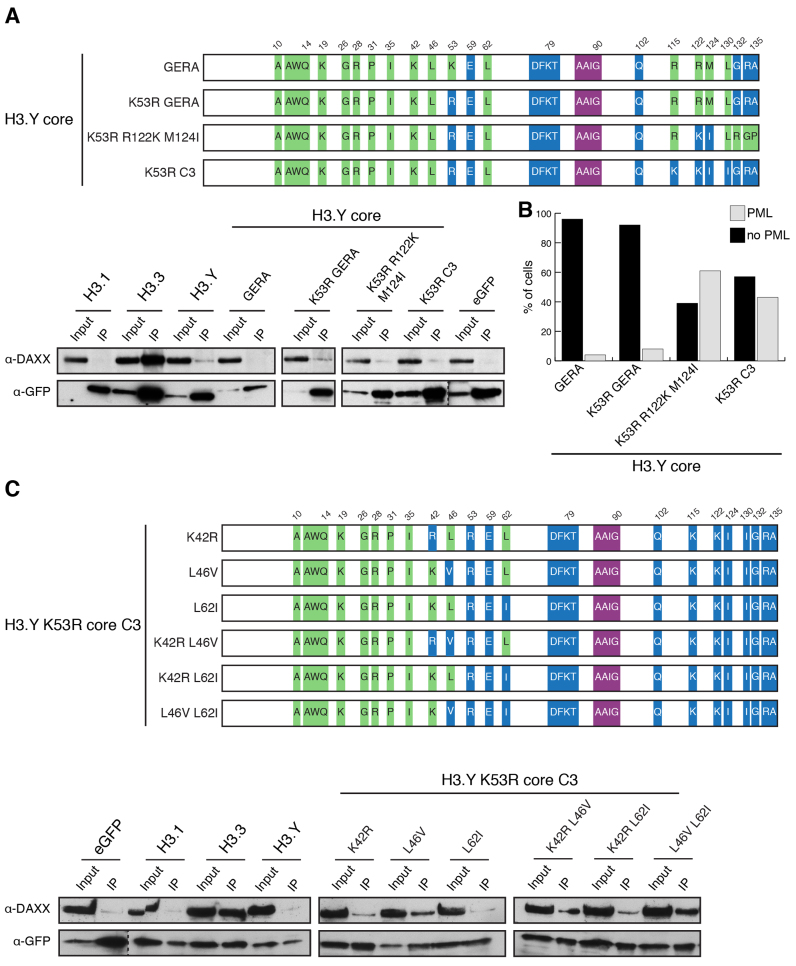
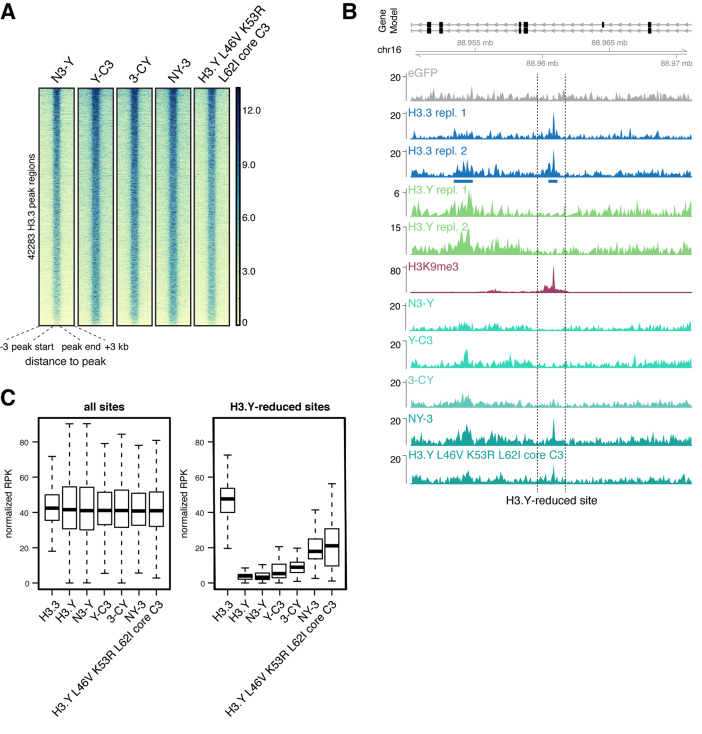
Histone chaperones prevent promiscuous histone interactions before chromatin assembly. They guarantee faithful deposition of canonical histones and functionally specialized histone variants into chromatin in a spatial- and temporally-restricted manner. Here, we identify the binding partners of the primate-specific and H3.3-related histone variant H3.Y using several quantitative mass spectrometry approaches, and biochemical and cell biological assays. We find the HIRA, but not the DAXX/ATRX, complex to recognize H3.Y, explaining its presence in transcriptionally active euchromatic regions. Accordingly, H3.Y nucleosomes are enriched in the transcription-promoting FACT complex and depleted of repressive post-translational histone modifications. H3.Y mutational gain-of-function screens reveal an unexpected combinatorial amino acid sequence requirement for histone H3.3 interaction with DAXX but not HIRA, and for H3.3 recruitment to PML nuclear bodies. We demonstrate the importance and necessity of specific H3.3 core and C-terminal amino acids in discriminating between distinct chaperone complexes. Further, chromatin immunoprecipitation sequencing experiments reveal that in contrast to euchromatic HIRA-dependent deposition sites, human DAXX/ATRX-dependent regions of histone H3 variant incorporation are enriched in heterochromatic H3K9me3 and simple repeat sequences. These data demonstrate that H3.Y's unique amino acids allow a functional distinction between HIRA and DAXX binding and its consequent deposition into open chromatin.


Figures

Figure 1.
Figure 1.
Identification of human H3 variant chaperone complexes. (A) Amino acid alignment of human H3.1, H3.2, H3.3 and H3.Y proteins using ClustalW Alignment (MacVector 13.5.1). Identical amino acids are depicted in dark gray, similar amino acids in light gray and differences are highlighted with a white background. N- and C-terminal tails are separated by dotted lines and a schematic representation of the secondary structures is shown below the alignment. The known chaperone recognition sites of H3.1, H3.2 and H3.3 are boxed. (B–D) eGFP-pull-downs for H3 variant-specific chaperone complexes are shown. HK cells stably expressing eGFP-H3.2 (B), eGFP-H3.3 (C) and eGFP-H3.Y (D) were SILAC labeled and subjected to single-step affinity purification of soluble nuclear proteins using GFP nanotrap beads. In each panel, the ratio between pull-down of the transfected cell line and a control cell line for all identified proteins after MS is plotted. Proteins known to interact with H3 variants are indicated. Background binders and potential contaminants are shown as black dots and are listed together with all identified proteins in Supplementary Tables S1–3.
Figure 2.
Figure 2.
H3.Y prevents DAXX binding and PML body recruitment. (A) Soluble nuclear extracts from HK cells stably expressing eGFP, eGFP-H3.1, eGFP-H3.3 and eGFP-H3.Y were used for pull-down experiments as described in Figure 1B–D followed by immunoblotting with α-DAXX and α-GFP antibodies. Nb = non-bound fraction after precipitation, IP = immunopreciptated material. (B) Immunolocalization microscopy analysis of PML, H3.3-GFP and eGFP-H3.Y in transiently transfected human primary mesenchymal stem cells. GFP: eGFP-tagged H3 variant (green); PML: α-PML antibody (red). (C) Percentage of cells (n > 100) shown in (B) exhibiting H3.3-GFP or eGFP-H3.Y PML-NB localization (gray) or not (black).
Figure 3.
Figure 3.
H3.3-containing, H3.Y-reduced sites are enriched in H3K9me3 and simple repeat sequences. (A) Annotation of H3.3-, H3.Y- and H3K4me3-enriched regions as determined by ChIP-seq in comparison to the total genome. Data for H3K4me3 is from ENCODE consortium. (B) Venn diagram of H3.3, H3.Y and H3K4me3 peaks (depicted are numbers of peaks). (C) ChIP-seq density heat map for peaks identified in H3.3 replicate 1 and correlated to second H3.3 replicate, as well as both H3.Y replicates and H3K9me3. Data for H3K9me3 is from (64) (GEO repository sample GSM2308949 (GSE86811)). Color intensity represents normalized and globally scaled tag counts. (D) Genome browser snap shot of a representative region in chromosome 16 displaying eGFP control (gray), two H3.3 replicates (blue), two H3.Y replicates (green), H3K4me3 (black) and H3K9me3 (red) ChIP-seq signals. Blue bars depict assigned peaks using MACS 2 peak calling method. Annotated gene structures are shown above. Highlighted are H3.3/H3.Y-shared (right) and H3.3-enriched, H3.Y-reduced (left) sites. (E) Density heat map for peaks representing H3.3-enriched, H3.Y-reduced sites correlated to H3K9me3. Color intensity represents normalized and globally scaled tag counts. (F) Box plot of H3K9me3 signal intensity comparing all H3.3-enriched peaks with H3.Y-reduced peaks. RPK: reads per kilobase. (G) De novo motif search results with H3.3-containing, H3.Y-reduced sites using MEME (http://meme-suite.org/tools/meme; (65)), see also Supplementary Figure S1 for hierarchical clustering of top 50 repeat sequences.
Figure 4.
Figure 4.
H3.Y-containing nucleosomes are enriched with FACT complex and reduced in repressive H3K9me3. (A–D) Identification of proteins enriched on eGFP-H3.1-, eGFP-H3.2-, eGFP-H3.3- or eGFP-H3.Y-mononucleosomes (see Supplementary Figure S2A) derived from HK cells after eGFP normalization (see Supplementary Figure S2B–D). Pull-downs of mononucleosomes containing H3.1 versus H3.2 (A), H3.1 versus H3.3 (B), H3.1 versus H3.Y (C) and H3.3 versus H3.Y (D) are displayed in volcano plots by plotting P-values and t-test differences obtained from two-sample t-test. Significantly enriched proteins are determined using a permutation-based FDR cutoff and labeled. All identified proteins are listed in Supplementary Tables S5–9. (E) Log2-fold changes of interacting proteins of mononucleosome-IPs (A–D) visualized in a heatmap. (F) Immunoblots of eGFP-H3 variant pulldowns using mononucleosomes derived from HK cells using α-GFP and α-H3K9me3 antibodies. nb, non-bound fraction after precipitation, IP, immunopreciptated material.
Figure 5.
Figure 5.
H3.3 core region in combination with C-terminal sequence is sufficient for DAXX interaction. (A and B) Top: schematical alignment of H3.3, H3.Y and H3.Y core (A) and H3.3/H3.Y ‘tail-swap’ (B) mutant proteins. H3.3-specific amino acids are highlighted in blue, whereas H3.Y-unique residues are depicted in green boxes. Shared chaperone recognition sequence is shown in purple. Bottom: soluble nuclear extracts from HK cells stably expressing eGFP-tagged H3 variants as well as H3.YQ59E and H3.Y core (A) or H3.Y/H3.3 ‘tail-swap’ mutants (B) were used for pull-down experiments as described in Figure 2A. One out of at least two representative immunoblots is shown. Proper nuclear and chromatin localization of all eGFP-H3 variants and H3.Y core mutants is shown in Supplementary Figures S3 and 4 and of chimeric constructs in Supplementary Figure S5A and B. (C) Quantification of 200 cells 24 h after transfection (see Supplementary Figure S5C for IF analysis) showing the localization of different eGFP-H3.3/H3.Y ‘tail-swap’ mutants to PML-NBs (gray) or not (black).
Figure 6.
Figure 6.
DAXX interaction is repelled by H3.Y's unique leucine at position 46. (A and C) Top: schematical alignment as seen in Figure 5A and B showing H3.Y C-terminal tail (A) or H3.3 core (C) mutant proteins. Bottom: soluble nuclear extracts from HK cells stably expressing eGFP-tagged H3.Y C-terminal tail (A) or H3.3 core (C) mutants were used for pull-down experiments as described in Figure 2A. One of at least two representative immunoblots is shown. Expression levels and proper nuclear and chromatin localization of all eGFP-H3.Y C-terminal mutants is shown in Supplementary Figure S6 and of H3.3 core mutants constructs in Supplementary Figure S7. (B) PML-NB localization quantification of different eGFP-H3.3 core mutants as described in Figure 5C.
Figure 7.
Figure 7.
Restoration of DAXX binding to H3.Y mutants enables deposition at heterochromatin sites. (A) ChIP-seq density heat map of H3.3 as described in Figure 3C listing H3.3/H3.Y ‘tail-swap’ and H3.Y L46V K53R L62I core C3 mutant signals. Data for H3K9me3 is from (64) (GEO repository sample GSM2308949 (GSE86811)). Color intensity represents normalized and globally scaled tag counts. (B) Genome browser snap shot of representative region displaying ‘tail-swap’ and H3.Y L46V K53R L62I core C3 mutant protein (turquoise) ChIP-seq signals at H3.3-enriched, H3.Y-reduced heterochromatin sites (see Figure 3D). (C) Box plot of peak signal intensities of H3.3/H3.Y ‘tail-swap’ and H3.Y L46V K53R L62I core C3 mutant signals comparing all H3.3-enriched sites with H3.Y-reduced sites. Shown are mean signal intensities of two H3.3 and H3.Y replicates. Testing for statistical significance of observed differences was done using Wilcoxon-signed-rank test (Supplementary Table S10).

Similar articles

Cited by

References

    1. van Holde K.E. Chromatin. 1988; NY: Springer.
    1. Luger K., Mader A.W., Richmond R.K., Sargent D.F., Richmond T.J.. Crystal structure of the nucleosome core particle at 2.8 A resolution. Nature. 1997; 389:251–260. - PubMed
    1. Bonisch C., Nieratschker S.M., Orfanos N.K., Hake S.B.. Chromatin proteomics and epigenetic regulatory circuits. Expert Rev. Proteomics. 2008; 5:105–119. - PubMed
    1. Burgess R.J., Zhang Z.. Histone chaperones in nucleosome assembly and human disease. Nat. Struct. Mol. Biol. 2013; 20:14–22. - PMC - PubMed
    1. Hake S.B., Garcia B.A., Duncan E.M., Kauer M., Dellaire G., Shabanowitz J., Bazett-Jones D.P., Allis C.D., Hunt D.F.. Expression patterns and post-translational modifications associated with mammalian histone H3 variants. J. Biol. Chem. 2006; 281:559–568. - PubMed

MeSH terms