. 2017 Jun 20;45(11):e99.
doi: 10.1093/nar/gkx177.

Predicting the impact of non-coding variants on DNA methylation

Affiliations

Predicting the impact of non-coding variants on DNA methylation

Haoyang Zeng et al. Nucleic Acids Res. .

Abstract

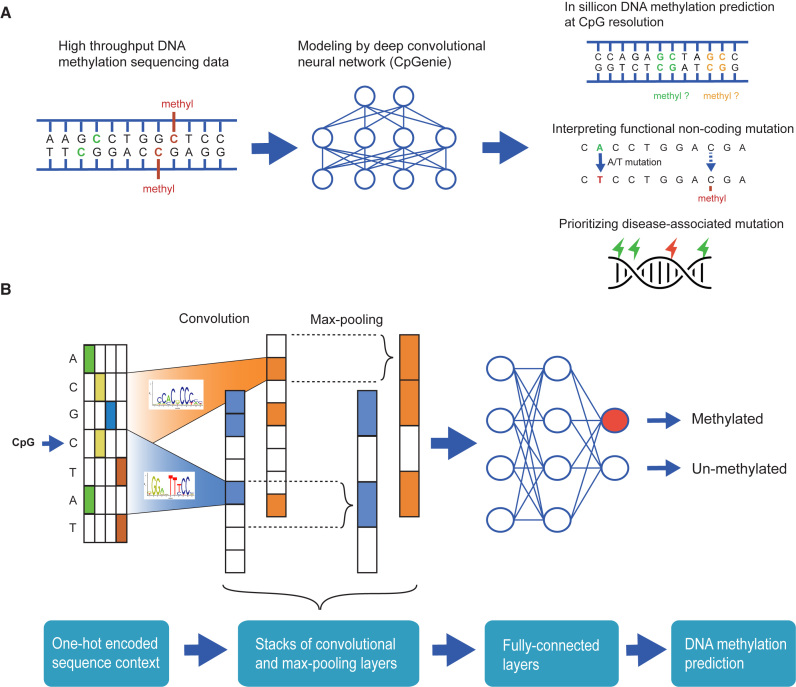
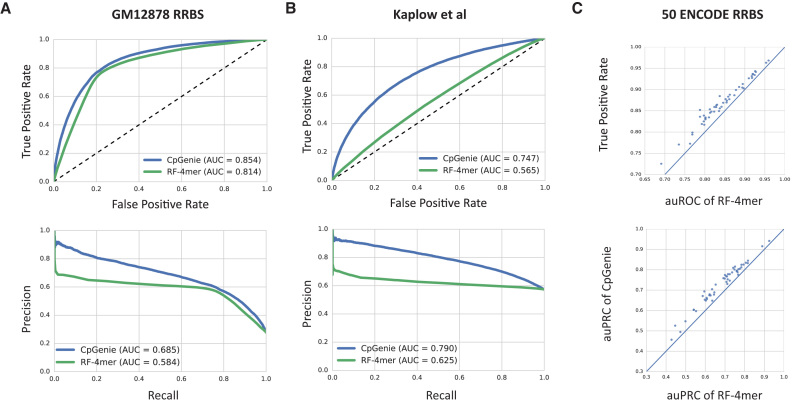
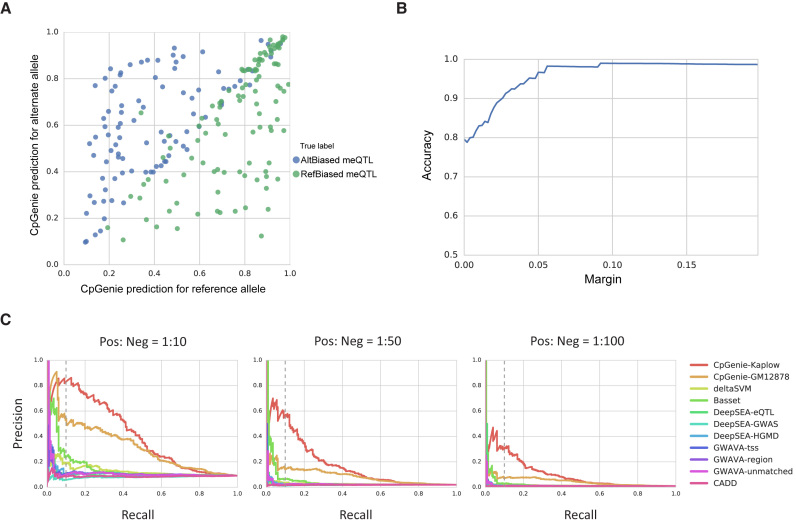
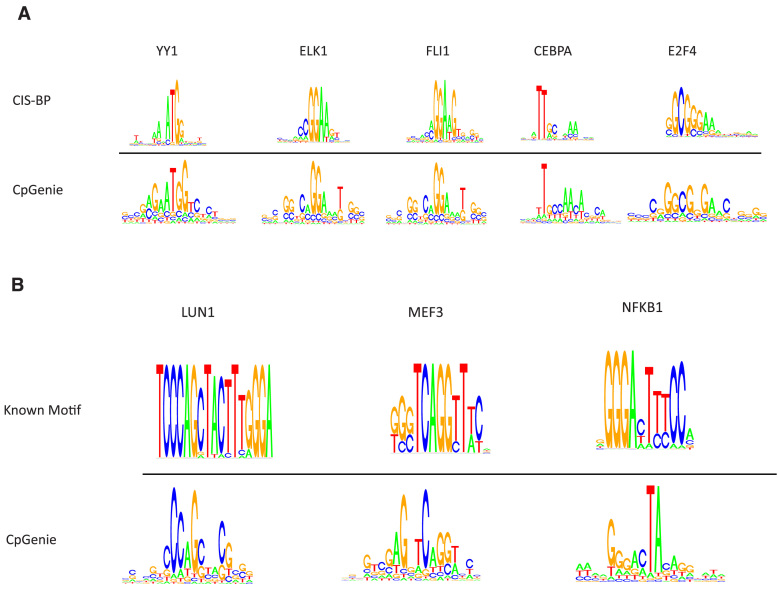
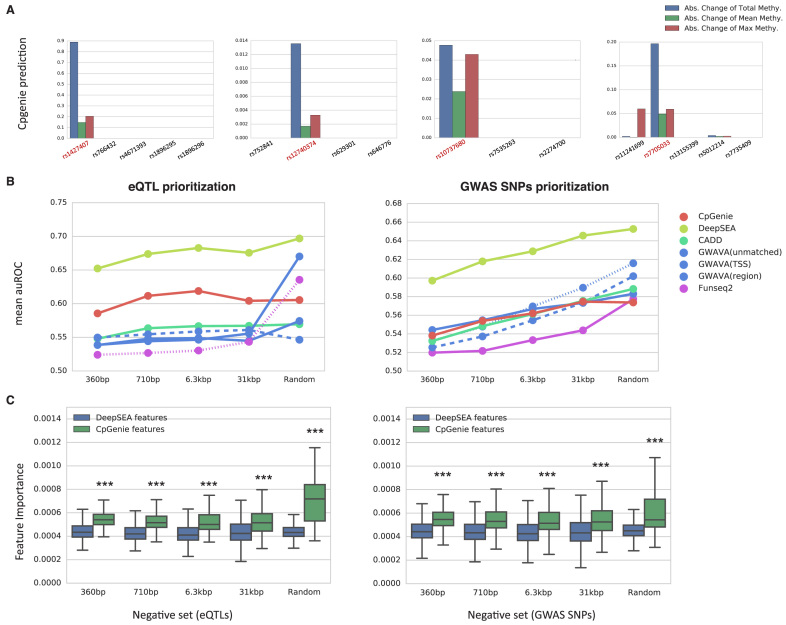
DNA methylation plays a crucial role in the establishment of tissue-specific gene expression and the regulation of key biological processes. However, our present inability to predict the effect of genome sequence variation on DNA methylation precludes a comprehensive assessment of the consequences of non-coding variation. We introduce CpGenie, a sequence-based framework that learns a regulatory code of DNA methylation using a deep convolutional neural network and uses this network to predict the impact of sequence variation on proximal CpG site DNA methylation. CpGenie produces allele-specific DNA methylation prediction with single-nucleotide sensitivity that enables accurate prediction of methylation quantitative trait loci (meQTL). We demonstrate that CpGenie prioritizes validated GWAS SNPs, and contributes to the prediction of functional non-coding variants, including expression quantitative trait loci (eQTL) and disease-associated mutations. CpGenie is publicly available to assist in identifying and interpreting regulatory non-coding variants.


Figures

Figure 1.
Figure 1.
Schematics of CpGenie. (A) CpGenie takes the high-throughput DNA methylation sequencing data, such as restricted representation bisulfite sequencing (RRBS) or whole-genome bisulfite sequencing (WGBS) as input and produces predictions of CpG methylation as output. CpGenie can predict DNA methylation at CpG resolution, interpreting the functional consequence of non-coding sequence variants, and prioritizing causal mutations from GWAS-determined associations. (B) CpGenie converts the sequence context around a CpG into one-hot encoding, and transforms it to higher-level features through three pairs of convolutional and max-pooling layers. Two fully-connected layers follow to make predictions on the methylation status of the queried CpG.
Figure 2.
Figure 2.
CpGenie predicts DNA methylation at CpG resolution. (A, B) The receiver operating characteristic (ROC) curve (top) and precision-recall (PRC) curve (bottom) of CpGenie (blue) and random forest using 4-mer counts (green) for predicting DNA methylation status of held-out CpGs in GM12878 RRBS data (A) and bisulfite sequencing data from LCLs derived from 60 Yoruban HapMap individuals (B). (C) Pairwise auROC (top) and auPRC (bottom) comparison of CpGenie (y-axis) and random forest using 4-mer counts (x-axis) on 50 RRBS datasets from ENCODE.
Figure 3.
Figure 3.
CpGenie accurately predicts the direction of allele-specific (AS) DNA methylation and prioritizes variants that modulate DNA methylation (meQTLs). (A) CpGenie's DNA methylation prediction for the reference and alternate alleles of 201 meQTLs on held-out chromosome 11 and 12. The x and y axes represent the CpGenie predicted DNA methylation level. The green and blue dots represent reference allele-biased and alternate allele-biased variants respectively as experimentally determined by Kaplow et al. (B) Prediction accuracy quickly and steadily increased to 100% when only the high-confidence predictions were retained. The y-axis denotes accuracy and the x-axis represents margin, or the threshold of predicted absolute allelic difference in methylation to retain high-confidence predictions. (C) The precision-recall curve (PRC) for classifying the 201 meQTL from three different random subsets of the 76 532 non-meQTL that are 10 times (left), 50 times (middle), and 100 times (right) the size of meQTL. CpGenie outperformed all the state-of-the-art methods in functional variant prioritization with better precision at the 10% recall and higher area under precision–recall curve.
Figure 4.
Figure 4.
CpGenie learns motifs of regulatory elements involved in DNA methylation. (A) 97 out of 128 of the convolutional filters match motifs of known transcription factors in the human CIS-BP database at an FDR threshold of 0.1. (B) Examples of convolutional kernels characterizing partial information of transcription factors known for involvement in or predictive for DNA methylation. The logos for LUN1 and MEF3 were generated from motif information in TransFac databse (January 2013) and the logo for NFKB1 was generated from motif information in CIS-BP database.
Figure 5.
Figure 5.
CpGenie's sequence-based DNA methylation predictions assist in downstream analysis of functional variants. (A) CpGenie scored the validated GWAS SNPs (red) higher than the SNPs in strong linkage disequilibrium. The three statistics generated from CpGenie are colored in blue (the absolute change of total methylation of proximal CpG sites), green (the absolute change of mean methylation of proximal CpG sites) and red (the absolute change of maximum methylation of proximal CpG sites). (B) Compared to previous methods that utilize more annotation information, CpGenie achieved better or comparable performance in prioritizing noncoding GRASP eQTLs (left) and noncoding GWAS Catalog SNPs (right) against noncoding 1000 Genome Project SNPs. The x-axis denotes the mean distance of the SNPs in the negative set to the paired positive SNP. The ‘Random’ group denotes 1 000 000 randomly sampled 1000 Genome Project SNPs. (C) CpGenie's DNA methylation features (green) were considered significantly more important in general than DeepSEA's functional predictions on histone modification, transcription factor binding and DNase hypersensitivity (blue) in eQTL (left) and GWAS SNPs (right) prioritization. The asterisks denote statistical significance calculated from Mann–Whitney U test (P-value < 0.001).

References

    1. Hindorff L.A., Sethupathy P., Junkins H.A., Ramos E.M., Mehta J.P., Collins F.S., Manolio T.A.. Potential etiologic and functional implications of genome-wide association loci for human diseases and traits. Proc. Natl. Acad. Sci. U.S.A. 2009; 106:9362–9367. - PMC - PubMed
    1. Maurano M.T., Humbert R., Rynes E., Thurman R.E., Haugen E., Wang H., Reynolds A.P., Sandstrom R., Qu H., Brody J. et al. Systematic localization of common disease-associated variation in regulatory DNA. Science. 2012; 337:1190–1195. - PMC - PubMed
    1. Gusev A., Lee S.H., Trynka G., Finucane H., Vilhjálmsson B.J., Xu H., Zang C., Ripke S., Bulik-Sullivan B., Stahl E. et al. Partitioning heritability of regulatory and cell-type-specific variants across 11 common diseases. Am. J. Hum. Genet. 2014; 95:535–552. - PMC - PubMed
    1. Kircher M., Witten D.M., Jain P., O’Roak B.J., Cooper G.M., Shendure J.. A general framework for estimating the relative pathogenicity of human genetic variants. Nat. Genet. 2014; 46:310. - PMC - PubMed
    1. Ritchie G.R., Dunham I., Zeggini E., Flicek P.. Functional annotation of noncoding sequence variants. Nat. Methods. 2014; 11:294–296. - PMC - PubMed

Substances

LinkOut - more resources