. 2017 Apr 1;140(4):1068-1085.
doi: 10.1093/brain/awx021.

Decreased integration and information capacity in stroke measured by whole brain models of resting state activity

Affiliations

Decreased integration and information capacity in stroke measured by whole brain models of resting state activity

Mohit H Adhikari et al. Brain. .

Abstract

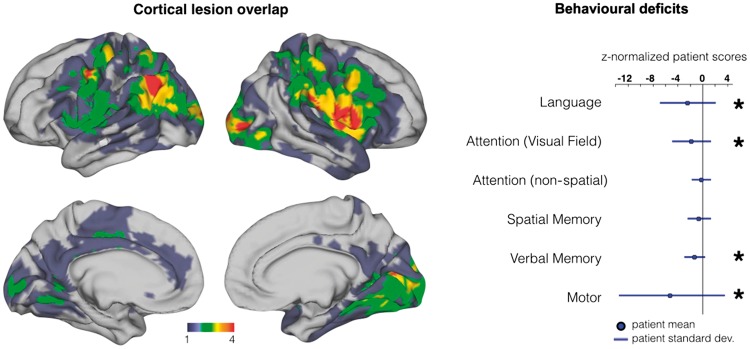
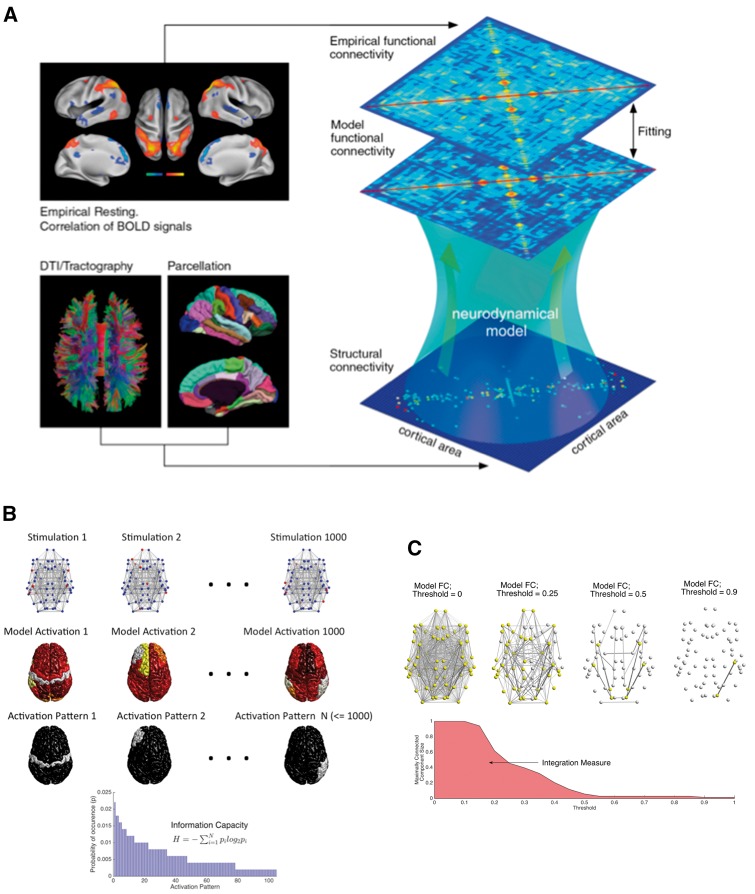
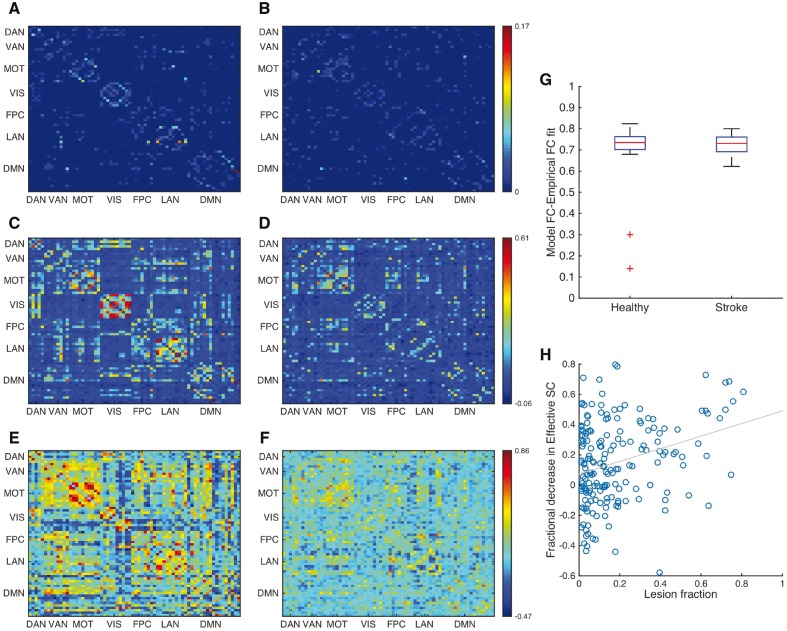
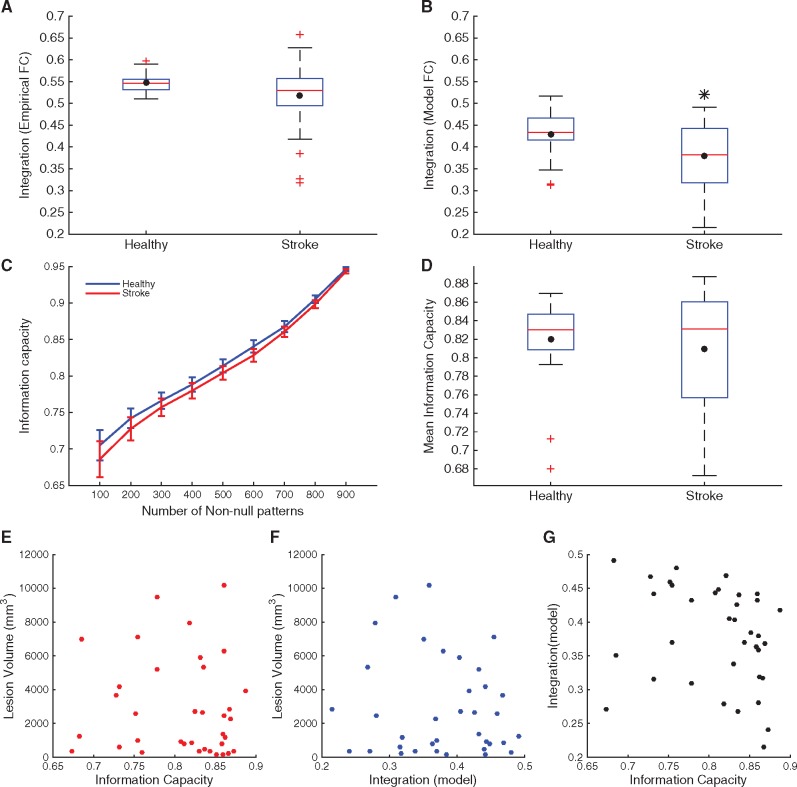
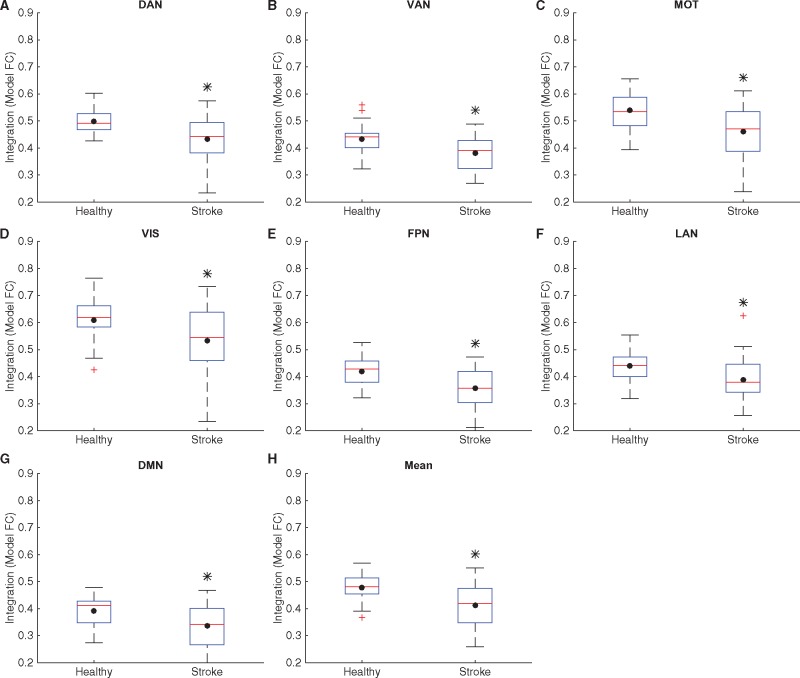
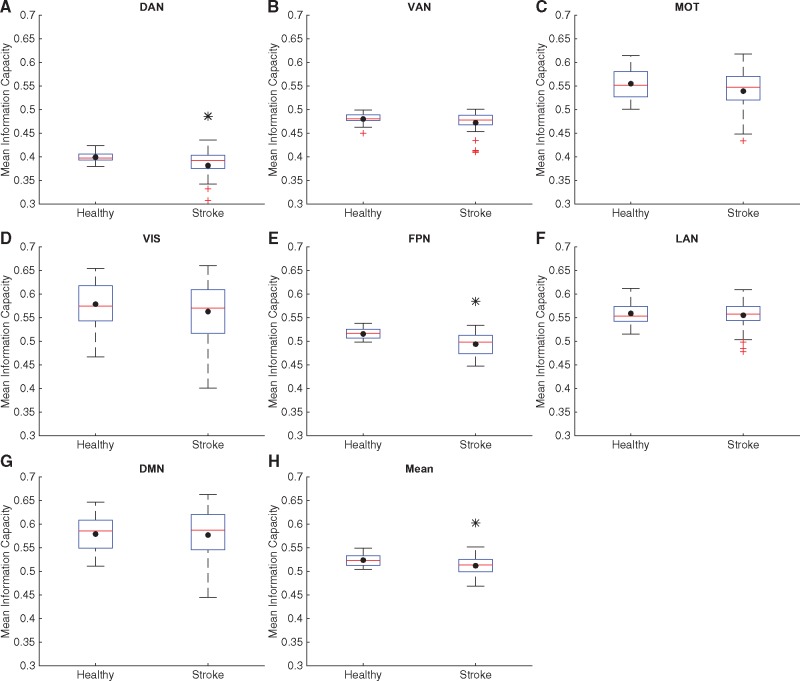
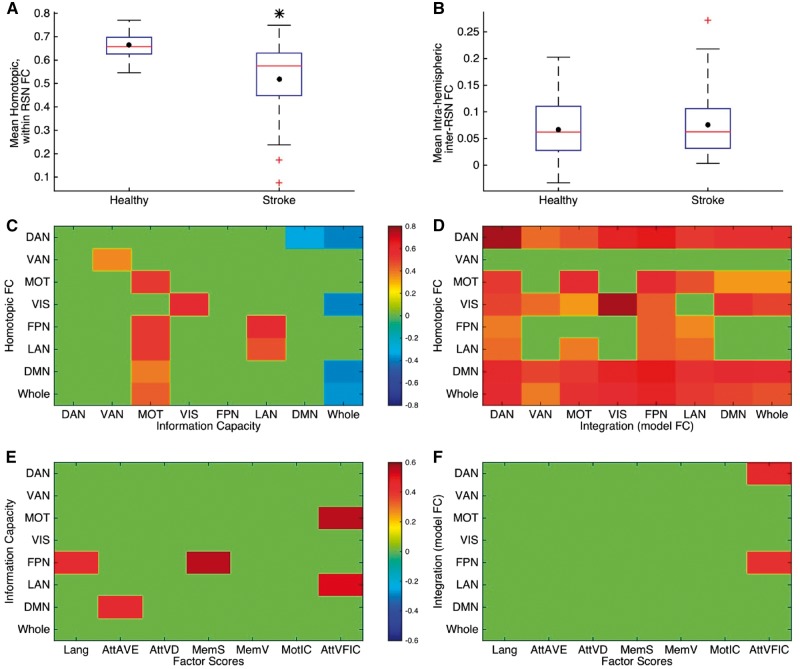
While several studies have shown that focal lesions affect the communication between structurally normal regions of the brain, and that these changes may correlate with behavioural deficits, their impact on brain's information processing capacity is currently unknown. Here we test the hypothesis that focal lesions decrease the brain's information processing capacity, of which changes in functional connectivity may be a measurable correlate. To measure processing capacity, we turned to whole brain computational modelling to estimate the integration and segregation of information in brain networks. First, we measured functional connectivity between different brain areas with resting state functional magnetic resonance imaging in healthy subjects (n = 26), and subjects who had suffered a cortical stroke (n = 36). We then used a whole-brain network model that coupled average excitatory activities of local regions via anatomical connectivity. Model parameters were optimized in each healthy or stroke participant to maximize correlation between model and empirical functional connectivity, so that the model's effective connectivity was a veridical representation of healthy or lesioned brain networks. Subsequently, we calculated two model-based measures: 'integration', a graph theoretical measure obtained from functional connectivity, which measures the connectedness of brain networks, and 'information capacity', an information theoretical measure that cannot be obtained empirically, representative of the segregative ability of brain networks to encode distinct stimuli. We found that both measures were decreased in stroke patients, as compared to healthy controls, particularly at the level of resting-state networks. Furthermore, we found that these measures, especially information capacity, correlate with measures of behavioural impairment and the segregation of resting-state networks empirically measured. This study shows that focal lesions affect the brain's ability to represent stimuli and task states, and that information capacity measured through whole brain models is a theory-driven measure of processing capacity that could be used as a biomarker of injury for outcome prediction or target for rehabilitation intervention.

Keywords: functional connectivity; information capacity; integration; whole-brain modelling.


Figures

Figure 1
Figure 1
Lesion and behavioural data.Left: Surface lesion conjunction map for 36 cortical stroke patients. Right: Deficit in six behavioural domains for patients (n = 36) relative to age-matched controls (n = 26). In each behavioural domain, a single factor score was determined for each patient and control based on multiple behavioural tests. Scores are z-normalized based on aged-matched controls (control mean = 0 and SD = 1). Domains in which the patients differ significantly from controls are indicated with an asterisk (P < 0.05 after correction for six comparisons).
Figure 2
Figure 2
Methodology and description of measures. (A) General methodology used in this study (from Deco et al., 2014b). The empirical functional connectivity is obtained as correlations between BOLD signals from 68 brain areas for each healthy subject and for each subject with stroke. The model functional connectivity is found by simulating a network model consisting of a mathematical model for each brain area and an effective connectivity between brain areas. (B and C) Procedures to calculate the computational measures used in this study. (B) For information capacity, we applied an external stimulus to 10% of the network nodes (in red, top) chosen randomly and simulate the model using the effective connectivity matrix for each subject to obtain simulated BOLD activations (middle) of all brain areas. Subsequently, we apply a threshold to obtain a binary activation pattern (bottom) and repeat the process 1000 times. The information capacity is an entropy measure based on the frequency of occurrence of distinct, non-zero activation patterns. (C) The integration measure is obtained by finding the largest connected component (in yellow) from the optimized model functional connectivity (FC) at varying thresholds and by integrating its size over the range of thresholds.
Figure 3
Figure 3
Model functional connectivities from effective connectivity. (A and B) Effective connectivities calculated using the network model and the empirical functional connectivity (FC) for a single healthy subject (A) and that of a subject with stroke (B). (C and D) Optimized model functional connectivities for the healthy subject (C) and that of the subject with stroke (D). (E and F) Empirical functional connectivity for the healthy subject (E) and that of the subject with stroke (F). Each matrix is ordered according to the parcels assigned to different RSNs. Reduced within-RSN connectivity in the case of stroke is observed in empirical functional connectivity of stroke subject in comparison with the healthy case, and is captured by the effective connectivity and the corresponding model functional connectivity. (G) Box plot of optimum correlation between model functional connectivity and empirical functional connectivity for all healthy subjects and stroke patients. Barring two healthy subjects, which are not considered for further analysis, the effective connectivity yields a median correlation of ∼0.75 for both groups. (H) The lesion fraction (measured in terms of fraction of vertices damaged) of lesioned brain areas from all subjects displays significant correlation with the corresponding decrease in their effective connectivity (r = 0.3, P = 4 × 10⁻⁶). MOT = motor network; SC = structural connectivity; VIS = visual network.
Figure 4
Figure 4
Integration and information capacity in controls and stroke. (A and B) Box plot of integration values calculated using the empirical functional connectivities (A) and model functional connectivities (B) of all healthy subjects and stroke patients. (C) Mean information capacity (± standard error of the mean), averaged across healthy control subjects (blue) and stroke subjects (red) for nine different numbers of non-null patterns (i.e. the activity of at least one brain area is above a threshold). For this comparison, we determine the threshold for each subject to obtain identical number of non-null patterns which are used to calculate the entropy for each subject. (D) Box plot of information capacity, averaged across values for nine different numbers of non-null patterns, of all healthy subjects and stroke patients. The black dot in each box plot indicates the mean while the red line indicates the median. The black asterisk indicates a significant difference in the group averages (P < 0.05, unpaired t-test). (E and F) Lack of correlation between values of total lesion volume and information capacity (E) and model integration (F) demonstrate that the values for these two measures are not a direct consequence of total structural damage. (G) Lack of correlation between values of information capacity and model integration.
Figure 5
Figure 5
Integration in controls and stroke at the level of RSNs. Box plots of values of integration for all healthy subjects and stroke patients, calculated within each RSN: DAN (A), VAN (B), motor network (MOT, C), visual network (VIS, D), FPN (E), LAN (F) and DMN (G) and averaged across RSNs (H). The black dot in each box plot indicates the mean while the red line indicates the median. The black asterisk indicates a significant difference in the group averages (P < 0.05, unpaired t-test, corrected for multiple comparisons using Benjamini-Hochberg procedure for controlling false discovery rate). Mean integration is significantly decreased in case of stroke subjects for all RSNs as well as when averaged across RSNs.
Figure 6
Figure 6
Information capacity in controls and stroke at the level of RSNs. Box plots of values of information capacity for all healthy subjects and stroke patients, calculated within each RSN: DAN (A), VAN (B), motor network (MOT, C), visual network (VIS, D), FPN (E), LAN (F) and DMN (G) and averaged across RSNs (H). Here, information capacity is calculated using 500 non-null patterns. The black dot in each box plot indicates the mean while the red line indicates the median. The black asterisk indicates a significant difference in the group averages (P < 0.05, unpaired t-test, corrected for multiple comparisons using Benjamini-Hochberg procedure for controlling false discovery rate). Mean information capacity is significantly decreased in case of stroke subjects for five RSNs as well as when averaged across all RSNs.
Figure 7
Figure 7
Relationship between computational measures and functional connectivity-based and behavioural measures. (A and B) Box plots of values of (A) average functional connectivity (FC) between all homotopic areas within each RSN, averaged across RSNs and (B) average inter-RSN [between DAN, VAN, motor network (MOT), visual network (VIS) and DMN, FPN, LAN], intrahemispheric (ipsilesional hemisphere for stroke participants) functional connectivity. The black dot in each box plot indicates the mean while the red line indicates the median. The black asterisk indicates a significant difference in the group averages (here, P = 0.001, unpaired t-test). (C and D) Correlation between values of information capacity (C) and model integration (D) for stroke participants with the corresponding average interhemispheric functional connectivity between homotopic areas within each RSN and for the whole brain network. Here all non-zero values are the only correlations which were found to be significant (P < 0.05, calculated using a permutation test, not corrected for multiple comparisons). When corrected for multiple comparisons using Benjamini-Hochberg procedure for controlling false discovery rate, homotopic functional connectivity within most RSNs except the VAN correlates significantly at 0.05 level with the corresponding model integration while homotopic functional connectivity in motor, FPN and LAN is found to display significant correlation with motor information capacity values. (E and F) Correlation between values of information capacity (E) and model integration (F) within each RSN and for the whole brain network with behavioural factor scores obtained from within domain factor analyses for all participants with stroke. Here all non-zero values are the only correlations which were found to be significant (P < 0.05, calculated using a permutation test, not corrected for multiple comparisons).

Comment in

References

    1. Adhikari MH, Raja Beharelle A, Griffa A, Hagmann P, Solodkin A, McIntosh AR. et al. Computational modeling of resting-state activity demonstrates markers of normalcy in children with prenatal or perinatal stroke. J Neurosci Off J Soc Neurosci 2015; 35: 8914–24. - PMC - PubMed
    1. Alstott J, Breakspear M, Hagmann P, Cammoun L, Sporns O. Modeling the impact of lesions in the human brain. PLoS Comput Biol 2009; 5: e1000408. - PMC - PubMed
    1. Andrew James G, Lu Z-L, VanMeter JW, Sathian K, Hu XP, Butler AJ. Changes in resting state effective connectivity in the motor network following rehabilitation of upper extremity poststroke paresis. Top Stroke Rehabil 2009; 16: 270–81. - PMC - PubMed
    1. Baldassarre A, Ramsey L, Hacker CL, Callejas A, Astafiev SV, Metcalf NV. et al. Large-scale changes in network interactions as a physiological signature of spatial neglect. Brain 2014; 137: 3267–83. - PMC - PubMed
    1. Benjamini Y, Hochberg Y. Controlling the false discovery rate: a practical and powerful approach to multiple testing. J R Stat Soc Ser B Methodol 1995; 57: 289–300.

MeSH terms