. 2017 May 5;45(8):4590-4605.
doi: 10.1093/nar/gkx126.

RAD51 interconnects between DNA replication, DNA repair and immunity

Affiliations

RAD51 interconnects between DNA replication, DNA repair and immunity

Souparno Bhattacharya et al. Nucleic Acids Res. .

Abstract

RAD51, a multifunctional protein, plays a central role in DNA replication and homologous recombination repair, and is known to be involved in cancer development. We identified a novel role for RAD51 in innate immune response signaling. Defects in RAD51 lead to the accumulation of self-DNA in the cytoplasm, triggering a STING-mediated innate immune response after replication stress and DNA damage. In the absence of RAD51, the unprotected newly replicated genome is degraded by the exonuclease activity of MRE11, and the fragmented nascent DNA accumulates in the cytosol, initiating an innate immune response. Our data suggest that in addition to playing roles in homologous recombination-mediated DNA double-strand break repair and replication fork processing, RAD51 is also implicated in the suppression of innate immunity. Thus, our study reveals a previously uncharacterized role of RAD51 in initiating immune signaling, placing it at the hub of new interconnections between DNA replication, DNA repair, and immunity.


Figures

Figure 1.
Figure 1.
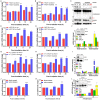
Depletion of RAD51 up-regulates innate immune response pathway genes. (A) shRNA-mediated depletion of RAD51 expression in HT1080 cells: HT1080 cells stably integrating tetracycline-inducible Rad51 shRNA were treated with 1 μg/ml doxycycline (DOX) for 72 h. Subsequently, cells were exposed to 1 Gy of radiation (IR), collected at pre-established time points after irradiation. Total cell lysates (50 μg) were separated on 8% SDS-PAGE and probed with anti-RAD51 and anti-Ku80 (loading control) antibodies. U- without DOX treatment. (B) Heat map of significantly altered innate immune response pathway genes in RAD51-proficient and -depleted cells 4 and 8 h after irradiation. (C) Graph shows fold changes in gene expression in irradiated (8 h) cells normalized to gene expression values in corresponding mock-treated cells. Exponentially growing RAD51-proficient and -depleted HT1080 cells were either mock-treated or irradiated with 1 Gy. Total RNA was prepared at indicated times after irradiation and analyzed for gene expression profiling using Human HT12v4 Arrays. The heat map for innate immune response network genes was generated with gene subsets created from the list of significant innate immune response genes using Spotfire Decision Site 9. (D–I) Differences in expression levels of innate immune response pathway genes measured by quantitative real-time polymerase chain reaction (qRT-PCR): RAD51-proficient and -depleted HT1080 cells were irradiated (IR) with 1 Gy and total RNA was prepared 8 h after irradiation. mRNAs were converted into cDNA and the levels of IL-6 (D), CSF2 (E), CXCR4 (F), TNF-α (G), CMKLR1 (H) and TLR9 (I) mRNA were quantified by qRT-PCR. Error bars represent the SEM from three independent experiments; *P < 0.05; **P < 0.01.
Figure 2.
Figure 2.
Excessive DNA accumulates in the cytosol of RAD51-depleted cells. (A and B) Quantification of single-strand (ssDNA) and double-strand (dsDNA) DNA in the cytosol (cyto): RAD51-proficient and -depleted HT1080 cells were irradiated with 2 Gy and were harvested at the indicated times. Subsequently, cells underwent sub-cellular fractionation and the amount of cytosolic ssDNA (A) and dsDNA (B) were quantified using OliGreen and PicoGreen Quant-iT reagents, respectively. Bars represent fold changes in the cytoplasmic DNA concentration relative to RAD51-proficient mock-treated samples. Error bars represent the SEM from four independent experiments; **P < 0.01; ***P < 0.001; ****P < 0.0001. (C) Western blots show lack of apoptosis-mediated cleavage of CASPASE-3 and PARP-1 in RAD51-proficient and –depleted HT1080 cells following irradiation: RAD51-proficient and -depleted HT1080 cells were exposed to 2 Gy of radiation and cells were harvested at indicated time points after irradiation. Total cell lysates (50–100 μg) were separated on 8–15% SDS-PAGE and probed with anti-CASPASE-3, anti-PARP1, and anti-Ku80 (loading control) antibodies. RAD51-depleted HT1080 cells treated with 1 μM camptothecin (CPT) for 18 h was used as a positive control for apoptosis. M-mock-irradiated; arrows indicate cleaved CASPASE-3/PARP-1. (D–L) Accumulation of ssDNA and dsDNA in the cytoplasm, and expression of innate immune response genes in RAD51-proficient and –depleted MCF10A (D-F), 4T1 (G–I) and HT1080+SAHA cells (J–L). The bars represent the fold changes in the cytoplasmic DNA concentration and immune response genes relative to respective mock-treated controls. Cells were either mock- or exposed to 2 Gy of radiation (IR), cytosolic fraction and total RNA was prepared at 8 (MCF10A), 16 (HT1080+SAHA) and 24 (4T1) h after irradiation, and ssDNA, dsDNA and the levels of innate immune response genes were quantified as described in materials and methods. Error bars represent the STDEV from four different experiments from two independent sets; *P < 0.05; **P < 0.01; ***P < 0.001; ****P < 0.0001. SAHA-suberoylanilide hydroxamic acid; U- without SAHA treatment.
Figure 3.
Figure 3.
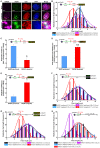
Accumulation of nuclear-derived DNA in the cytosol activates STING in RAD51-depleted cells. (A and B) Representative images show accumulation of nuclear-derived DNA in the cytoplasm of mock- and irradiated (IR) G1 and S/G2 phase RAD51-proficient and -depleted cells (A). Graph shows quantification of the cell cycle-dependent cytoplasmic BrdU signal normalized to mock-treated RAD51-proficient samples (B). RAD51-proficient and -depleted HT1080-FUCCI cells were labeled with BrdU for 18–20 h, irradiated with 2 Gy and fixed with ice cold 80% methanol in PBS 8 h after irradiation. Cells were immunostained with an anti-BrdU antibody under non-denaturing conditions. Subsequently, cells were imaged using a LSM510 confocal microscope, and the mean fluorescence BrdU signal in the cytoplasm of G1 and S/G2 phase cells was quantified using ZEN 2009 (version 6.0.0303) Software (Carl Zeiss, Jena, Germany). Bars represent mean cytoplasmic BrdU intensity per cell relative to respective control G1 and S/G2 cells. More than 150 cells were used for quantification in each condition. Error bars represent the STDEV from two-four independent experiments; Scale bars are 10 μm; *P < 0.05. (C and D) Representative images show STING clustering in the cytoplasm of mock- and irradiated RAD51-proficient and -depleted cells 8 h after irradiation (C). Quantification of percentage of cells with STING clustering signal relative to the total number of counted cells (D). RAD51-proficient and -depleted HT1080 cells were irradiated with 2 Gy and fixed with 4% PFA at indicated times after irradiation. Subsequently, cells were immunostained with an anti-STING antibody, imaged using a LSM510 confocal microscope; the STING clustering signal in the cytoplasm was quantified using Imaris Software (Bitplane). More than 200 cells were used for quantification in each condition. Error bars represent the STDEV from three independent experiments; Scale bars are 20 μm; **P < 0.01; ***P < 0.001. (E) Representative Western blots show phosphorylation of STING, TBK, and STAT3 in RAD51-proficient and –depleted cells after irradiation. RAD51-proficient and -depleted HT1080 cells were irradiated with 2 Gy radiation and harvested at the indicated times. Total cell lysates (100–150 μg) were separated on 8–10% SDS-PAGE and probed with the indicated antibodies and the anti-Ku80 antibody (loading control).
Figure 4.
Figure 4.
RAD51 blocks the MRE11-mediated degradation of nascent DNA strands upon irradiation. (A) Representative images show the co-localization of RAD51 foci with EdU and γH2AX foci. HT1080 cells were pulse-labeled with EdU for 30 min and immediately irradiated with 1Gy, fixed with 4% PFA 4 h after irradiation, and immunostained with anti-RAD51 and anti-γH2AX antibodies. EdU was detected using the Click-IT reaction. Scale bars are 10 μm. (B) Replication fork progression is reduced in RAD51-depleted cells in response to irradiation. DNA fiber length distributions in RAD51-proficient and -depleted cells are shown before and after irradiation. Cells were labeled with IdU for 30 min, treated with and without 1 Gy radiation, and labeled with CIdU for another 30 min. DNA fibers were immunostained with anti-BrdU (rat and mouse) antibodies. Images were captured using a fluorescence microscope and IdU (before) CldU (after) lengths were measured using Axiovison Software. More than 200 DNA fibers were evaluated in each sample. Each data point is the average of three independent experiments. (C–E) Replication forks stall in RAD51-depleted cells after irradiation. Percentages of replication fork restarts in irradiated RAD51-proficient and -depleted cells relative to mock-treated cells were evaluated using the {(IdU→CldU)/[IdU+(IdU→CldU)] formula (C). Percentage changes in new origin firing in irradiated RAD51-proficient and -depleted cells as compared to mock-treated cells were calculated using the {CldU/[CldU+(IdU→CldU)] formula (D). Percentage changes in replication forks stalling in RAD51-proficient and -depleted cells as compared to mock-irradiated cells were evaluated using the {IdU/[IdU+(IdU→CldU)] formula (E). More than 200 DNA fibers were evaluated in each sample. Each data point is the average of two independent experiments. Error bars represent the STDEV; *P < 0.05; **P < 0.01. (F) Nascent DNA strands were shortened in RAD51-depleted cells. Replicating DNA in RAD51-proficient and -depleted cells was labeled with IdU for 30 min and irradiated with 1 Gy. DNA fibers were immunostained with anti-BrdU (mouse) antibodies. DNA fiber images were captured using a fluorescence microscope, and IdU tract lengths were measured using the Axiovision Software. The frequency distributions of the lengths of more than 100 DNA fibers were calculated from three independent experiments in each group. (G) Newly replicated DNA was shortened in the absence of RAD51. Shortening of newly synthesized DNA fiber length distributions in RAD51-proficient and -depleted cells 5 h after irradiation. Cells were labeled with IdU for 30 min and then with CIdU for another 30 min. Subsequently, cells were irradiated with 1 Gy. Five hours after irradiation, DNA fibers were immunostained with anti-BrdU (rat and mouse) antibodies, images were captured using a fluorescence microscope, and CldU tract lengths were measured using the Axiovison Software. More than 200 DNA fibers were evaluated in each sample. Each data point is the average of three independent experiments. (H) RAD51 blocks the MRE11-mediated degradation of nascent DNA strands in response to irradiation. RAD51-proficient and -depleted cells were labeled with IdU for 30 min. Cells were pre-treated with or without 100 μM of the MRE11 exonuclease inhibitor (mirin), irradiated with 1 Gy. Five hours after irradiation, DNA fibers were immunostained with anti-BrdU (mouse). Images were captured using a fluorescence microscope and ldU tract lengths were measured using the Axiovison Software. More than 100 DNA fibers were evaluated in each sample. Each data point is the average of two independent experiments.
Figure 5.
Figure 5.
Inhibition of MRE11 exonuclease activity blocks the expression of innate immune response genes in RAD51-depleted cells. (A and B) The quantification of ssDNA and dsDNA DNA in the cytosol. RAD51-proficient and -depleted cells were pre-treated with mirin (25 μM), irradiated with 2 Gy and harvested 8 h after irradiation. Subsequently, cells were subjected to sub-cellular fractionation and the amount of cytosolic ssDNA (A) and dsDNA (B) were quantified using OliGreen and PicoGreen Quant-iT reagents, respectively. The bars represent the changes in the cytoplasmic DNA concentration relative to respective mock-treated samples. Error bars represent STDEV from four independent experiments; ***P < 0.001. (C) The quantification of the cytoplasmic BrdU signal normalized to mock-treated RAD51-proficient samples. RAD51-proficient and -depleted HT1080-FUCCI cells were labeled with BrdU for 18–20 h, pre-treated with mirin (25 μM), irradiated with 2 Gy and fixed with ice cold 80% methanol in PBS 8 h after irradiation. Cells were immunostained with an anti-BrdU antibody under non-denaturing conditions. Subsequently, cells were imaged using a LSM510 confocal microscope and the BrdU signal in the cytoplasm of G1 and S/G2 phase cells was quantified using the ZEN 2009 (version 6.0.0303) Software (Carl Zeiss, Jena, Germany). Bars represent mean cytoplasmic BrdU fluorescence intensity per cell relative to respective mirin-treated control G1 and S/G2 cells. More than 150 cells were used for quantification in each condition. Error bars represent the STDEV from two-four independent experiments; *P < 0.05. (D and F) Down-regulation of IL-6, CSF2, and TLR9 expression in cells pre-treated with the MRE11 exonuclease inhibitor. RAD51-proficient and -depleted cells were pre-treated with mirin (25 μM) and irradiated with 1 Gy; total RNA was prepared 8 h after irradiation. mRNAs were converted into cDNA and the levels of IL-6 (D), CSF2 (E) and TLR9 (F) mRNA were quantified by qRT-PCR. Error bars represent the SEM from three-four independent experiments; *P < 0.05; **P < 0.01.
Figure 6.
Figure 6.
RAD51 is critical for DSB repair in S/G2 cells and chromosome stability maintenance. (A–C) DSBs persist in RAD51-depleted S/G2 cells: Representative images show appearance and disappearance of γH2AX foci in G1 (A) and S/G2 (B) cells. Cell cycle-dependent γH2AX foci dissolution kinetics in RAD51-proficient and -depleted HT1080 cells stably expressing two different cell cycle markers, mCherry (G1) and AmCyan (S/G2) (C). Cells were irradiated with 1 Gy and immunostained with anti-γH2AX at the indicated times after irradiation. Cells were imaged using a confocal microscope and γH2AX foci in 100–120 red and Cyan fluorescent cells representing G1 and S/G2 phases, respectively were counted using the Matlab software (Mathworks, MA). Error bars represent the STDEV from three-four independent experiments. Scale bars are 5 μm. (D) RAD51-depleted cells are sensitive to irradiation. RAD51-proficient and -depleted cells plated in six well plates were exposed to 0.5 Gy of radiation with or without mirin treatment and cell survival was analyzed by a colony formation assay. Colonies were fixed and counted 8–10 days after irradiation. The relative survival efficiencies were plotted. The error bars represent the STDEV calculated from triplicate wells; **P < 0.01. (E) RAD51 suppresses chromosome instability upon irradiation. Number of chromatid and chromosome-type aberrations in mock- and -irradiated RAD51-proficient and -depleted cells pre-treated with and without mirin. Exponentially growing cells were either mock-treated or irradiated with 1 Gy, and the metaphase chromosomes spreads were prepared 16 h after treatment. Chromosomal aberrations in >100 metaphase spreads were scored from two to four independent experiments in each group. Error bars represent the STDEV calculated from two-four independent experiments; *P < 0.05. (F) RAD51 interconnects between replication fork processing, DSB repair, and innate immune responses. The model depicts the mechanism of innate immunity initiation in RAD51-depleted cells due to defective replication fork processing and DSB repair.

References

    1. Petermann E., Orta M.L., Issaeva N., Schultz N., Helleday T.. Hydroxyurea-stalled replication forks become progressively inactivated and require two different RAD51-mediated pathways for restart and repair. Mol. Cell. 2010; 37:492–502. - PMC - PubMed
    1. Hashimoto Y., Ray Chaudhuri A., Lopes M., Costanzo V.. Rad51 protects nascent DNA from Mre11-dependent degradation and promotes continuous DNA synthesis. Nat. Struct. Mol. Biol. 2010; 17:1305–1311. - PMC - PubMed
    1. Krishna S., Wagener B.M., Liu H.P., Lo Y.C., Sterk R., Petrini J.H., Nickoloff J.A.. Mre11 and Ku regulation of double-strand break repair by gene conversion and break-induced replication. DNA Repair (Amst.). 2007; 6:797–808. - PMC - PubMed
    1. Su F., Mukherjee S., Yang Y., Mori E., Bhattacharya S., Kobayashi J., Yannone S.M., Chen D.J., Asaithamby A.. Nonenzymatic role for WRN in preserving nascent DNA strands after replication stress. Cell Rep. 2014; 9:1387–401. - PMC - PubMed
    1. Schlacher K., Wu H., Jasin M.. A distinct replication fork protection pathway connects Fanconi anemia tumor suppressors to RAD51-BRCA1/2. Cancer Cell. 2012; 22:106–116. - PMC - PubMed

MeSH terms