. 2017 Jun 20;45(11):6698-6716.
doi: 10.1093/nar/gkx187.

CDK12 regulates alternative last exon mRNA splicing and promotes breast cancer cell invasion

Affiliations

CDK12 regulates alternative last exon mRNA splicing and promotes breast cancer cell invasion

Jerry F Tien et al. Nucleic Acids Res. .

Abstract

CDK12 (cyclin-dependent kinase 12) is a regulatory kinase with evolutionarily conserved roles in modulating transcription elongation. Recent tumor genome studies of breast and ovarian cancers highlighted recurrent CDK12 mutations, which have been shown to disrupt DNA repair in cell-based assays. In breast cancers, CDK12 is also frequently co-amplified with the HER2 (ERBB2) oncogene. The mechanisms underlying functions of CDK12 in general and in cancer remain poorly defined. Based on global analysis of mRNA transcripts in normal and breast cancer cell lines with and without CDK12 amplification, we demonstrate that CDK12 primarily regulates alternative last exon (ALE) splicing, a specialized subtype of alternative mRNA splicing, that is both gene- and cell type-specific. These are unusual properties for spliceosome regulatory factors, which typically regulate multiple forms of alternative splicing in a global manner. In breast cancer cells, regulation by CDK12 modulates ALE splicing of the DNA damage response activator ATM and a DNAJB6 isoform that influences cell invasion and tumorigenesis in xenografts. We found that there is a direct correlation between CDK12 levels, DNAJB6 isoform levels and the migration capacity and invasiveness of breast tumor cells. This suggests that CDK12 gene amplification can contribute to the pathogenesis of the cancer.


Figures

Figure 1.
Figure 1.
CDK12 interacts with the RNA splicing machinery. (A) Immunoprecipitation of FLAG-CDK12 and mass spectrometry was used to identify 121 CDK12-interacting proteins in SK-BR-3 cells (enrichment score > 0, padj < 0.05, Supplementary Table S1). (B) Interacting proteins were highly enriched for RNA splicing functions as determined by gene ontology analysis (55). (C) CDK12-interacting splicing proteins can be generally divided into core spliceosome proteins (blue) and regulatory splicing factors (green, orange and brown).
Figure 2.
Figure 2.
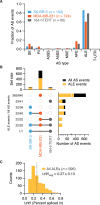
CDK12 regulates ALE splicing. (A) MISO analysis identified AS events that resulted from depletion of CDK12 in SK-BR-3, MDA-MB-231 and 184-hTERT cells (Bayes Factor ≥ 20, |ΔΨ| ≥ 0.1, present in all three RNA-seq replicates). SE, skipped exons; RI, retained introns; A3SS, alternative 3΄ splice sites; A5SS, alternative 5΄ splice sites; MXE, mutually exclusive exons; AFE, alternative first exons; ALE, alternative last exons; T-UTR (untranslated region), tandem 3΄ UTR. Three biological RNA-seq replicates assisted in the identification of ALEs as the predominate AS event in all three cell types (Supplementary Figure S3). (B) The majority of AS events (black bars) are cell type-specific and events common to SK-BR-3, MDA-MB-231 and 184-hTERT cells are all ALEs (orange bars). (C) Distribution of |ΔΨ| values for ALE events (total n = 596) regulated by CDK12 in SK-BR-3 (n = 88), MDA-MB-231 (n = 440) and 184-hTERT (n = 68) cells. The mean |ΔΨ|, as denoted by the dotted vertical line, is 0.27 ± 0.13 s.d.
Figure 3.
Figure 3.
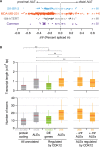
CDK12 regulates ALE splicing of genes with long transcripts and a large number of exons. (A) Depletion of CDK12 generally results in the utilization of proximal ALEs (−ΔΨ values). (B) Distributions of gene pre-mRNA transcript length and number of exons. All protein coding genes (n = 23 393) and genes with annotated ALE events (n = 4435) are compared to genes regulated by CDK12 via differential expression (DE, n = 10 653) or ALE splicing (n = 314) in SK-BR-3, MDA-MB-231 or 184-hTERT cells. Genes regulated by ALE splicing can be further subdivided into those that utilize the proximal ALE (−ΔΨ, n = 268) or distal ALE (+ΔΨ, n = 64) after CDK12 depletion. Box plots denote the 10th, 25th, 50th, 75th and 90th percentiles. Red lines represent the means. Pairwise statistical comparisons performed using the Kolmogorov–Smirnov test (*P < 1 × 10⁻⁶, **P ≈ 0, n.s. not significant), and apply to both plots describing transcript length and number of exons, respectively.
Figure 4.
Figure 4.
The 3΄ UTRs of proximal ALEs regulated by CDK12 contain higher densities of polyadenylation motifs. Distributions of the densities of polyadenylation motifs in the 3΄ UTRs of proximal and distal ALEs regulated by CDK12, as compared to control ALEs not regulated by CDK12 (detailed in Supplementary Methods). ALE events are divided into those that result in greater usage of the proximal ALE (ΔΨ < −0.1) and those that favor the distal ALE (ΔΨ > 0.1) after CDK12 depletion. Box plots denote the 10th, 25th, 50th, 75th and 90th percentile. Red lines denote the means. **P = 7 × 10⁻⁷, *P = 0.03, n.s. not significant (Mann–Whitney U test, Benjamini–Hochberg corrected).
Figure 5.
Figure 5.
Alterations in CDK12 correlate with misregulation of ALE splicing in ovarian tumor samples. (A) CDK12 is recurrently altered in ovarian serous cystadenocarcinomas (29). From this dataset, RNA-seq data were available for tumors containing CDK12 mutations (blue, n = 7; coupled to loss of heterozygosity, n = 6), bi-allelic deletions (green, n = 3) and amplifications (red, n = 4). (B) Using the MISO package, changes in AS (Bayes Factor ≥ 20) were determined based on the following comparisons: (i) CDK12 mutation versus control, (ii) CDK12 deletion versus control and (iii) CDK12 amplification versus control. Changes in CDK12-regulated AS events were compared to AS events found in control versus control comparisons. To obtain a similar number of comparisons in each scenario, each mutation sample (i) was compared to two unique control samples (n = 12 comparisons), while each deletion (ii) and amplification sample (iii) was compared to four unique control samples (n = 12 and 16 comparisons, respectively). Control versus control comparisons were likewise paired and performed in triplicate (n = 36, 36 or 48 comparisons). A total of 499 ALE events were queried, representing the aggregate of events found in the SK-BR-3, MDA-MB-231 and 184-hTERT experiments (gray boxes, SK-BR-3 ∪ MDA-MB-231 ∪ 184-hTERT). We also queried 22 ALE events common to all three cell lines (purple boxes; SK-BR-3 ∩ MDA-MB-231 ∩ 184-hTERT). Box plots denote the 10th, 25th, 50th, 75th and 90th percentiles. Red lines represent the means. The significances of comparisons (SK-BR-3 ∪ MDA-MB-231 ∪ 184-hTERT, gray lines; SK-BR-3 ∩ MDA-MB-231 ∩ 184-hTERT, purple lines) were determined using the Mann–Whitney U test (*P < 0.05, **P < 0.005, ***P < 1 × 10⁻⁵).
Figure 6.
Figure 6.
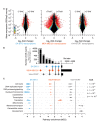
CDK12 differentially regulates gene expression in a cell type-specific manner, but affects a core set of genes and pathways. (A) Differential gene expression analysis by RNA-seq following CDK12 depletion in SK-BR-3 (left), MDA-MB-231 (middle) and 184-hTERT (right) cells. Mean expression (DESeq2 counts) is plotted against fold change (CDK12 siRNA-1 versus scrambled siRNA). Black dotted lines delineate events with |log2 (fold change)| > 1. Events with padj < 0.01 are colored. (B) Intersection set analysis showing that few differential gene expression events with padj < 0.01 and |log2 (fold change)| > 1 are common between the three cell lines. (C) Gene set enrichment analysis (GSEA) of differential gene expression (DE) resulting from CDK12 depletion in SK-BR-3, MDA-MB-231 and 184-hTERT cells (detailed in Supplementary Methods). For each pathway, a normalized enrichment score (NES) represents the extent of over-representation of genes of that pathway at the top or bottom of a ranked list. Positive and negative NES values represent up- and downregulated pathways after CDK12 depletion, respectively. Pathways are organized into 11 categories based on clustering of gene sets and general biological function (Supplementary Table S7). Sizes of markers represent the false discovery rate (FDR) values and only pathways where FDR < 0.1 are shown.
Figure 7.
Figure 7.
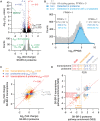
Differential protein expression due to CDK12 regulation represents a subset of differential gene expression events. (A) Top: volcano plot of the global proteome analysis in SK-BR-3 cells (nall = 6119 proteins detected by ≥ 2 peptides). Dotted horizontal line denotes point at which padj = 0.01. Dotted vertical lines lineate events with |fold change| > 1 s.d. (σ) from the mean. Bottom: distribution of fold change values for all differential protein expression events with padj < 0.01. Green vertical lines denote mean log2 (fold change) values (μ) for up and downregulation. Dotted lines are the ± 1 σ lines extended from the top plot. (B) Histogram of RNA-seq expression values (fragments per kb of exon per million fragments mapped (FPKM)) for all coding genes and genes with corresponding proteins detected by mass spectrometry with ≥ 1 unique peptides (dark blue bars) or ≥ 2 unique peptides (light blue bars). 64% of proteins detected by global proteome analysis in SK-BR-3 cells had corresponding transcripts that were detected (as defined by FPKM >1) in the RNA-seq data. (C) Correlation of fold change values from global transcriptome and proteome analysis in SK-BR-3 cells (r2all = 0.14, P < 10−5). Events with significant fold change values (padj < 0.01) in both datasets are shown in red (r2 = 0.88, P < 10−5). Events significant only in the transcriptome and proteome are colored yellow and blue, respectively. (D) GSEA pre-ranked analysis assigned a NES representing the extent of over-representation of genes of a pathway at the top or bottom of a ranked list. Positive and negative NES values represent up- and downregulated pathways, respectively. For each pathway, NES values in the SK-BR-3 transcriptome and proteome are shown. Red markers represent NES values significant in both datasets (FDR < 0.1). The dotted red line shows the general trend of these points. Blue and yellow markers represent NES values only significant in proteome and transcriptome, respectively.
Figure 8.
Figure 8.
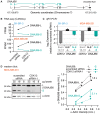
CDK12 downregulates the long isoform of DNAJB6 through ALE splicing. (A) Exon structure of the long (-L) and short (-S) isoforms of DNAJB6, corresponding to Ensembl transcripts ENST00000262177 and ENST00000429029, respectively. NLS, nuclear localization signal. (B) Quantification of DNAJB6-L and DNAJB6-S transcript levels (FPKM) after CDK12 depletion in SK-BR-3 and MDA-MB-231 cells by RNA-seq using Cufflinks. Error bars represent s.d. (C) Validation of changes in DNAJB6-L and DNAJB6-S transcript expression after CDK12 depletion in SK-BR-3 and MDA-MB-231 cells by quantitative reverse transcriptase-polymerase chain reaction (qRT-PCR). Error bars denote the 99% confidence interval range. (D) Relative quantification of changes in DNAJB6-L and DNAJB6-S protein expression due to CDK12 depletion in MDA-MB-231 cells by western blot analysis (detailed in Supplementary Methods).
Figure 9.
Figure 9.
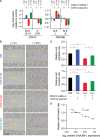
CDK12 promotes cell migration and invasion in MDA-MB-231 triple-negative breast cancer cells. (A) CDK12 siRNA-1 and a CDK12 cDNA plasmid were used to manipulate the expression levels of CDK12 and for correlation to DNAJB6-S/L mRNA isoform expression, as measured by qRT-PCR. PCR primers targeting the exon 12–13 junction of CDK12 amplify both the endogenous CDK12 mRNA and the CDK12 mRNA from the ectopic CDK12 cDNA. PCR primers targeting the 5΄ UTR of CDK12 specifically amplify the endogenous mRNA only. Error bars denote the 99% confidence interval. (B) Representative images of MDA-MB-231 cell invasion into collagen matrix as assayed by scratch wound experiments. Images shown for control cells (Ctrl), cells over-expressing CDK12 (OE), cells depleted of CDK12 by siRNA (Dep) and cells depleted of CDK12 and transfected with CDK12 cDNA (Res). Scale bar represents 300 μm. (C) Rates of MDA-MB-231 cell migration and invasion. Error bars represent s.d. of curve fits to the migration and invasion data in Supplementary Figure S10 (n = 4 per condition, detailed in Supplementary Methods). The student's t-test was used for statistical comparisons (*P < 0.0001). (D) The rate of cell invasion is proportional to DNAJB6-L mRNA expression (r2 = 0.97, P = 0.03). Horizontal error bars denote the 99% confidence interval range from qRT-PCR analysis. Vertical error bars represent the s.d. of curve fits to the data in Supplementary Figure S10.

References

    1. Romano G., Giordano A.. Role of the cyclin-dependent kinase 9-related pathway in mammalian gene expression and human diseases. Cell Cycle. 2008; 7:3664–3668. - PubMed
    1. Loyer P., Trembley J.H., Katona R., Kidd V.J., Lahti J.M.. Role of CDK/cyclin complexes in transcription and RNA splicing. Cell Signal. 2005; 17:1033–1051. - PubMed
    1. Malumbres M. Cyclin-dependent kinases. Genome Biol. 2014; 15:122–131. - PMC - PubMed
    1. Bartkowiak B., Liu P., Phatnani H.P., Fuda N.J., Cooper J.J., Price D.H., Adelman K., Lis J.T., Greenleaf A.L.. CDK12 is a transcription elongation-associated CTD kinase, the metazoan ortholog of yeast Ctk1. Genes Dev. 2010; 24:2303–2316. - PMC - PubMed
    1. Blazek D., Kohoutek J., Bartholomeeusen K., Johansen E., Hulinkova P., Luo Z., Cimermancic P., Ule J., Peterlin B.M.. The Cyclin K/Cdk12 complex maintains genomic stability via regulation of expression of DNA damage response genes. Genes Dev. 2011; 25:2158–2172. - PMC - PubMed

MeSH terms