

Mocap: large-scale inference of transcription factor binding sites from chromatin accessibility
- PMID: 28334916
- PMCID: PMC5416775
- DOI: 10.1093/nar/gkx174
Mocap: large-scale inference of transcription factor binding sites from chromatin accessibility
Abstract
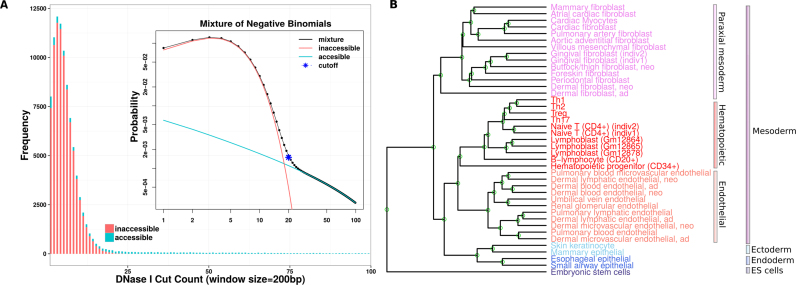
Differential binding of transcription factors (TFs) at cis-regulatory loci drives the differentiation and function of diverse cellular lineages. Understanding the regulatory interactions that underlie cell fate decisions requires characterizing TF binding sites (TFBS) across multiple cell types and conditions. Techniques, e.g. ChIP-Seq can reveal genome-wide patterns of TF binding, but typically requires laborious and costly experiments for each TF-cell-type (TFCT) condition of interest. Chromosomal accessibility assays can connect accessible chromatin in one cell type to many TFs through sequence motif mapping. Such methods, however, rarely take into account that the genomic context preferred by each factor differs from TF to TF, and from cell type to cell type. To address the differences in TF behaviors, we developed Mocap, a method that integrates chromatin accessibility, motif scores, TF footprints, CpG/GC content, evolutionary conservation and other factors in an ensemble of TFCT-specific classifiers. We show that integration of genomic features, such as CpG islands improves TFBS prediction in some TFCT. Further, we describe a method for mapping new TFCT, for which no ChIP-seq data exists, onto our ensemble of classifiers and show that our cross-sample TFBS prediction method outperforms several previously described methods.
© The Author(s) 2017. Published by Oxford University Press on behalf of Nucleic Acids Research.
Figures


Similar articles
-
Assessing the model transferability for prediction of transcription factor binding sites based on chromatin accessibility.BMC Bioinformatics. 2017 Jul 27;18(1):355. doi: 10.1186/s12859-017-1769-7. BMC Bioinformatics. 2017. PMID: 28750606 Free PMC article.
-
Improving analysis of transcription factor binding sites within ChIP-Seq data based on topological motif enrichment.BMC Genomics. 2014 Jun 13;15(1):472. doi: 10.1186/1471-2164-15-472. BMC Genomics. 2014. PMID: 24927817 Free PMC article.
-
Sequence features and chromatin structure around the genomic regions bound by 119 human transcription factors.Genome Res. 2012 Sep;22(9):1798-812. doi: 10.1101/gr.139105.112. Genome Res. 2012. PMID: 22955990 Free PMC article.
-
Sequence and chromatin determinants of transcription factor binding and the establishment of cell type-specific binding patterns.Biochim Biophys Acta Gene Regul Mech. 2020 Jun;1863(6):194443. doi: 10.1016/j.bbagrm.2019.194443. Epub 2019 Oct 19. Biochim Biophys Acta Gene Regul Mech. 2020. PMID: 31639474 Free PMC article. Review.
-
Role of ChIP-seq in the discovery of transcription factor binding sites, differential gene regulation mechanism, epigenetic marks and beyond.Cell Cycle. 2014;13(18):2847-52. doi: 10.4161/15384101.2014.949201. Cell Cycle. 2014. PMID: 25486472 Free PMC article. Review.
Cited by
-
Accurate prediction of cell type-specific transcription factor binding.Genome Biol. 2019 Jan 10;20(1):9. doi: 10.1186/s13059-018-1614-y. Genome Biol. 2019. PMID: 30630522 Free PMC article.
-
Anchor: trans-cell type prediction of transcription factor binding sites.Genome Res. 2019 Feb;29(2):281-292. doi: 10.1101/gr.237156.118. Epub 2018 Dec 19. Genome Res. 2019. PMID: 30567711 Free PMC article.
-
MICMIC: identification of DNA methylation of distal regulatory regions with causal effects on tumorigenesis.Genome Biol. 2018 Jun 5;19(1):73. doi: 10.1186/s13059-018-1442-0. Genome Biol. 2018. PMID: 29871649 Free PMC article.
-
Virtual ChIP-seq: predicting transcription factor binding by learning from the transcriptome.Genome Biol. 2022 Jun 10;23(1):126. doi: 10.1186/s13059-022-02690-2. Genome Biol. 2022. PMID: 35681170 Free PMC article.
-
Alternative transcription start sites contribute to acute-stress-induced transcriptome response in human skeletal muscle.Hum Genomics. 2022 Jul 22;16(1):24. doi: 10.1186/s40246-022-00399-8. Hum Genomics. 2022. PMID: 35869513 Free PMC article.
References
-
- Mitchell P.J., Tjian R.. Transcriptional regulation in mammalian cells by sequence-specific DNA binding proteins. Science. 1989; 245:371–378. - PubMed
-
- van Steensel B. Mapping of genetic and epigenetic regulatory networks using microarrays. Nat. Genet. 2005; 37:S18–S24. - PubMed
-
- Junion G., Spivakov M., Girardot C., Braun M., Gustafson E.H., Birney E., Furlong E.E.. A transcription factor collective defines cardiac cell fate and reflects lineage history. Cell. 2012; 148:473–486. - PubMed
-
- Davidson E. The Regulatory Genome: Gene Regulatory Networks In Development And Evolution. 2010; NY: Elsevier Science.
Publication types
MeSH terms
Substances
LinkOut - more resources
Full Text Sources
Other Literature Sources
Miscellaneous
