. 2017 Jun 20;45(11):e97.
doi: 10.1093/nar/gkx143.

Enrichment methods provide a feasible approach to comprehensive and adequately powered investigations of the brain methylome

Affiliations

Enrichment methods provide a feasible approach to comprehensive and adequately powered investigations of the brain methylome

Robin F Chan et al. Nucleic Acids Res. .

Abstract

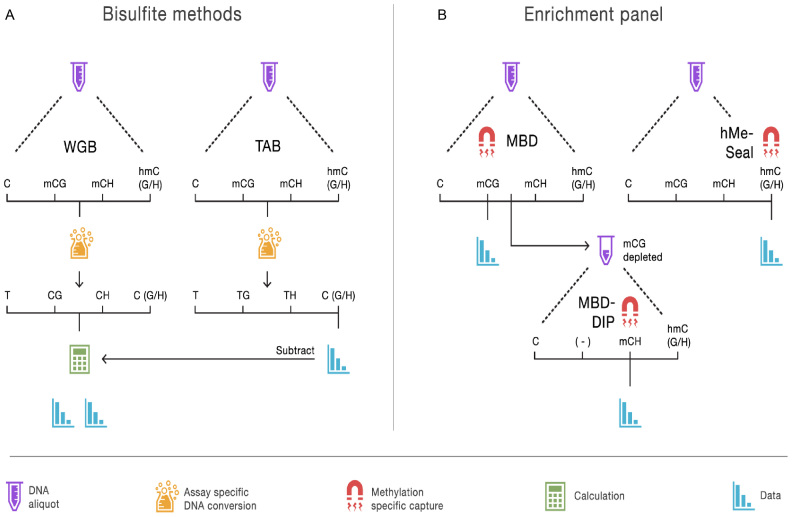
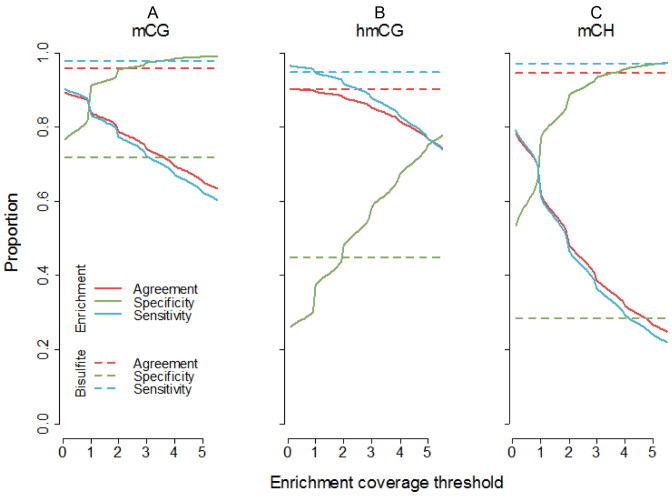
Methylome-wide association studies are typically performed using microarray technologies that only assay a very small fraction of the CG methylome and entirely miss two forms of methylation that are common in brain and likely of particular relevance for neuroscience and psychiatric disorders. The alternative is to use whole genome bisulfite (WGB) sequencing but this approach is not yet practically feasible with sample sizes required for adequate statistical power. We argue for revisiting methylation enrichment methods that, provided optimal protocols are used, enable comprehensive, adequately powered and cost-effective genome-wide investigations of the brain methylome. To support our claim we use data showing that enrichment methods approximate the sensitivity obtained with WGB methods and with slightly better specificity. However, this performance is achieved at <5% of the reagent costs. Furthermore, because many more samples can be sequenced simultaneously, projects can be completed about 15 times faster. Currently the only viable option available for comprehensive brain methylome studies, enrichment methods may be critical for moving the field forward.


Figures

Figure 1.
Figure 1.
Overview of methods to assay the brain methylome. (A) The bisulfite methods each start with separate aliquots of genomic DNA. In the case of whole genome bisulfite (WGB) sequencing, sodium bisulfite treatment prior to sequencing converts non-methylated cytosines to uracil but leaves methylated cytosines intact. This provides an estimation of methylation based on the number of unconverted cytosines sequenced. TET-assisted bisulfite (TAB) sequencing sample preparation leaves only hydroxymethylated sites unconverted and provides a direct estimate of hydroxymethylation (hmC). WGB does not discriminate between mC and hmC. However, by subtracting the TAB hmC estimates from the WBS data we obtain estimates of mC. Further distinction between (h)mCG and (h)mCH is achieved by examining the sequence context of each site. (B) With our enrichment panel, genomic DNA is fragmented and fragments are then captured by proteins or other molecules with high affinity for methylated DNA. Next, the non-methylated genomic fraction is removed and the methylation-enriched fraction sequenced. Different sample preparations will enrich for different forms of methylation. Our panel assays mCG using a methyl-CG binding domain (MBD) protein. The MBD protein strictly captures fragments that have methylated CG sites. To assay mCH, we used methylated DNA immunoprecipitation (MeDIP) on DNA fragments that were not captured by the MBD protein. We labeled this approach MBD-DIP. While anti-mC antibodies bind both mCG and mCH, pre-depletion of mCG leads predominantly to capture mCH. For hmC we used a separate aliquot of the genomic DNA, and used selective chemical labeling and capture (hMe-Seal) approach.
Figure 2.
Figure 2.
Methylation patterns at enrichment loci. Enrichment methods assay loci that are about the size of the extracted fragments. We used our bisulfite data to characterize the methylation patterns at these loci. For example, the total amount of methylation of a target site Y (or methylation sum) was calculated as a weighted sum of the methylation at all sites flanking Y. The weight for a neighboring site i was equal to the probability that a fragment containing site Y also covered site i. Thus, whereas sites close to Y will have a weight close to one because they will almost always be covered by the same fragments, this probability will be zero for sites located at a distance larger than the maximum fragment size. Calculation of the weights/probabilities requires the fragment size distribution, which was estimated using a method outlined elsewhere (42). (A) The total number of putative methylation sites was comparable for mCG and hmCG (median ∼5 sites per fragment). For mCH there were many more sites (∼74) per fragment as this includes all cytosines outside the CG context. (B) Mean methylation levels per fragment showed a bimodal pattern for mCG and hmCG, with a clear inflection point (vertical line) separating the two peaks. The second peak for mCG suggests that if methylation occurs, it tends to be substantial (∼0.7–0.9 range). In contrast, for hmCG the second peak suggests much more modest levels of methylation (∼0.2–0.5 range). For both mCG and hmCG, the first peak was located at zero suggesting that a proportion of fragments did not contain methylated sites. For mCH we observed very low levels of methylation. Inspection of region close to zero (insert) showed that mCH distribution was unimodal (i.e. no peak at zero). This implies that almost every locus contained some mCH methylation. (C) Variance was very low for all three forms of methylation, suggesting sites across the fragment-sized loci have similar methylation statuses. (D) The sum of methylation of all sites within the fragment-size loci was largest for mCG (median 2.4). For hmCG the methylation sum was much smaller (0.9). Although methylation levels outside the CG context were low, mCH methylation sum still reached substantial levels (1.9) due to the much larger number of possible methylation sites (Figure 3A).
Figure 3.
Figure 3.
Methylome-wide coverage of enrichment methods. To study sensitivity and specificity (methylome-wide coverage) of our enrichment panel, we first used our bisulfite data to classify loci as methylated or non-methylated. (A) mCG results (MBD) showed that sensitivity decreases and specificity increases, as the coverage threshold is heightened. As methylated loci were much more abundant than non-methylated loci, the overall agreement between bisulfite and MBD closely followed sensitivity. The sensitivity of MBD approached that of the bisulfite methods at a coverage cut-off of 0.5, while retaining higher specificity. The MBD sensitivity and specificity approached equivalency at an enrichment coverage threshold of about 0.9. (B) The sensitivity and specificity of hmCG capture by hMe-Seal was very similar to TAB-seq at a threshold of ∼2. At a threshold of ∼5, sensitivity and specificity were approximately equal for the enrichment method. (C) To avoid any possible bias due to imperfect depletion for mCG, indices for mCH were calculated using only cytosines (∼80 million) located more than the maximum fragment size away from CG dinucleotides. Sensitivity was generally lower but specificity higher for MBD-DIP compared to the bisulfite method. Like mCG, the pattern of results for mCH indicates a coverage threshold of 0.5 achieves relatively good sensitivity while retaining acceptable specificity, with sensitivity and specificity equivalent at a threshold of about 0.9.
Figure 4.
Figure 4.
Methylation profiles across genomic features. We classified loci as methylated versus non-methylated, and genomic features as present versus absent. Using these 2 by 2 tables as input, we calculated odds ratios that indicated whether sites in the studied featured were more likely to be methylated compared to sites not in this feature. For the purpose of plotting we took the log10 of the odds ratio. Thus, a value of zero, log10(1) = 0, indicated by the dashed lines in the figures, means no enrichment of methylated sites. Odds ratios for mCH were calculated using only cytosines located more than the maximum fragment size away from CG dinucleotides. This explains the missing values in panel C for CG islands, as those regions contain no such cytosines. The full list of tested features is provided in Supplementary Table S5. For assaying mCG, profiles across genomic features were very similar for WGB and MBD (A). This suggested that both technologies covered similar features. For hmCG, the two patterns were also very comparable but the odds ratios were systematically larger for hMe-Seal (B). This is unlikely the result of sampling variation because the effects (i) were in the same direction, and (ii) displayed a pattern comparable to that observed for mCG (A). Instead, it suggested that hMe-Seal outperformed TAB in terms of more accurately classifying methylation status. In contrast, enrichment for mCH had an opposite relationship to WGB (C). Although, patterns were still similar, odds ratios were smaller for MBD-DIP suggesting it may be less accurate.
Figure 5.
Figure 5.
Methylation variance at fragment sized loci. The variance was low for all three types of bisulfite methylation estimates (Figure 3C), suggesting sites tend to have similar methylation levels within our fragment sized loci. To further quantify this phenomenon, we plotted the percentiles of the methylation variances. Over 90% of the loci had a variance <0.05. There were slight differences among the three types, with mCG showing relatively more variability than hmCG and mCH being the most invariant.

References

    1. Gage F.H., Temple S.. Neural stem cells: generating and regenerating the brain. Neuron. 2013; 80:588–601. - PubMed
    1. Heyward F.D., Sweatt J.D.. DNA methylation in memory formation: emerging insights. Neuroscientist. 2015; 21:475–489. - PMC - PubMed
    1. Aberg K.A., McClay J.L., Nerella S., Clark S., Kumar G., Chen W., Khachane A.N., Xie L., Hudson A., Gao G. et al. . Methylome-wide association study of schizophrenia: identifying blood biomarker signatures of environmental insults. JAMA Psychiatry. 2014; 71:255–264. - PMC - PubMed
    1. Mill J., Tang T., Kaminsky Z., Khare T., Yazdanpanah S., Bouchard L., Jia P., Assadzadeh A., Flanagan J., Schumacher A. et al. . Epigenomic profiling reveals DNA-methylation changes associated with major psychosis. Am. J. Hum. Genet. 2008; 82:696–711. - PMC - PubMed
    1. Wang T., Pan Q., Lin L., Szulwach K.E., Song C.X., He C., Wu H., Warren S.T., Jin P., Duan R. et al. . Genome-wide DNA hydroxymethylation changes are associated with neurodevelopmental genes in the developing human cerebellum. Hum. Mol. Genet. 2012; 21:5500–5510. - PMC - PubMed