. 2017 Jun 2;45(10):5720-5738.
doi: 10.1093/nar/gkx156.

A class of circadian long non-coding RNAs mark enhancers modulating long-range circadian gene regulation

Affiliations

A class of circadian long non-coding RNAs mark enhancers modulating long-range circadian gene regulation

Zenghua Fan et al. Nucleic Acids Res. .

Abstract

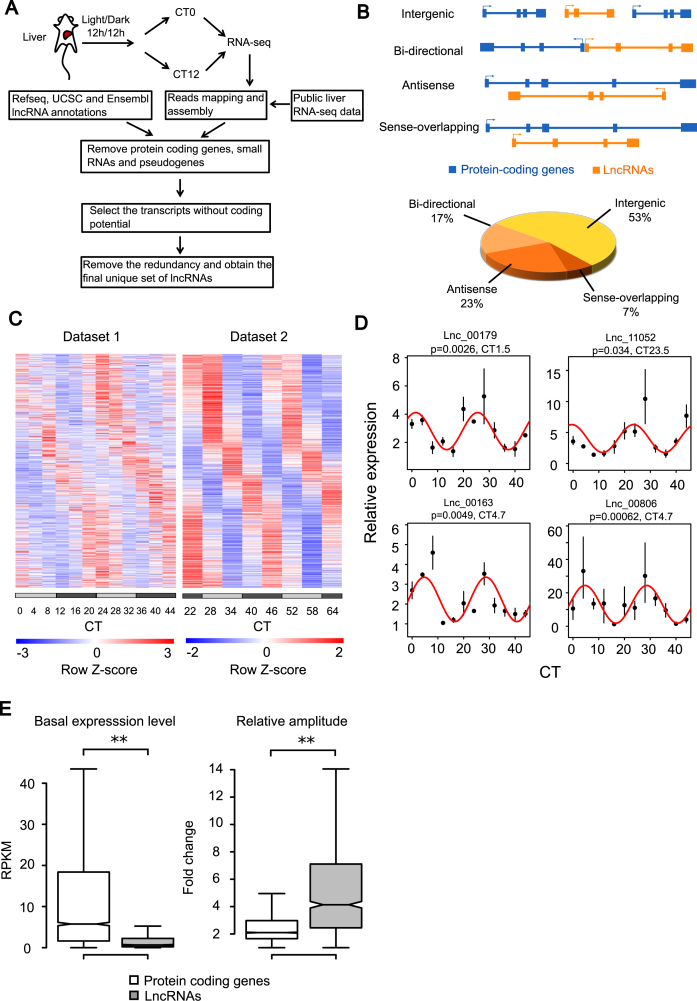
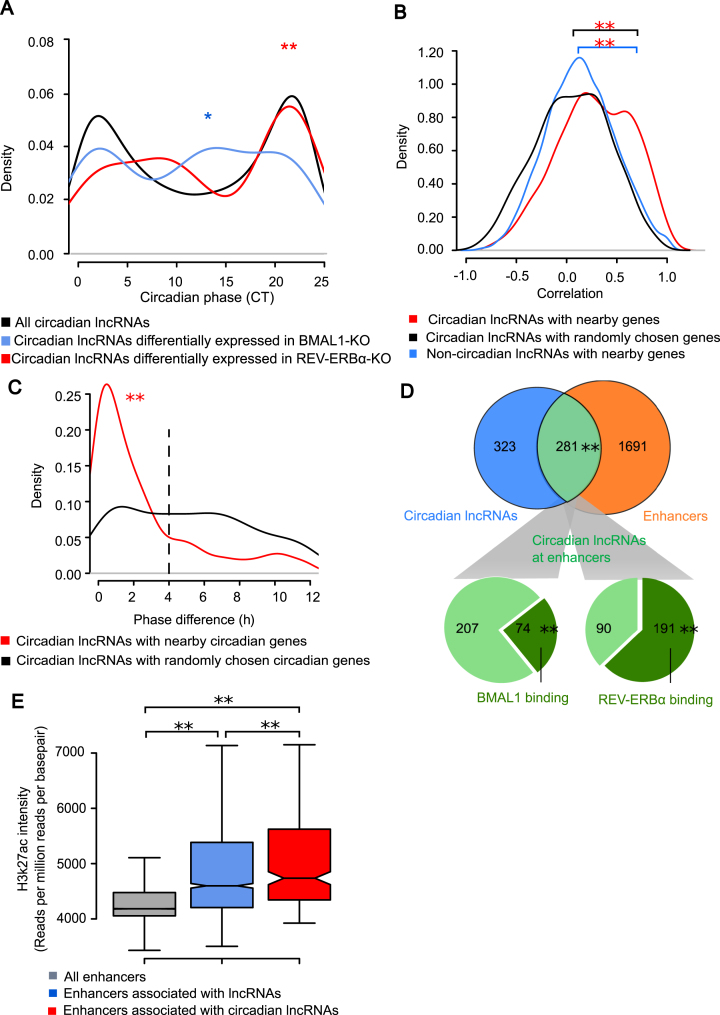
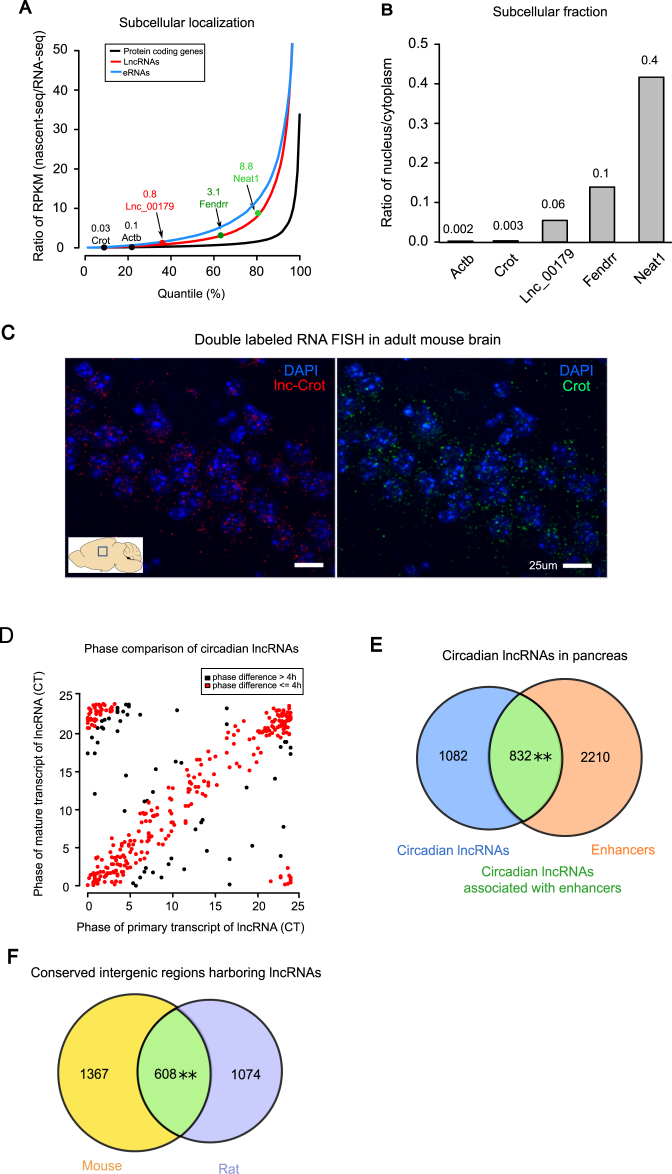
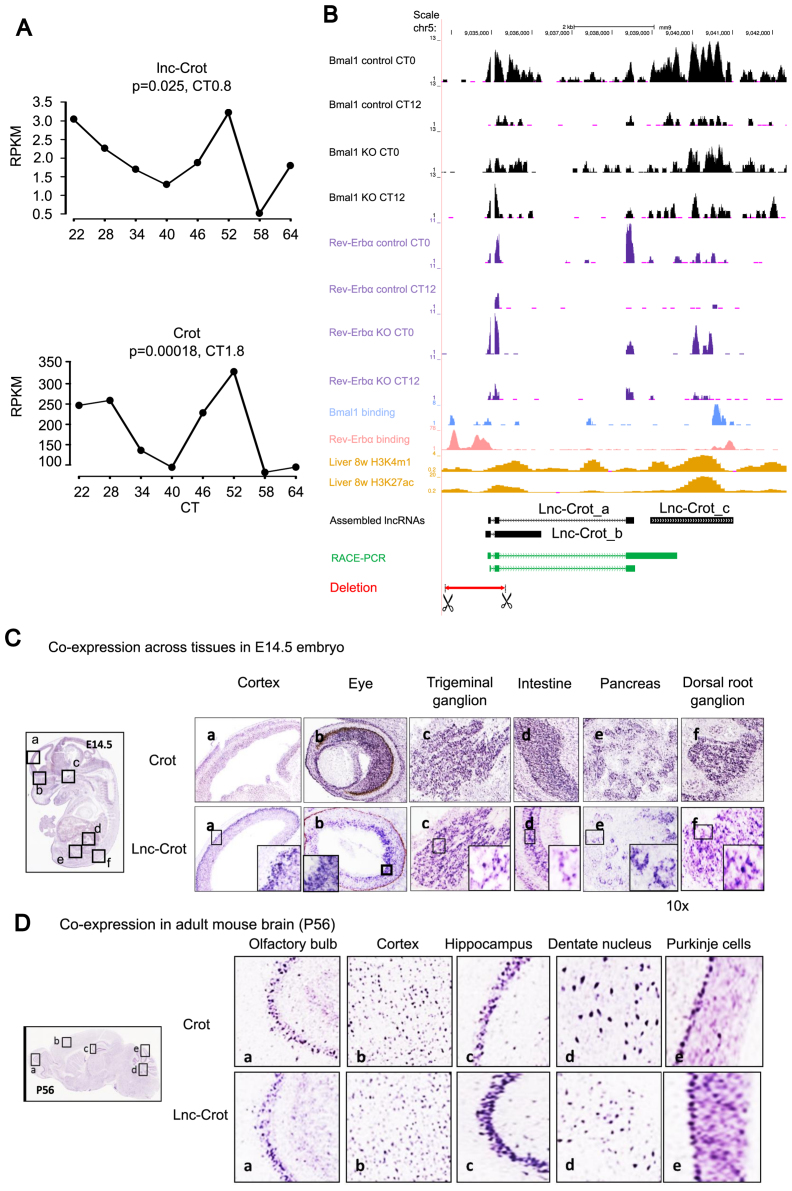
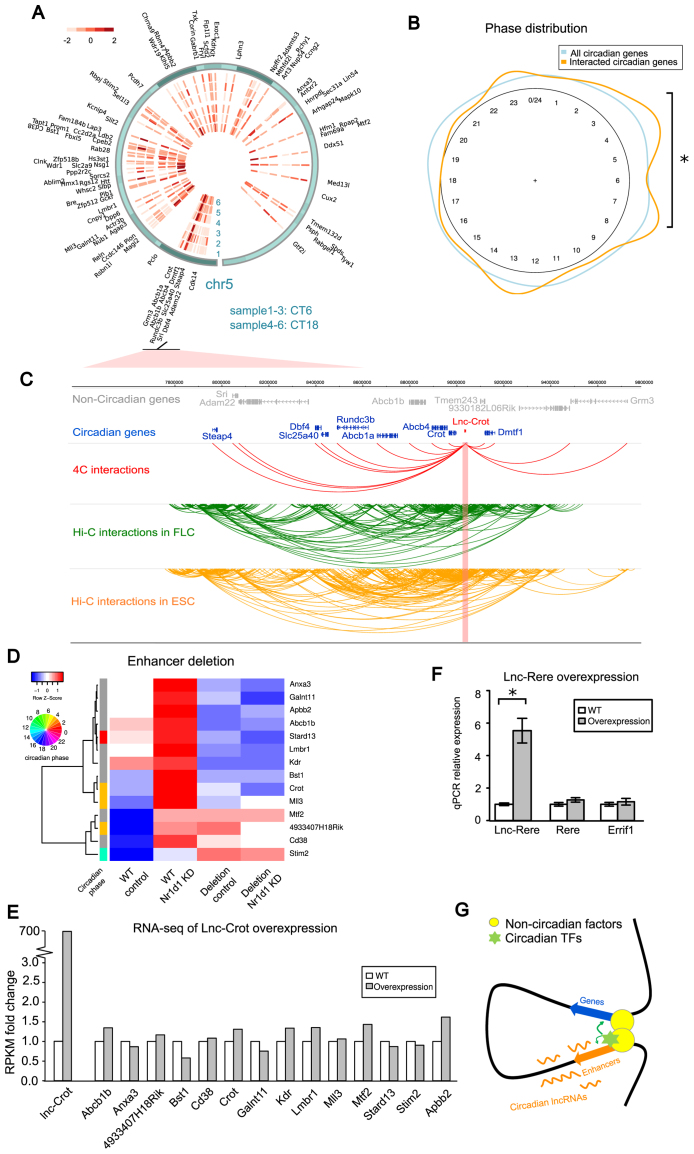
Circadian rhythm exerts its influence on animal physiology and behavior by regulating gene expression at various levels. Here we systematically explored circadian long non-coding RNAs (lncRNAs) in mouse liver and examined their circadian regulation. We found that a significant proportion of circadian lncRNAs are expressed at enhancer regions, mostly bound by two key circadian transcription factors, BMAL1 and REV-ERBα. These circadian lncRNAs showed similar circadian phases with their nearby genes. The extent of their nuclear localization is higher than protein coding genes but less than enhancer RNAs. The association between enhancer and circadian lncRNAs is also observed in tissues other than liver. Comparative analysis between mouse and rat circadian liver transcriptomes showed that circadian transcription at lncRNA loci tends to be conserved despite of low sequence conservation of lncRNAs. One such circadian lncRNA termed lnc-Crot led us to identify a super-enhancer region interacting with a cluster of genes involved in circadian regulation of metabolism through long-range interactions. Further experiments showed that lnc-Crot locus has enhancer function independent of lnc-Crot's transcription. Our results suggest that the enhancer-associated circadian lncRNAs mark the genomic loci modulating long-range circadian gene regulation and shed new lights on the evolutionary origin of lncRNAs.


Figures

Figure 1.
Figure 1.
Identification of circadian lncRNAs in mouse liver. (A) The schematic work flow of de novo lncRNA assembly from RNA-seq data of mouse liver and integration with public annotation of lncRNAs. (B) Classification of lncRNAs based on their genomic locations relative to protein coding genes and the percentage of each category. (C) Heatmap of circadian expression of all circadian lncRNAs identified by the meta-analysis of dataset 1 (20) and dataset 2 (21). (D) Four selected circadian lncRNAs validated by quantitative polymerase chain reaction (qPCR) (n = 2–3). Lines were the best fitted cosine functions with fitted P-values and phases. All expression values in qPCR were quantified relative to expression of Actb. (E) Comparison of basal expression levels and relative amplitudes between circadian lncRNAs and circadian protein coding genes revealed lower expression levels but higher relative amplitudes of circadian lncRNAs than circadian protein coding genes. Relative amplitude was calculated by the ratio between peak and trough of circadian expression. Kolmogorov–Smirnov (KS) test was performed for the comparisons of both basal expression levels (P-value < 2.2 × 10⁻¹⁶) and relative amplitudes (P-value < 2.2 × 10⁻¹⁶), where the significance level was determined by ** P-value < 0.01 and * P-value < 0.05.
Figure 2.
Figure 2.
Circadian lncRNAs were enriched in enhancer regions. (A) Phase distribution of all circadian lncRNAs and those differentially expressed in BMAL1 KO or REV-ERBα KO mice. Phases of circadian lncRNAs differentially expressed in BMAL1 KO and REV-ERBα KO were enriched around CT12 (CT10–CT14, Fisher's Exact Test, *P-value = 0.025) and CT0 (CT21–CT23, Fisher's Exact Test, P-value = 0.0002) respectively, compared with all circadian lncRNAs. (B) Distribution of Pearson's correlation coefficients of lncRNAs with nearby protein coding genes in dataset 2. Comparisons of distribution were performed using KS test, where **P-value = 8.0 × 10⁻¹² (circadian lncRNAs with nearby genes versus circadian lncRNAs with random genes) and **P-value = 3.6 × 10⁻¹⁵ (non-circadian lncRNAs with nearby genes vs. circadian lncRNAs with random genes). (C) Distribution of phase differences between circadian lncRNAs and nearby circadian protein coding genes. Comparison between two distributions of phase differences was performed using KS test, with **P-value = 7.5 × 10⁻¹². (D) Enhancers, BMAL1 binding sites and REV-ERBα binding sites on circadian lncRNA loci. Significance of **P-value < 2.2 × 10⁻¹⁶ was determined by Fisher's Exact Test for the overlap between circadian lncRNAs and enhancers. The binding sites are over-represented on circadian lncRNA loci at enhancer regions compared to those at non-enhancer regions, where significance of **P-value < 2.2 × 10⁻¹⁶ and **P-value < 2.2 × 10⁻¹⁶ were calculated by Fisher's exact test for BMAL1 binding and REV-ERBα binding respectively. (E) Distribution of H3K27ac ChIP intensities on enhancer regions. Comparisons were performed by KS test between pairs, where **P-value < 2.2 × 10⁻¹⁶ (all enhancers vs. enhancers associated with lncRNAs), **P-value < 2.2 × 10⁻¹⁶ (all enhancers vs. enhancers associated with circadian lncRNAs) and **P-value = 0.0017 (enhancers associated with lncRNAs vs. enhancers associated with circadian lncRNAs) suggested they were all significantly different.
Figure 3.
Figure 3.
Subcellular localization of circadian lncRNAs in liver and circadian lncRNAs in non-hepatic tissues. (A) Distributions of relative nucleus to cytoplasm ratios for protein coding genes, lncRNAs and enhancer RNAs (eRNAs). Protein coding genes Actb and Crot, lncRNAs Fendrr and Neat1, and one selected circadian lncRNA were highlighted. Comparisons were performed using KS test, where **P-value < 2.2 × 10⁻¹⁶ (coding genes vs. lncRNAs) and **P-value = 2.2 × 10⁻¹⁶ (lncRNAs vs. eRNAs). (B) Relative nucleus to cytoplasm ratios assayed by qPCR of extracted RNAs separately from nucleus and cytoplasm in mouse liver. (C) Double RNA FISH confocal imaging of Crot mRNA labeled with FITC (right image, green), lnc-Crot labeled with DIG (left image, red) and nucleus labeled with DAPI (blue) in CA3 region of hippocampus in adult mouse brain (P56). Images were taken at 60× magnification. Scale bar: 25 μm. (D) Phases of circadian lncRNAs that also oscillated on nascent-seq. Phases of circadian lncRNAs from RNA-seq (Y-axis) and nascent-seq (X-axis) were plotted. Red ones are the lncRNAs with phase differences <4 h between RNA-seq and nascent-seq. (E) Circadian lncRNAs in pancreas also have significant overlap with the enhancers in pancreas. Pancreatic lncRNAs were assembled and identified by RNA-seq data of pancreas and enhancers were identified by H3K27ac ChIP-seq of pancreas (58). Significance level was determined by Fisher's exact test, where **P-value = 0.007. (F) Overlap of intergenic regions harboring lncRNAs in mouse and rat is significant (Fisher's exact test **P-value < 2.2 × 10⁻¹⁶).
Figure 4.
Figure 4.
Enhancer associated circadian lncRNA lnc-Crot and its co-expression with its neighboring gene Crot. (A) Circadian expression of lnc-Crot and its neighboring protein coding gene Crot in liver RNA-seq dataset 2. Significance of circadian oscillation and phase were calculated by cosine fitting method. (B) Lnc-Crot locus overlaps with enhancers and is bound by multiple transcription factors (TFs) as displayed by UCSC Genome Browser (mouse genome mm9) (http://genome.ucsc.edu). The tracks in black are RNA-seq of BMAL1 KO and control in liver and tracks in purple are RNA-seq of REV-ERBα KO and control in liver. BMAL1 binding (26,20), REV-ERBα binding (27,50) and histone marks were from ChIP-seq data in liver. Assembled gene models of three isoforms of lnc-Crot locus (lnc-Crot_a, lnc-Crot_b and lnc-Crot_c) were shown. Green track is the full-length gene model of lnc-Crot obtained by rapid amplification of cDNA ends (RACE)-PCR experiment. Red track is the deleted region of lnc-Crot by CRISPR-Cas9. (C) RNA-ISH of lnc-Crot and Crot across tissues in E14.5 mouse embryo (D) RNA-ISH of lnc-Crot and Crot across tissues in P56 adult mouse brain.
Figure 5.
Figure 5.
Interactome of lnc-Crot locus by 4C-seq and RNA-independent enhancer function of lnc-Crot. (A) Heatmap of interaction intensities of 4C-seq and interacted genes on chr5 (cis-chromosome) at CT6 and CT18. Interaction intensities were quantified by z-score (‘Materials and Methods’ section). Bait region was lnc-Crot locus. (B) Circadian phases of interacted circadian protein coding genes in 4C-seqand phases of all circadian genes. The phases of interacted genes were enriched around CT0 and CT8 (single-sided Fisher's exact test, P-value = 0.034) compared with all circadian genes. (C) 2Mb regions surrounding the lnc-Crot locus was displayed by WashU EpiGenome Browser (http://epigenomegateway.wustl.edu/browser/). Interacted genes were shown at top track as circadian and non-circadian. Interactions with lnc-Crot locus in liver from 4C-seq were shown below. Then interactions in fetal liver cells (FLC) and embryonic stem cells (ESC) from Hi-C study (64) in this region were shown. (D) Differentially expressed 4C-interacted genes in the RNA-seq of lnc-Crot enhancer deletion in Hepa1-6 cells. (E) Differentially expressed 4C-interacted genes did not show significant change in the RNA-seq upon lnc-Crot in cis over-expression. (F) In cis over-expression of lnc-Rere did not lead to significant changes of its neighboring gene expression assayed by qPCR. (G) Our hypothetical model that the lnc-Crot enhancer and target genes first form a scaffold through long-range interactions then histone modifications and circadian TF bindings take place to confer circadian gene expression.

References

    1. Thresher R.J., Vitaterna M.H., Miyamoto Y., Kazantsev a, Hsu D.S., Petit C., Selby C.P., Dawut L., Smithies O., Takahashi J.S. et al. Role of mouse cryptochrome blue-light photoreceptor in circadian photoresponses. Science. 1998; 282:1490–1494. - PubMed
    1. Preitner N., Damiola F., Zakany J., Duboule D., Albrecht U., Schibler U.. The orphan nuclear receptor REV-ERBα controls circadian transcription within the positive limb of the mammalian circadian oscillator University of Geneva University of Geneva. Cell. 2002; 110:251–260. - PubMed
    1. Relógio A., Westermark P.O., Wallach T., Schellenberg K., Kramer A., Herzel H.. Tuning the mammalian circadian clock: robust synergy of two loops. PLoS Comput. Biol. 2011; 7:1–18. - PMC - PubMed
    1. Pett J.P., Korenčič A., Wesener F., Kramer A., Herzel H.. Feedback loops of the mammalian circadian clock constitute repressilator. PLOS Comput. Biol. 2016; 12:e1005266. - PMC - PubMed
    1. Panda S., Antoch M.P., Miller B.H., Su A.I., Schook A.B., Straume M., Schultz P.G., Kay S.A., Takahashi J.S., Hogenesch J.B.. Coordinated transcription of key pathways in the mouse by the circadian clock. Cell. 2002; 109:307–320. - PubMed

MeSH terms

Substances