. 2017 Jun 2;45(10):6109-6118.
doi: 10.1093/nar/gkx161.

Melting temperature highlights functionally important RNA structure and sequence elements in yeast mRNA coding regions

Affiliations

Melting temperature highlights functionally important RNA structure and sequence elements in yeast mRNA coding regions

Fei Qi et al. Nucleic Acids Res. .

Abstract

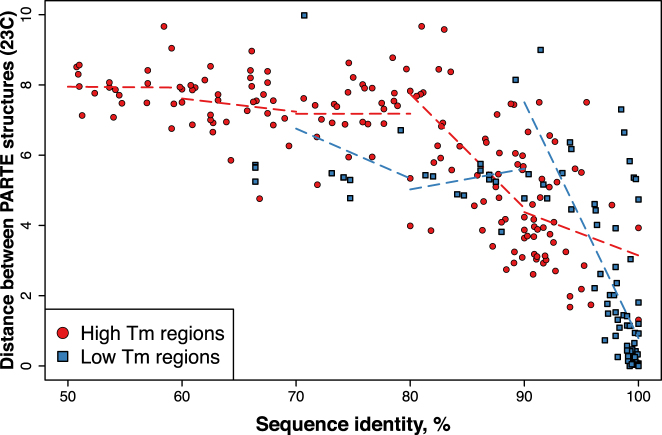
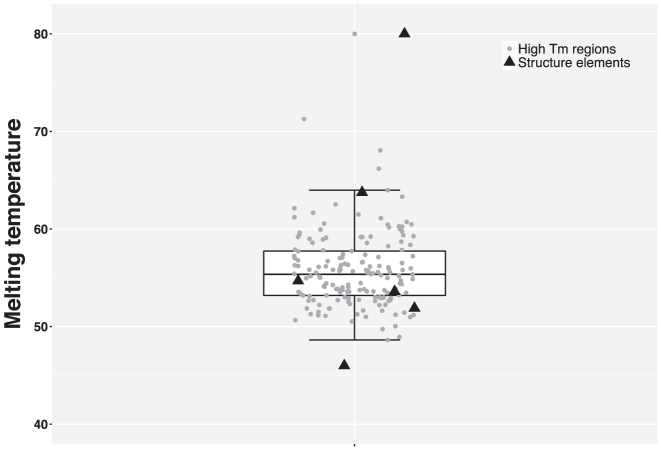
Secondary structure elements in the coding regions of mRNAs play an important role in gene expression and regulation, but distinguishing functional from non-functional structures remains challenging. Here we investigate the dependence of sequence-structure relationships in the coding regions on temperature based on the recent PARTE data by Wan et al. Our main finding is that the regions with high and low thermostability (high Tm and low Tm regions) are under evolutionary pressure to preserve RNA secondary structure and primary sequence, respectively. Sequences of low Tm regions display a higher degree of evolutionary conservation compared to high Tm regions. Low Tm regions are under strong synonymous constraint, while high Tm regions are not. These findings imply that high Tm regions contain thermo-stable functionally important RNA structures, which impose relaxed evolutionary constraint on sequence as long as the base-pairing patterns remain intact. By contrast, low thermostability regions contain single-stranded functionally important conserved RNA sequence elements accessible for binding by other molecules. We also find that theoretically predicted structures of paralogous mRNA pairs become more similar with growing temperature, while experimentally measured structures tend to diverge, which implies that the melting pathways of RNA structures cannot be fully captured by current computational approaches.


Figures

Figure 1.
Figure 1.
Variation of the distance between secondary structures of paralogous mRNA pairs along the temperature ladder. Points are the median levels of the distance at each temperature. (A) Distance between PARTE structures. (B) Distance between predicted structures.
Figure 2.
Figure 2.
Sequence–structure relationships in the high/low Tm regions of paralogous mRNA pairs. For high Tm regions, the distance between structures shows a linear dependence from sequence identity for sequence identity values over 80% (correlation coefficient −0.54, P-value = 2.0e-7). For low Tm regions, the distance between structures shows a linear dependence from sequence identity for the sequence identity values over 90% (correlation coefficient −0.69, P-value = 2.1e-11). Linear regression for each 10% range of sequence identity is shown by a dashed line with the corresponding color. PARTE structures at 23°C were used.
Figure 3.
Figure 3.
Low Tm regions in paralogous mRNA pairs are more conserved in sequence while high Tm regions are more conserved in RNA secondary structure. (A) Sequence identity between mRNAs (Mann–Whitney–Wilcoxon test, P-value = 1.9e-21). (B) Distance between RNA secondary structures (PARTE structures at 23°C; Mann–Whitney–Wilcoxon test, P-value = 4.6e-3). The differences are significant according to Mann–Whitney–Wilcoxon test. Error bars indicate standard error. The investigation of structural distances was effected upon controlling for sequence identity. Only regions with sequence identity 85–95% were considered in this analysis, while the regions with sequence identity < 85%, for which the distance between structures does not differ from randomly selected mRNA pairs as well as the regions with sequence identity > 95%, among which almost no high Tm regions exists, were excluded from consideration.
Figure 4.
Figure 4.
Schematic illustration of the conservation levels of high/low Tm regions and thermo-stable/meltable positions. The alignment of two mRNAs is shown on the top. The low Tm region displays a higher sequence identity than the high Tm region (92 versus 60%). When all thermo-stable and meltable positions are considered together, the thermo-stable positions show a higher conservation level than the meltable positions (75 versus 71.9%). When the thermo-stable and the meltable positions located in high Tm and low Tm regions are considered separately, the meltable positions in the low Tm region are most conserved (90%), followed by the thermo-stable positions in the high Tm region (80%), while the meltable positions in the high Tm region are least conserved (40%).
Figure 5.
Figure 5.
Conservation levels of thermo-stable and meltable positions in high/low Tm regions. Positions in high Tm and low Tm regions are examined separately. In high Tm regions the thermo-stable positions exhibit higher sequence conservation than meltable positions (Z-test for two proportions, P-value = 1.3e-6), while in low Tm regions meltable positions display a very high conservation level (Z-test for two proportions, P-value = 2.3e-37) and thermo-stable position are completely absent.
Figure 6.
Figure 6.
Most low Tm regions exhibit negative ΔpS values while most high Tm regions exhibit positive ΔpS values. The differences are significant according to chi-squared test. Error bars indicate standard error.
Figure 7.
Figure 7.
Melting temperatures of high Tm regions (boxplot and grey dots) and experimentally validated structure elements (black triangles).
Figure 8.
Figure 8.
(A) Summary of the findings about high Tm and low Tm regions. (B) Inferences based on these findings.

Similar articles

Cited by

References

    1. Kertesz M., Wan Y., Mazor E., Rinn J.L., Nutter R.C., Chang H.Y., Segal E.. Genome-wide measurement of RNA secondary structure in yeast. Nature. 2010; 467:103–107. - PMC - PubMed
    1. Arava Y., Wang Y., Storey J.D., Liu C.L., Brown P.O., Herschlag D.. Genome-wide analysis of mRNA translation profiles in Saccharomyces cerevisiae. Proc. Natl. Acad. Sci. U.S.A. 2003; 100:3889–3894. - PMC - PubMed
    1. Wang Y., Liu C.L., Storey J.D., Tibshirani R.J., Herschlag D., Brown P.O.. Precision and functional specificity in mRNA decay. Proc. Natl. Acad. Sci. U.S.A. 2002; 99:5860–5865. - PMC - PubMed
    1. Takizawa P.A., DeRisi J.L., Wilhelm J.E., Vale R.D.. Plasma membrane compartmentalization in yeast by messenger RNA transport and a septin diffusion barrier. Science. 2000; 290:341–344. - PubMed
    1. Shepard K.A, Gerber A.P., Jambhekar A., Takizawa P.A., Brown P.O., Herschlag D., DeRisi J.L., Vale R.D.. Widespread cytoplasmic mRNA transport in yeast: identification of 22 bud-localized transcripts using DNA microarray analysis. Proc. Natl. Acad. Sci. U.S.A. 2003; 100:11429–11434. - PMC - PubMed