. 2017 Jun 20;45(11):e95.
doi: 10.1093/nar/gkx133.

Defining the 5΄ and 3΄ landscape of the Drosophila transcriptome with Exo-seq and RNaseH-seq

Affiliations

Defining the 5΄ and 3΄ landscape of the Drosophila transcriptome with Exo-seq and RNaseH-seq

Shaked Afik et al. Nucleic Acids Res. .

Abstract

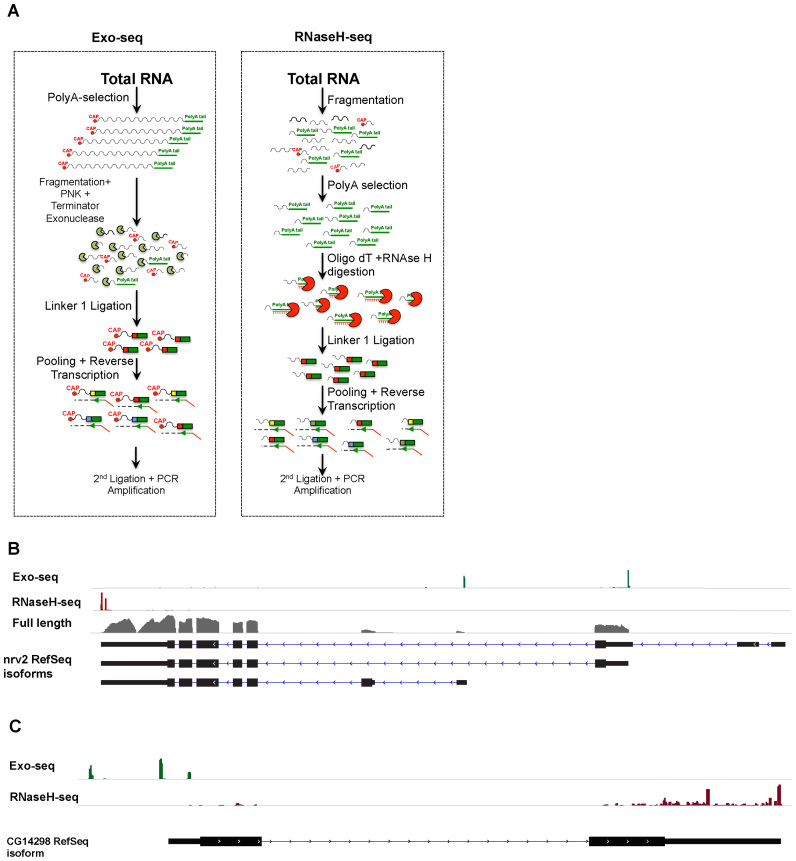
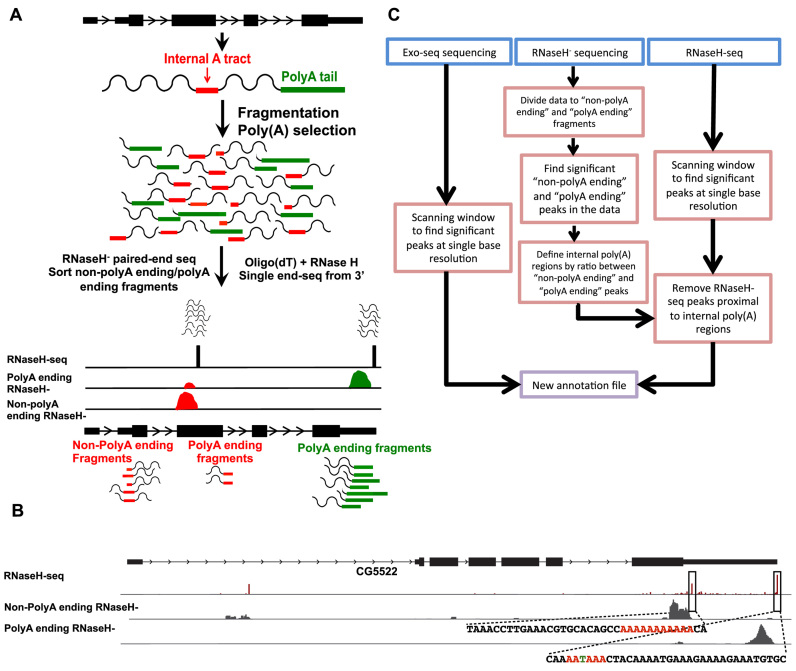
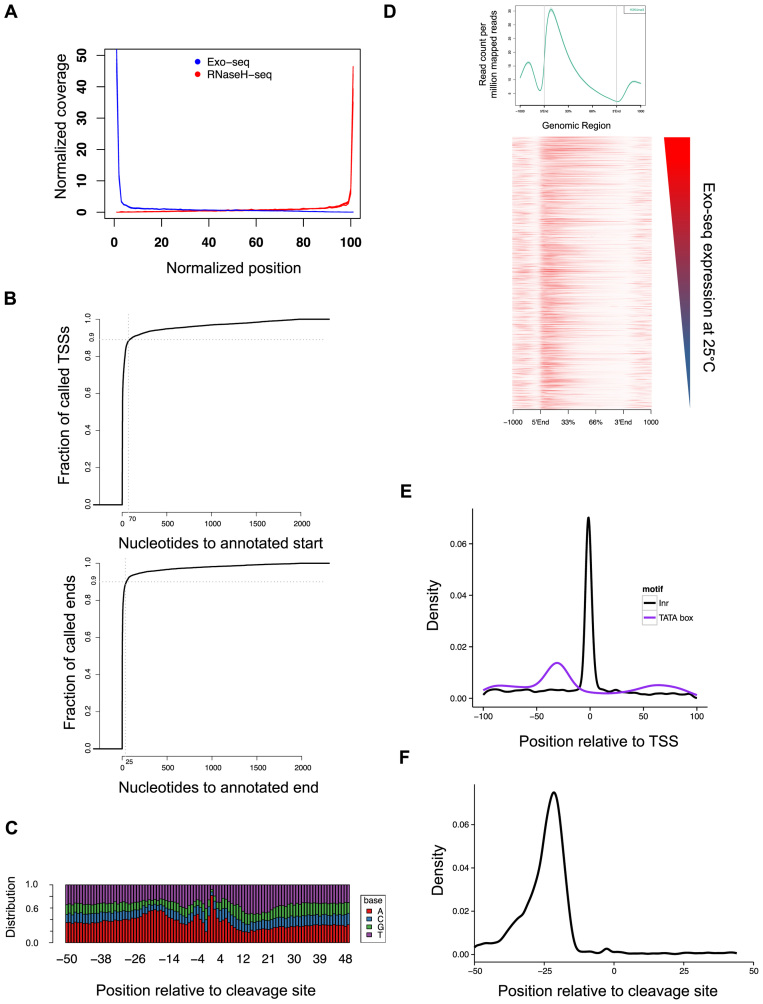
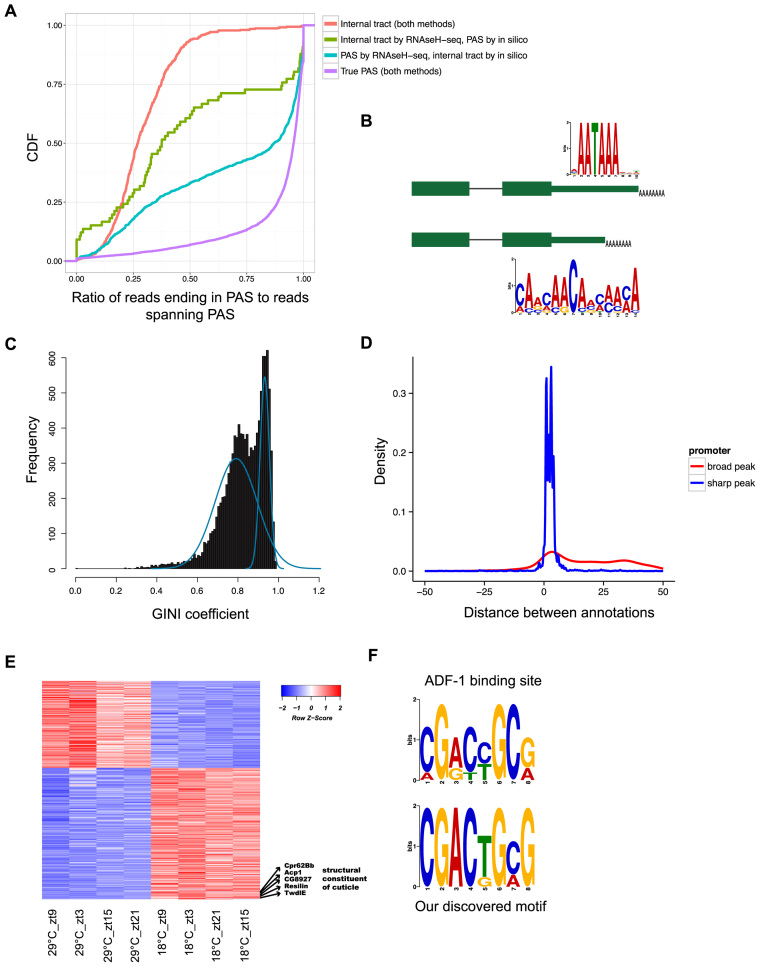
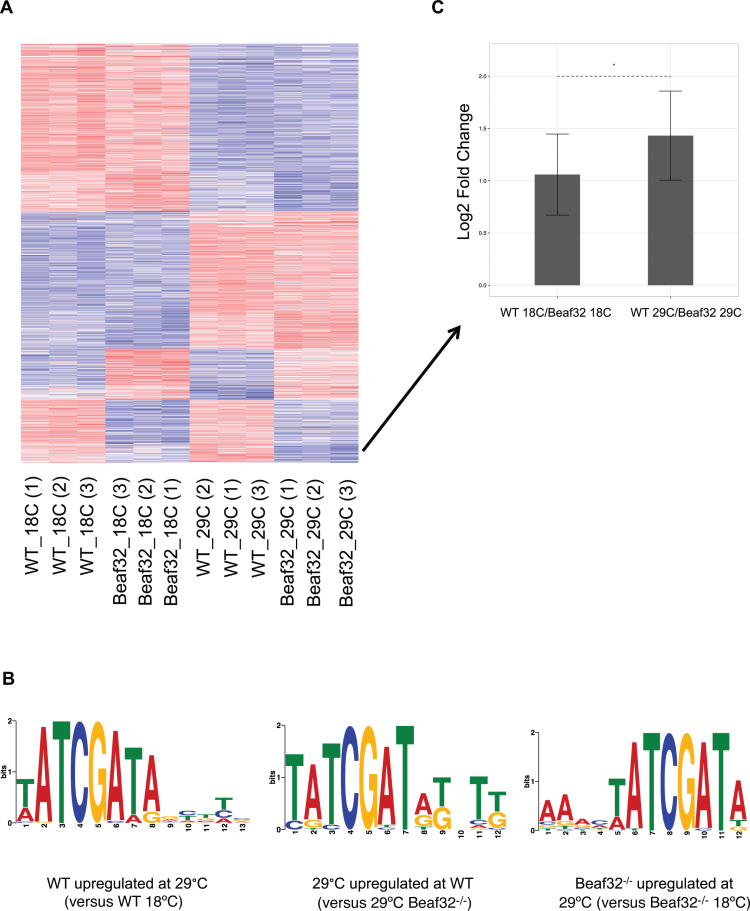
Cells regulate biological responses in part through changes in transcription start sites (TSS) or cleavage and polyadenylation sites (PAS). To fully understand gene regulatory networks, it is therefore critical to accurately annotate cell type-specific TSS and PAS. Here we present a simple and straightforward approach for genome-wide annotation of 5΄- and 3΄-RNA ends. Our approach reliably discerns bona fide PAS from false PAS that arise due to internal poly(A) tracts, a common problem with current PAS annotation methods. We applied our methodology to study the impact of temperature on the Drosophila melanogaster head transcriptome. We found hundreds of previously unidentified TSS and PAS which revealed two interesting phenomena: first, genes with multiple PASs tend to harbor a motif near the most proximal PAS, which likely represents a new cleavage and polyadenylation signal. Second, motif analysis of promoters of genes affected by temperature suggested that boundary element association factor of 32 kDa (BEAF-32) and DREF mediates a transcriptional program at warm temperatures, a result we validated in a fly line where beaf-32 is downregulated. These results demonstrate the utility of a high-throughput platform for complete experimental and computational analysis of mRNA-ends to improve gene annotation.


Figures

Figure 1.
Figure 1.
Exo-seq and RNaseH-seq enrich 5΄ and 3΄ mRNA ends respectively. (A) Schematic representation of our method for isolating 5΄ (Exo-seq) and 3΄ (RNaseH-seq) transcript-ends. (B) An Integrative Genome Viewer plot showing data coverage of the nirvana-2 (nrv2) gene with Exo-seq and RNaseH-seq on RNA extracted from Drosophila heads cultured at three different temperatures (18, 25 and 29°C), together with full-length RNA-seq at 25°C. (C) An Integrative Genome Viewer plot of Exo-seq and RNaseH-seq of the CG14298 gene showing multiple (and previously unknown) TSS (upper track) and PAS (lower track).
Figure 2.
Figure 2.
Experimental procedure for identifying internal poly(A) tracts. (A) Schematic representation of our strategy. RNaseH reads are sorted to ‘non-polyA ending’ or ‘polyA ending’ reads based on the last few bases of the 3΄ fragments. Then, each group of reads is aligned to the genome separately. A genomic site is classified as a peak of ‘non-polyA ending’ reads based on the ratio of ‘non-polyA ending’ to ‘polyA ending’ aligned reads. (B) An Integrative Genome Viewer plot of the CG5522 gene. Upper track—RNaseH-seq aligned reads. Middle track—reads from RNaseH libraries not ending with a poly(A) sequence (‘non-polyA ending’ reads). Lower track—reads from RNaseH libraries ending with a poly(A) sequence (‘polyA ending’ reads). Sequences for the regions surrounding a real gene-end and an internal poly(A) are shown. Colored bases indicate key features: the internal poly(A) tract and the canonical cleavage and polyadenylation site (PAS). (C) Summary of the computational pipeline utilized for generating the new annotation incorporating the newly characterized 5΄ and 3΄ mRNA ends.
Figure 3.
Figure 3.
Validation of the Exo-seq and RNaseH-seq methods. (A) Exo-seq and RNaseH-seq show enrichment for annotated transcript ends. The graph represents the normalized coverage across all genes. The plot includes data from 12 Exo-seq libraries and 6 RNaseH-seq libraries. (B) Distance of the closest annotation determined by Exo-seq (upper panel) or RNaseH-seq (lower panel) to the published modEncdoe annotation. (C) Base distribution of 3΄-end regions of RNaseH-seq annotated genes that differ from the modEncode annotation in 1–5 bases. (D) Average profile (top) and heatmap of the distribution of H3K4me3 ChIP-seq reads (bottom). Average profile is based on read distribution across all gene annotations, while the heatmap presents the top 5000 highly expressed genes at 25°C, sorted by expression. (E and F) Distribution of the position of known motifs with respect to discovered transcript ends: promoter motifs TATAWA (TATA box) and TCAKT [initiation motif (Inr); E] and the canonical cleavage site AAUAAA (F).
Figure 4.
Figure 4.
RNaseH-seq and Exo-seq uncover alternative end-RNA processing signals and enriched motifs. (A) Cumulative density function of the ratio of reads that end in a PAS to reads spanning the PAS in each one of the following groups: peaks classified as internal tracts both by RNaseH-seq and the common in silico method (red), peaks classified as true PAS by both methods (purple), peaks classified as true PAS by RNaseH-seq but as internal tracts in silico (light blue) and peaks classified as internal tracts by RNaseH-seq but as true PAS in silico (green). (B) Genes with alternative 3΄-ends in the last exon are enriched for different RNA motifs. The longer transcripts are enriched for the canonical cleavage and PAS while the shorter transcripts are enriched for a newly identified motif near the 3΄-end. (C) Histogram of the Gini coefficients in 50 base windows around predicted TSS, the curves (in blue) are the bi-modal fit of two Gaussian distributions. (D) Distribution of the distance to modEncode annotated TSS of Exo-seq-predicted TSSs having low Gini coefficient (<0.78, ‘broad’ promoter, red) and high Gini coefficient (>0.9, ‘sharp’ promoters, blue). (E) Heatmap of the Exo-seq expression values for 540 differentially expressed genes between 18 and 29°C. Several of the genes involved in cuticle formation are highlighted. (F) The known ADF-1 binding motif (top) compared to the motif found in the core promoter of genes upregulated in 18°C (bottom).
Figure 5.
Figure 5.
BEAF-32 is active at the transcriptional response at 29°C. (A) Heatmap of differentially expressed genes between 18 and 29°C at wild-type or beaf32−/− samples, or between wild-type and beaf32−/− samples at 18 or 29°C. A gene was included in the heatmap if it had an adjusted P-value < 0.1 and log2 fold change >0.75 in at least one of the pairwise comparison. (B) The motif enriched in genes upregulated at 29°C in wild-type flies versus 18°C wild-type (left), compared with the enriched motif in genes upregulated at 29°C wild-type versus 29°C beaf32−/− flies (middle) and the enriched motif in genes upregulated at 29°C beaf32−/− flies versus beaf32−/− at 18°C (right). (C) Log2 Fold Change at 18 and 29°C between the wild-type and beaf32−/− samples of the genes upregulated at 29°C wild-type versus 29°C beaf32−/− and harbor the BEAF-32 binding motif at their promoter. Arrow represents the location of most of those genes on the heatmap. Asterisk represents P-value < 0.05 between the distributions of the fold change using a t-test. Error bar represents the standard deviation.

References

    1. Yosef N., Regev A.. Impulse control: temporal dynamics in gene transcription. Cell. 2011; 144:886–896. - PMC - PubMed
    1. Moore M.J. From birth to death: the complex lives of eukaryotic mRNAs. Science. 2005; 309:1514–1518. - PubMed
    1. Carninci P., Kasukawa T., Katayama S., Gough J., Frith M.C., Maeda N., Oyama R., Ravasi T., Lenhard B., Wells C.. The transcriptional landscape of the mammalian genome. Science. 2005; 309:1559–1563. - PubMed
    1. Davuluri R. V, Suzuki Y., Sugano S., Plass C., Huang T.H.-M.. The functional consequences of alternative promoter use in mammalian genomes. Trends Genet. 2008; 24:167–177. - PubMed
    1. Elkon R., Ugalde A.P., Agami R.. Alternative cleavage and polyadenylation: extent, regulation and function. Nat. Rev. Genet. 2013; 14:496–506. - PubMed