Transcriptomic insights into the genetic basis of mammalian limb diversity
- PMID: 28335721
- PMCID: PMC5364624
- DOI: 10.1186/s12862-017-0902-6
Transcriptomic insights into the genetic basis of mammalian limb diversity
Abstract
Background: From bat wings to whale flippers, limb diversification has been crucial to the evolutionary success of mammals. We performed the first transcriptome-wide study of limb development in multiple species to explore the hypothesis that mammalian limb diversification has proceeded through the differential expression of conserved shared genes, rather than by major changes to limb patterning. Specifically, we investigated the manner in which the expression of shared genes has evolved within and among mammalian species.
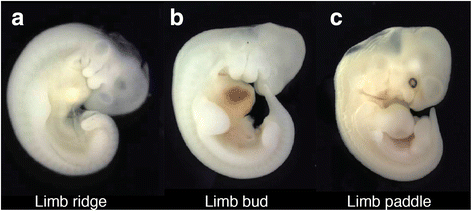
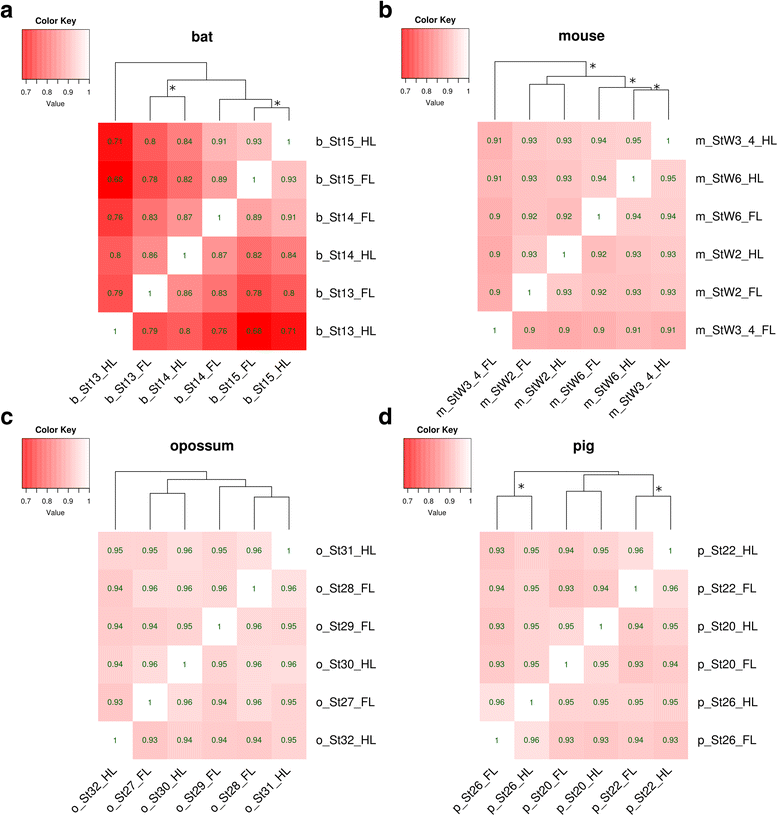
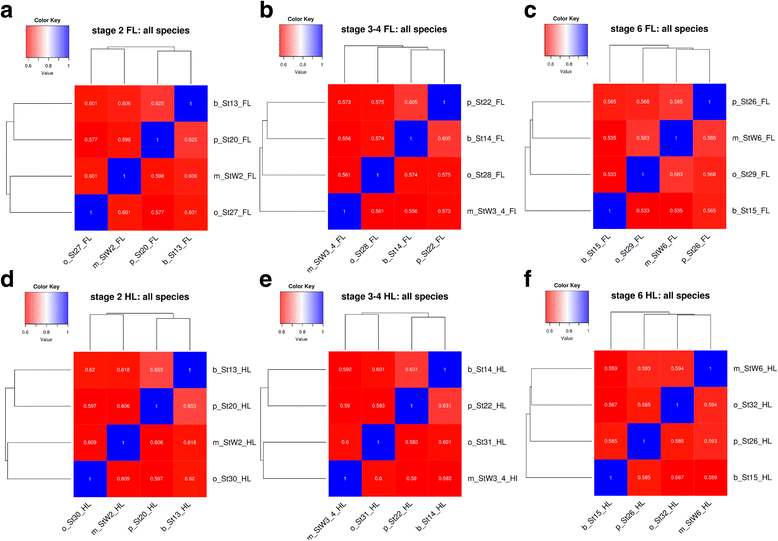
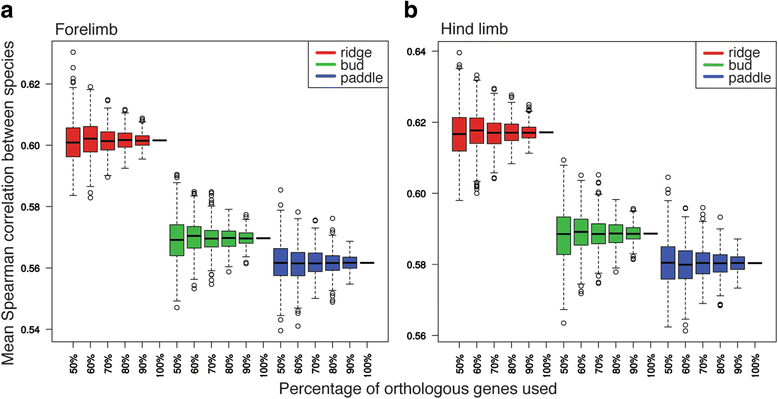
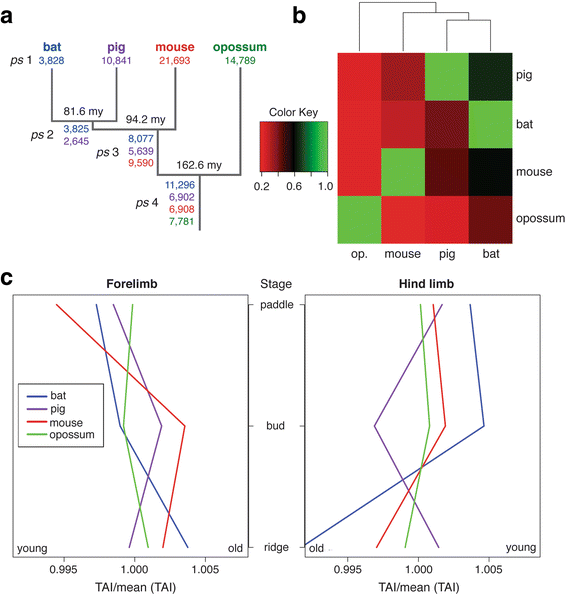
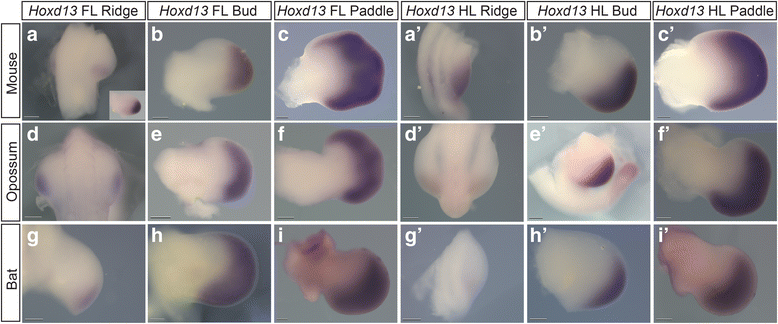
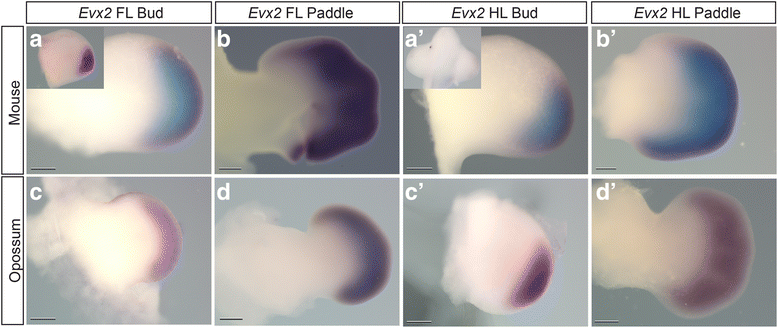
Results: We assembled and compared transcriptomes of bat, mouse, opossum, and pig fore- and hind limbs at the ridge, bud, and paddle stages of development. Results suggest that gene expression patterns exhibit larger variation among species during later than earlier stages of limb development, while within species results are more mixed. Consistent with the former, results also suggest that genes expressed at later developmental stages tend to have a younger evolutionary age than genes expressed at earlier stages. A suite of key limb-patterning genes was identified as being differentially expressed among the homologous limbs of all species. However, only a small subset of shared genes is differentially expressed in the fore- and hind limbs of all examined species. Similarly, a small subset of shared genes is differentially expressed within the fore- and hind limb of a single species and among the forelimbs of different species.
Conclusions: Taken together, results of this study do not support the existence of a phylotypic period of limb development ending at chondrogenesis, but do support the hypothesis that the hierarchical nature of development translates into increasing variation among species as development progresses.
Keywords: Bat; Differential expression; Diversification; Limb; Mammalian; Mouse; Opossum; Pig; Transcriptome.
Figures

Similar articles
-
Disparate Igf1 expression and growth in the fore- and hind limbs of a marsupial mammal (Monodelphis domestica).J Exp Zool B Mol Dev Evol. 2012 Jun;318(4):279-93. doi: 10.1002/jez.b.22444. J Exp Zool B Mol Dev Evol. 2012. PMID: 22821864
-
Timing the developmental origins of mammalian limb diversity.Genesis. 2018 Jan;56(1). doi: 10.1002/dvg.23079. Epub 2017 Nov 2. Genesis. 2018. PMID: 29095555
-
Differential expression of Meis2, Mab21l2 and Tbx3 during limb development associated with diversification of limb morphology in mammals.PLoS One. 2014 Aug 28;9(8):e106100. doi: 10.1371/journal.pone.0106100. eCollection 2014. PLoS One. 2014. PMID: 25166052 Free PMC article.
-
The evolution and development of mammalian flight.Wiley Interdiscip Rev Dev Biol. 2012 Sep-Oct;1(5):773-9. doi: 10.1002/wdev.50. Epub 2012 Apr 4. Wiley Interdiscip Rev Dev Biol. 2012. PMID: 23799572 Review.
-
Genetic regulation of mammalian diversity.Cold Spring Harb Symp Quant Biol. 2009;74:297-302. doi: 10.1101/sqb.2009.74.035. Epub 2009 Dec 22. Cold Spring Harb Symp Quant Biol. 2009. PMID: 20028846 Free PMC article. Review.
Cited by
-
Comparative analysis reveals epigenomic evolution related to species traits and genomic imprinting in mammals.Innovation (Camb). 2023 Apr 28;4(3):100434. doi: 10.1016/j.xinn.2023.100434. eCollection 2023 May 15. Innovation (Camb). 2023. PMID: 37215528 Free PMC article.
-
Cross-species comparisons and in vitro models to study tempo in development and homeostasis.Interface Focus. 2021 Apr 16;11(3):20200069. doi: 10.1098/rsfs.2020.0069. eCollection 2021 Jun 6. Interface Focus. 2021. PMID: 34055305 Free PMC article. Review.
-
Diversification of the vertebrate limb: sequencing the events.Curr Opin Genet Dev. 2021 Aug;69:42-47. doi: 10.1016/j.gde.2021.02.005. Epub 2021 Feb 26. Curr Opin Genet Dev. 2021. PMID: 33647833 Free PMC article. Review.
-
Developmental and Evolutionary Allometry of the Mammalian Limb Skeleton.Integr Comp Biol. 2019 Nov 1;59(5):1356-1368. doi: 10.1093/icb/icz082. Integr Comp Biol. 2019. PMID: 31180500 Free PMC article. Review.
-
Timing of organogenesis underscores the evolution of neonatal life histories and powered flight in bats.Proc Biol Sci. 2023 Jan 11;290(1990):20221928. doi: 10.1098/rspb.2022.1928. Epub 2023 Jan 11. Proc Biol Sci. 2023. PMID: 36629110 Free PMC article.
References
MeSH terms
LinkOut - more resources
Full Text Sources
Other Literature Sources
Molecular Biology Databases

