. 2017 Mar 23;10(1):136.
doi: 10.1186/s13104-017-2455-6.

Gene expression differences between PAXgene and Tempus blood RNA tubes are highly reproducible between independent samples and biobanks

Affiliations

Gene expression differences between PAXgene and Tempus blood RNA tubes are highly reproducible between independent samples and biobanks

Anne Heidi Skogholt et al. BMC Res Notes. .

Abstract

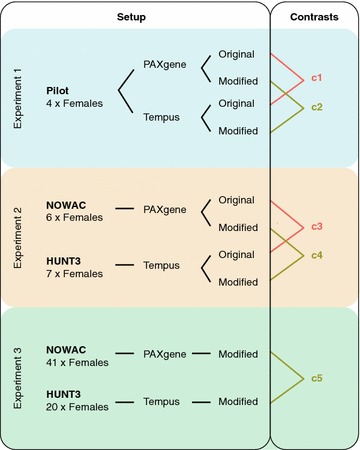
Background: Gene expression profiling from blood is sensitive to technology choices. For example, the main blood RNA collection systems-the PAXgene and Tempus tubes-differently influence RNA expression signatures. The aim of this study was to establish a common RNA isolation protocol for these two systems and investigate if it could reduce the differences in gene expression between them.

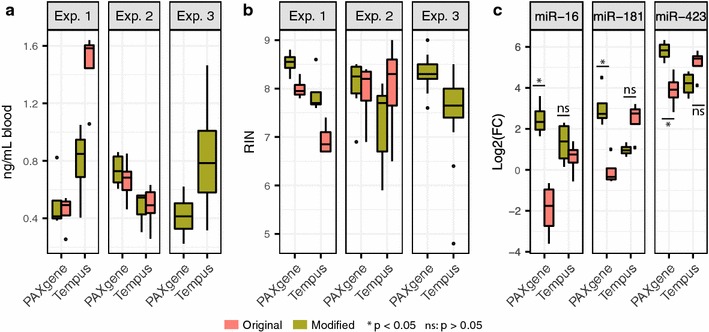
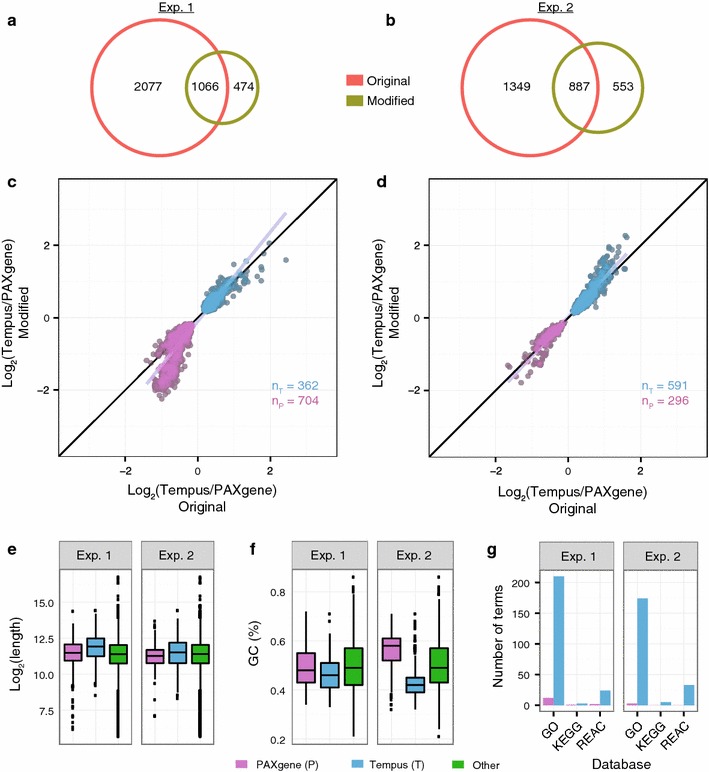
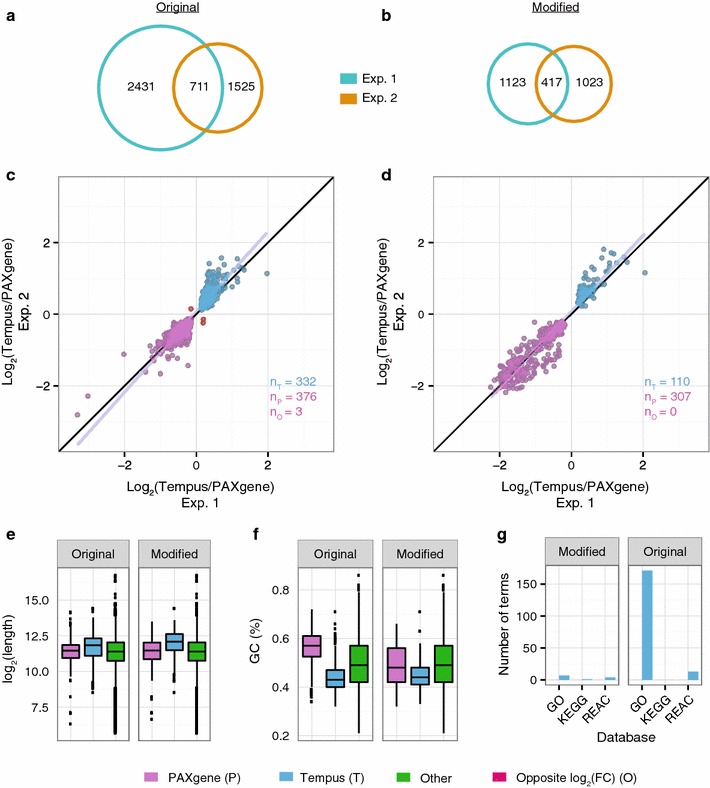
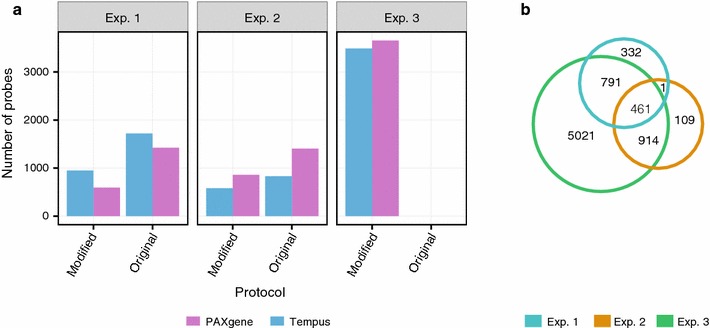
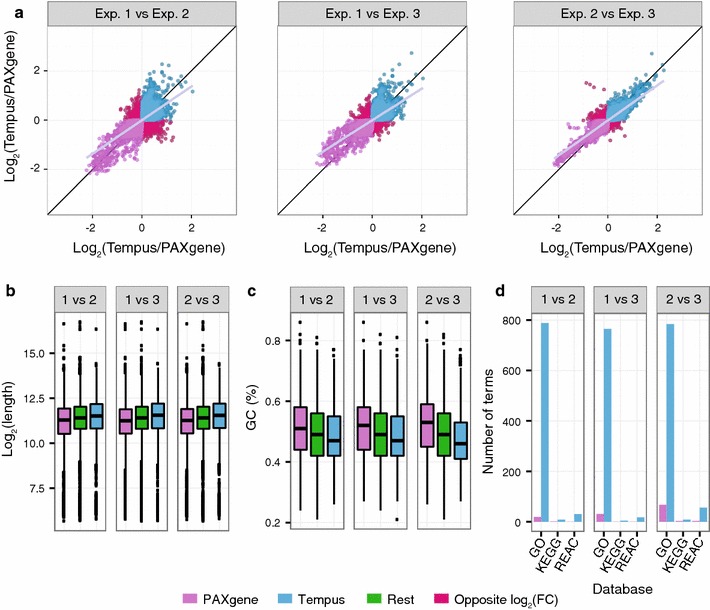
Results: We collected identical blood samples on the PAXgene and Tempus systems and retrieved blood samples from two independent biobanks-NOWAC and HUNT3-which are based on PAXgene and Tempus, respectively. High-quality RNA was extracted from both sampling systems by using their original protocols and our common modified protocol, and were profiled on Illumina microarrays. Regardless of the protocol used, we found most of the measured transcripts to be differently affected by the two sampling systems. However, our modified protocol reduced the number of transcripts that were significantly differentially expressed between PAXgene and Tempus by approximately 50%. Expression differences between PAXgene and Tempus were highly reproducible both between protocols and between different independent sample sets (Pearson correlation 0.563-0.854 across 47323 probes). Moreover, the modified protocol increased the microRNA output of the system with lowest microRNA yield, the PAXgene system.

Conclusions: Most transcripts are affected by the choice of sampling system, but these effects are highly reproducible between independent samples. We propose that by running a control experiment with samples on both systems in parallel with biologically relevant samples, researchers may adjust for technical differences between the sampling systems.

Keywords: Blood samples; Microarray; RNA-isolation; Sampling systems; miRNA.


Figures

Fig. 1
Fig. 1
Study design. Differences in gene expression between PAXgene and Tempus were investigated in three experiments. In experiment 1 (light blue), four volunteers donated blood samples on PAXgene and Tempus tubes and RNA was isolated with both the original protocols and the modified protocol. Paired statistical analyses identified differences between PAXgene and Tempus for the original protocols (contrast 1) and for the modified protocol (contrast 2). In experiment 2 (light orange), RNA was isolated with both the original protocols and the modified protocol from two different biobanks—NOWAC and HUNT3—which had samples on PAXgene and Tempus tubes, respectively. Non-paired statistical analyses identified differences between PAXgene and Tempus for the original protocols (contrast 3) and for the modified protocol (contrast 4). In experiment 3 (light green), RNA was isolated with the modified protocol from a larger set of samples from NOWAC and HUNT3 and a non-paired analysis was performed (contrast 5). Comparisons between PAXgene and Tempus based on the original protocols are highlighted in orange (contrasts 1 and 3), whereas comparisons based on the modified protocol are highlighted in olive green (contrasts 2, 4, and 5)
Fig. 2
Fig. 2
RNA yield and quality. Concentration (a), quality (RIN) (b), and miRNA levels (c) for RNA isolated from Tempus and PAXgene tubes with the original and modified protocols. Concentration and quality measurements are from all three experiments; miRNA levels are miR-16, miR-181, and miR-423 expression levels from experiment 1. The graphs are box-plots of the data, where the box with horizontal black line shows the first and third quartiles and the median; the whiskers show 1.5 times the interquartile range; and the points show outliers
Fig. 3
Fig. 3
Comparison of protocols. a, b Venn diagrams showing the number of microarray probes having significantly different signals (p < 0.05) between PAXgene and Tempus systems for the original protocols (orange) and the modified protocol (olive) in experiment 1 (a) and experiment 2 (b). c, d Scatter plots showing the logFC values of the 1066 and 887 significant probes found in common between the protocols in experiment 1 (c) and in experiment 2 (d), respectively. Grey and black lines are linear regression fits to the data and idealized regression lines (logFC original = logFC modified), respectively. e Length and f GC content of transcripts preserved in PAXgene (logFC <0; purple) and in Tempus (logFC >0; blue) from c and d. All other transcripts (“Other”; green) are included as reference. See Fig. 2 for explanation of graphs. g The number of significantly enriched biological terms for transcripts preserved in the PAXgene and Tempus tubes
Fig. 4
Fig. 4
Reproducibility. a, b Venn diagrams showing the overlap in microarray probes having significantly different signals (p < 0.05) between PAXgene and Tempus systems for experiment 1 (turquoise) and experiment 2 (orange) for the original protocols (a) and the modified protocol (b). c, d Scatter plots showing the logFC values of the 711 and 417 significant probes found in common between experiment 1 and 2 for the original protocols (c) and for the modified protocol (d), respectively. e Length, f GC content, and g number of significantly enriched biological terms of transcripts preserved in PAXgene (purple) and in Tempus (blue) from c and d; see Fig. 2 for additional details
Fig. 5
Fig. 5
Comparison of the significant probes across the three experiments. a Number of probes preserved in PAXgene (logFC <0; purple) and Tempus (logFC >0; blue) for the original protocols and the modified protocol in all three experiments. b Venn diagram of microarray probes having significantly different signals (p < 0.05) between PAXgene and Tempus for the modified protocol across all three experiments
Fig. 6
Fig. 6
Signal changes and physical characteristics of all probes present on the Illumina HT-12 v4 chip. a Scatter plots showing for all probes on the Illumina HT-12 v4 chip, their logFC values from the comparisons of PAXgene and Tempus with the modified protocol on all three experiments. b Length, c GC content, and d number of significantly enriched biological terms of transcripts consistently preserved in PAXgene (purple) and Tempus (blue) from (a)

References

    1. Hashimoto S, Nagai S, Sese J, Suzuki T, Obata A, Sato T, et al. Gene expression profile in human leukocytes. Blood. 2003;101:3509–3513. doi: 10.1182/blood-2002-06-1866. - DOI - PubMed
    1. Calvano SE, Xiao W, Richards DR, Felciano RM, Baker HV, Cho RJ, et al. A network-based analysis of systemic inflammation in humans. Nature. 2005;437:1032–1037. doi: 10.1038/nature03985. - DOI - PubMed
    1. Kabanova S, Kleinbongard P, Volkmer J, Andrée B, Kelm M, Jax TW. Gene expression analysis of human red blood cells. Int J Med Sci. 2009;6:156–159. doi: 10.7150/ijms.6.156. - DOI - PMC - PubMed
    1. Chaussabel D, Pascual V, Banchereau J. Assessing the human immune system through blood transcriptomics. BMC Biol. 2010;8:84. doi: 10.1186/1741-7007-8-84. - DOI - PMC - PubMed
    1. Pascual V, Chaussabel D, Banchereau J. A genomic approach to human autoimmune diseases. Annu Rev Immunol. 2010;28:535–571. doi: 10.1146/annurev-immunol-030409-101221. - DOI - PMC - PubMed

MeSH terms

LinkOut - more resources