. 2017 May 15:118:209-222.
doi: 10.1016/j.neuropharm.2017.03.017. Epub 2017 Mar 20.

M1 muscarinic activation induces long-lasting increase in intrinsic excitability of striatal projection neurons

Affiliations

M1 muscarinic activation induces long-lasting increase in intrinsic excitability of striatal projection neurons

Xiaohui Lv et al. Neuropharmacology. .

Abstract

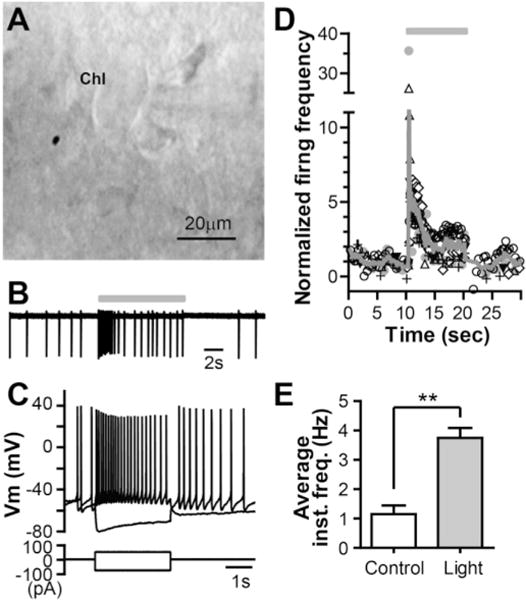
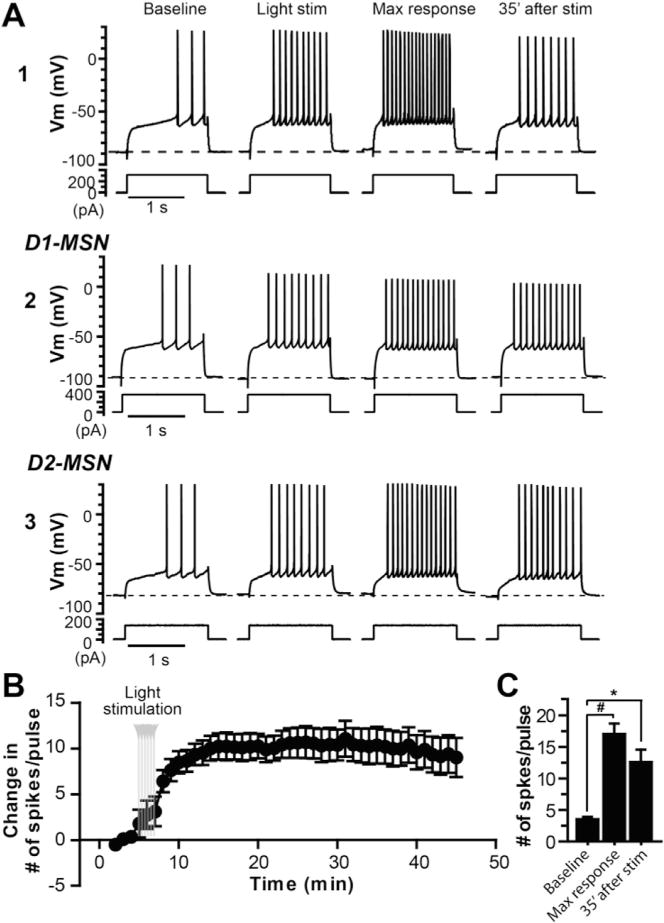
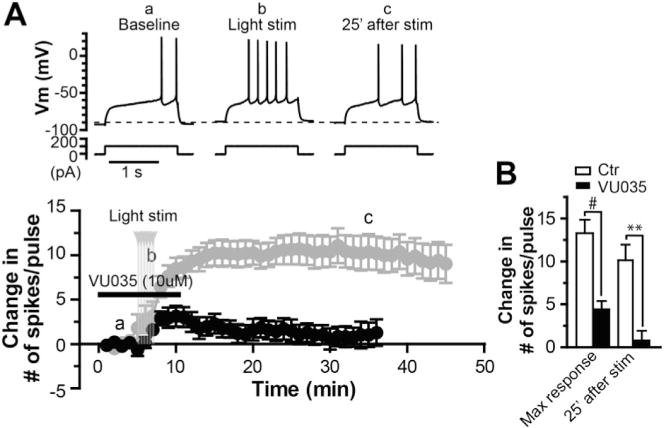
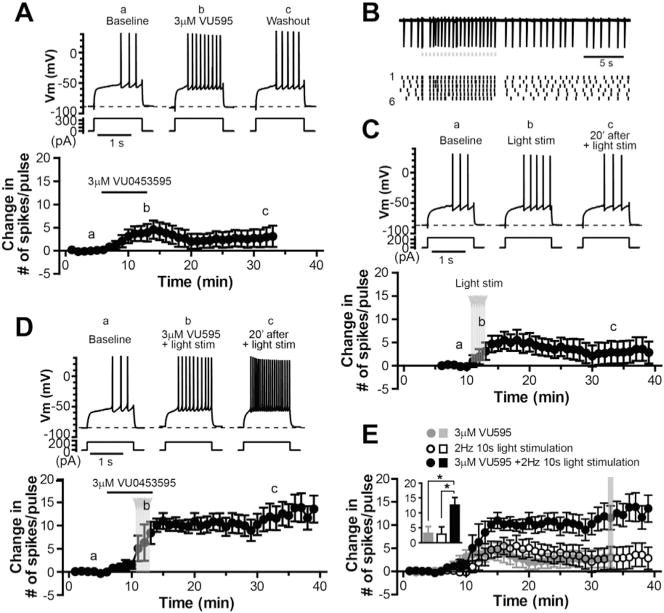
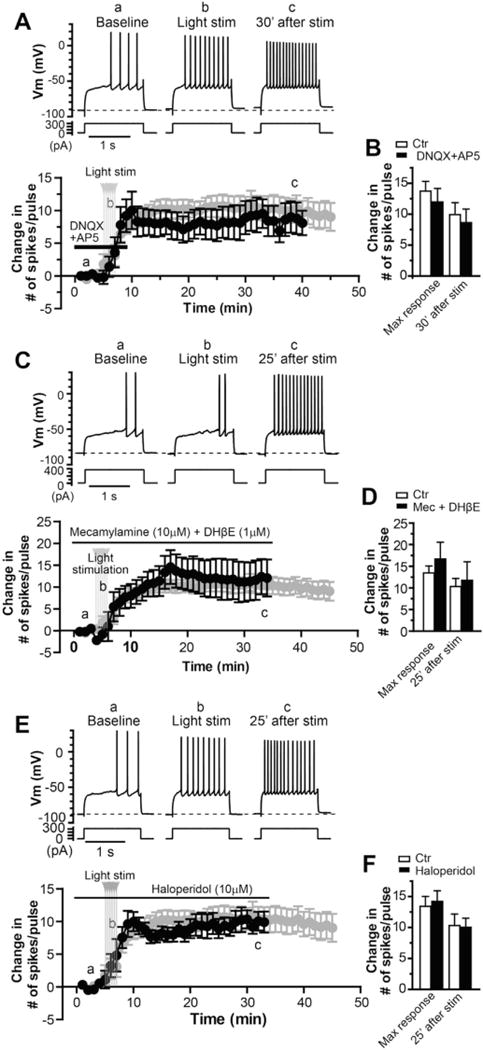
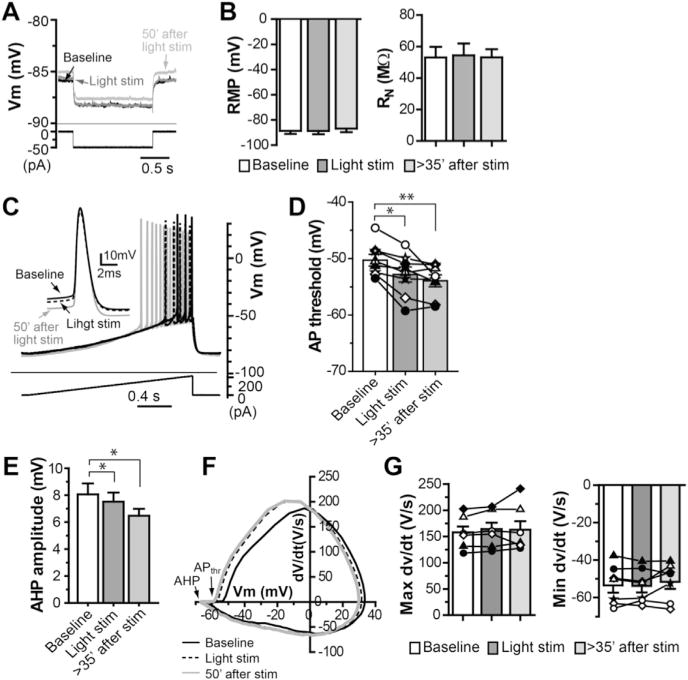
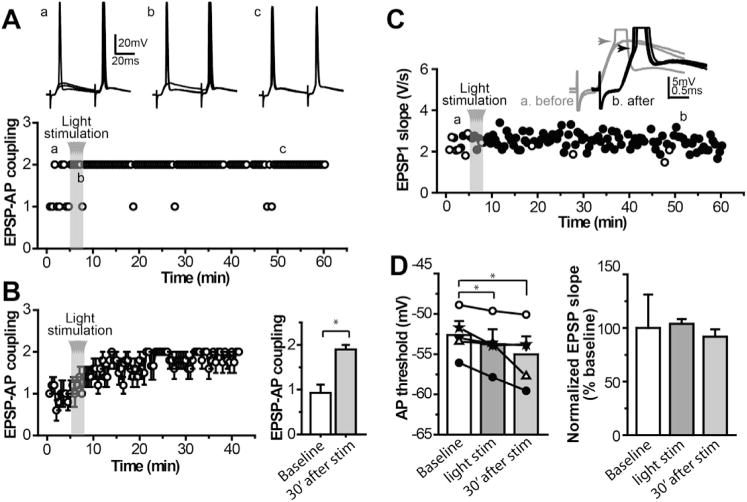
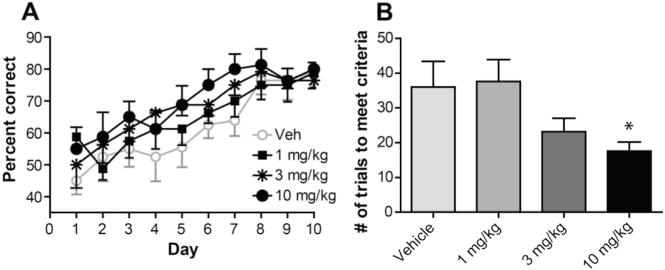
The dorsolateral striatum is critically involved in movement control and motor learning. Striatal function is regulated by a variety of neuromodulators including acetylcholine. Previous studies have shown that cholinergic activation excites striatal principal projection neurons, medium spiny neurons (MSNs), and this action is mediated by muscarinic acetylcholine subtype 1 receptors (M1) through modulating multiple potassium channels. In the present study, we used electrophysiology techniques in conjunction with optogenetic and pharmacological tools to determine the long-term effects of striatal cholinergic activation on MSN intrinsic excitability. A transient increase in acetylcholine release in the striatum by optogenetic stimulation resulted in a long-lasting increase in excitability of MSNs, which was associated with hyperpolarizing shift of action potential threshold and decrease in afterhyperpolarization (AHP) amplitude, leading to an increase in probability of EPSP-action potential coupling. The M1 selective antagonist VU0255035 prevented, while the M1 selective positive allosteric modulator (PAM) VU0453595 potentiated the cholinergic activation-induced persistent increase in MSN intrinsic excitability, suggesting that M1 receptors are critically involved in the induction of this long-lasting response. This M1 receptor-dependent long-lasting change in MSN intrinsic excitability could have significant impact on striatal processing and might provide a novel mechanism underlying cholinergic regulation of the striatum-dependent motor learning and cognitive function. Consistent with this, behavioral studies indicate that potentiation of M1 receptor signaling by VU0453595 enhanced performance of mice in cue-dependent water-based T-maze, a dorsolateral striatum-dependent learning task.

Keywords: AP-EPSP coupling; Dorsolateral striatum-dependent learning; Intrinsic plasticity; M(1) muscarinic receptor; Striatal MSNs.


Conflict of interest statement

Conflict of interest

J.M.R., C.W.L. and P.J.C. are inventors on multiple composition of matter patents protecting allosteric modulators of M1.

Figures

Fig. 1
Fig. 1. Optogenetic activation of cholinergic interneurons expressing mhChR2::YFP fusion protein
A. Image of a striatal cholinergic interneuron (ChI) under Hoffman modulation contrast microscopy. B. Representative trace of ChI firing in a slice taken from a ChAT-ChR2-EYFP mouse during control and light stimulation (470 nm, 4.7 mW/mm2, 10 s; indicated by the grey bar) under cell-attached configuration. C. Whole-cell current clamp recordings from the same cell as in B after rupturing the membrane, showing the typical voltage responses of ChIs to depolarizing and hyperpolarizing current injections. D. Time course of firing frequency of ChIs in response to light stimulation (indicated by a grey bar). Different symbols represent different cells (n = 6) and each symbol represents instantaneous firing frequency of action potential normalized to the mean value before light stimulation. The solid line represents the average firing frequency across six cells. E. Summary of the effect of light stimulation on the average instantaneous firing frequency of ChIs (**p = 0.0005, n = 6, paired t-test).
Fig. 2
Fig. 2. Optogenetic activation of striatal cholinergic system induces long-lasting increase in excitability of MSNs
A. Sample traces of membrane potential responses to a depolarization current step from an MSN from a ChAT-ChR2-EYFP mouse (A1), a D1-MSN (A2) and a putative D2-MSN (non-D1, A3) from ChAT-ChR2-EYFP:Drd1a-tdTomato mice before, during and after cholinergic activation by blue laser light stimulation (4.7 mW, 10s in duration, repeated 6 times every 30 s). B. Average time course of change in number of spikes per pulse in response to the depolarization current step from group data pooled from D1, putative D2, and non-discriminated MSNs (n = 9). C. Bar graph summarizing the number of spikes per pulse during baseline, maximal response and 35 min after the light stimulation (one-way ANOVA with repeated measures, F(2,26) = 32.84, p < 0.0001, with Dunnett’s post-test, #p < 0.0005).
Fig. 3
Fig. 3. M1 receptor activation is required for the initiation of long-lasting excitation of MSNs induced by endogenous cholinergic activation
A. Sample traces of membrane potential responses to a depolarization current step (upper) and average time course of change in number of spikes per pulse in response to the depolarization current step (lower, black) before, during and after activation of ChIs by blue laser light stimulation in the presence of M1 antagonist VU0255035 (VU035, 10 μM; n = 7), compared with the average time course in control condition (lower, grey). B. Bar graph summarizing the changes of number of spikes per pulse after light stimulation in presence of VU0255035, compared with those in control (#p = 0.0003, **p = 0.0007, t-test).
Fig. 4
Fig. 4. M1 PAM VU0453595 potentiates the effect of submaximal optical stimulation of striatal cholinergic system on MSN excitability
A. Sample traces of membrane potential responses to a given amplitude of depolarization current steps (upper) and average time course of change in number of spike per pulse (lower) before, during and after application of 3 μM VU0453595 (n = 5). B. Sample trace of cell-attached recordings from a ChI in response to a train of 20 light pulse stimuli (grey dots, 50 ms each) at 2 Hz (upper) and raster plot of spike activity from the same ChI as above in response to 6 consecutive trains of light stimulation (lower, the numbers on the left indicate the sweep numbers), showing spikes are fairly well time-locked to the light pulse. C–D. Sample traces (upper) and average time courses of change in number of spike per pulse (lower) before, during and after 6 trains of 2 Hz light stimulation alone (C, n = 8) and in the presence of VU0453595 (D, n = 6). E. Summary time courses and bar graph of change in number of spikes in response to application of 3 μM VU0453595, 2 s Hz 10 s light stimulation, and combination of 3 μM VU0453595 application and the light stimulation, respectively. Data in the bar graph are taken from the time point indicated by the grey line in the time courses (one-way ANOVA, F(2,22) = 4.43, p < 0.05, with Bonferroni’s post-test, *p < 0.05).
Fig. 5
Fig. 5. Activation of ionotropic glutamate receptors, nAChRs or DA receptors is not required for induction of the long-lasting increase in MSN excitability following striatal cholinergic activation
A. Sample traces (upper) and average time course of change in number of spike per pulse (lower, black) before, during and after light stimulation in the presence of 20 μM DNQX and 50 μM AP5 (n = 5), compared with the time course in control (lower, grey, n = 9). B. Bar graph summarizing the effects of optical activation of ChIs on excitability of MSNs in the presence of DNQX and AP5, compared with those in control, presented as maximum change after light stimulation and mean change 25 min after light stimulation (p = 0.52 and p = 0.66, respectively, t-test). C. Sample traces (upper) and average time course of change in number of spike per pulse (lower, black) before, during and after light stimulation in the presence of 10 μM mecamylamine and 1 μM DHβE (n = 5), compared with the time course in control (lower, grey, n = 9). D. Bar graph summarizing the effects of striatal cholinergic activation on excitability of MSNs in the presence of mecamylamine and DHβE, compared with control condition (p = 0.48 and p = 0.77, respectively, t-test). E. Sample traces (upper) and average time course of change in number of spike per pulse (lower, black) before, during and after light stimulation in the presence of 10 μM haloperidol (n = 7), compared with the time course in control (lower, grey, n = 9). F. Bar graph summarizing the effects of striatal cholinergic activation on excitability of MSNs in the presence of haloperidol, compared with control condition (p = 0.79 and p = 0.88, respectively, t-test).
Fig. 6
Fig. 6. Hyperpolarized action potential threshold and decrease in AHP are associated with persistent increase in MSN excitability
A. Sample traces of membrane potential in response to a hyperpolarization current injection (−50 pA) at resting membrane potential (RMP) to assess input resistance (RN) during baseline, light stimulation and 50 min after light stimulation. B. Summary of RMP and RN during baseline, light stimulation and over 35 min after light stimulation (one-way ANOVA with repeated measures, F(2,26) = 2.64, p > 0.1 for RMP; F(2,20) = 0.11, p > 0.5 for RN). C–E. Sample traces of action potentials (APs) elicited by depolarizing ramp current injection (C, inset: the first APs superimposed under different conditions as indicated), summary of AP threshold (D; one-way ANOVA with repeated measures, F(2,20) = 13.89, p < 0.001, with Dunnett’s post-test, **p < 0.005) and summary of AHP amplitude (E; one-way ANOVA with repeated measures, F(2,20) = 7.27, p < 0.01, with Dunnett’s post-test, *p < 0.01) during baseline, light stimulation and over 35 min after light stimulation. F. The rate of membrane potential change (dV/dt) plotted against membrane potential (phase plot) of APs from a typical experiment, demonstrating the changes of AP threshold (APthr) and AHP amplitude after light stimulation. G. Summary of maximal dv/dt and minimal dv/dt of APs during baseline, light stimulation and over 35 min after light stimulation (one-way ANOVA with repeated measures, F(2, 20) = 0.53, p > 0.5 for maximal dv/dt; F(2, 20) = 1.809, p > 0.1 for minimal dv/dt).
Fig. 7
Fig. 7. Persistent increase in EPSP-AP coupling at glutamatergic synapses in MSNs following striatal cholinergic activation
A. Sample traces of subthreshold and supra-threshold EPSPs (upper) and time course of EPSP-action potential coupling (lower) from a typical MSN in response to a pair of electrical stimulation applied to the corpus callosum before, during and after light stimulation, showing the increased EPSP-spike coupling after optogenetic activation of ChIs. B. Average time course and bar graph of EPSP-AP coupling for group data (*p < 0.05, n = 5, paired t-test). C. Time course of EPSP slope from the same cell as in A, showing no apparent change in EPSP slope. Inset: sample traces of subthreshold and suprathreshold EPSPs before and after light stimulation. D. Bar graphs summarizing action potential threshold (left) and normalized EPSP slope (right) before, during and after light stimulation (one-way ANOVA with repeated measures, F(2,14) = 7.503, p < 0.05, with Dunnett’s post-test, **p < 0.01, for AP threshold; F(2,14) = 0.125, p > 0.5, for normalized EPSP slope).
Fig. 8
Fig. 8. M1 PAM VU0453595 enhances cue-dependent non-spatial learning
A. All mice learned the task to about 80 percent efficiency by day 10 of testing. Pretreatment with VU0453595 significantly increased the percent of correct choices made during testing days 1–7 when compared to vehicle treated animals. Data represent mean percent correct ± S.E.M.; p = 0.0013. There were no significant differences between vehicle and VU0453595 treated mice from day 8–10 (p > 0.05). B. All mice met criteria (75 percent correct during one testing session) by day 10 of testing. Mice treated with VU0453595 (10 mg/kg) reached criteria in significantly less trials than vehicle treated mice. Data represent mean number of trials to criteria ±SEM; *p = 0.0316.

Similar articles

Cited by

References

    1. Ade KK, Wan Y, Chen M, Gloss B, Calakos N. An improved BAC transgenic fluorescent reporter line for sensitive and specific identification of striatonigral medium spiny neurons. Front Syst Neurosci. 2011;5:32. - PMC - PubMed
    1. Akins PT, Surmeier DJ, Kitai ST. M1 muscarinic acetylcholine receptor in cultured rat neostriatum regulates phosphoinositide hydrolysis. J Neurochem. 1990a;54:266–273. - PubMed
    1. Akins PT, Surmeier DJ, Kitai ST. Muscarinic modulation of a transient K+ conductance in rat neostriatal neurons. Nature. 1990b;344:240–242. - PubMed
    1. Albin RL, Young AB, Penney JB. The functional anatomy of basal ganglia disorders. Trends Neurosci. 1989;12:366–375. - PubMed
    1. Aosaki T, Kimura M, Graybiel AM. Temporal and spatial characteristics of tonically active neurons of the primate’s striatum. J Neurophysiol. 1995;73:1234–1252. - PubMed

Publication types

MeSH terms