. 2017 Mar 24;355(6331):1306-1311.
doi: 10.1126/science.aag1417.

Lysosomal cholesterol activates mTORC1 via an SLC38A9-Niemann-Pick C1 signaling complex

Affiliations

Lysosomal cholesterol activates mTORC1 via an SLC38A9-Niemann-Pick C1 signaling complex

Brian M Castellano et al. Science. .

Abstract

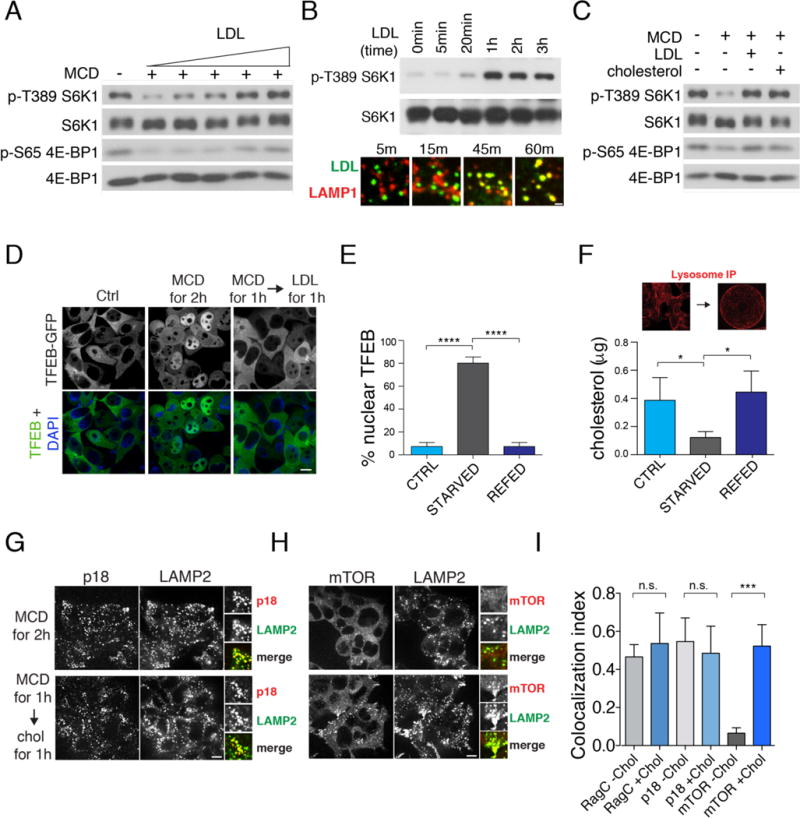
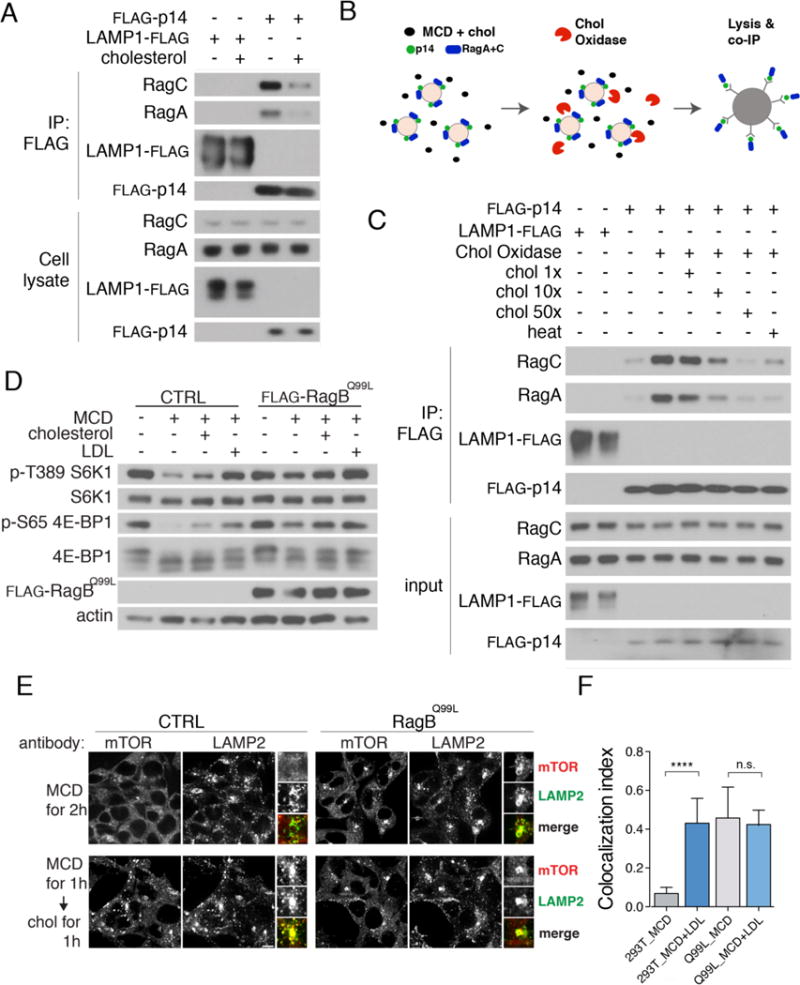
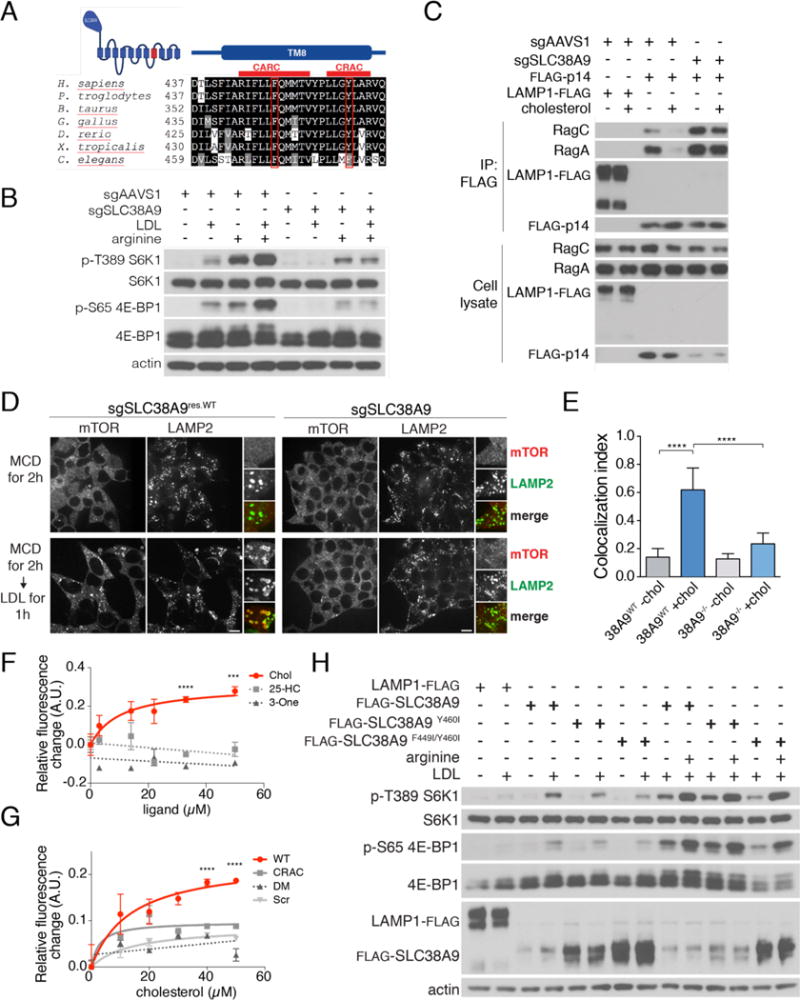
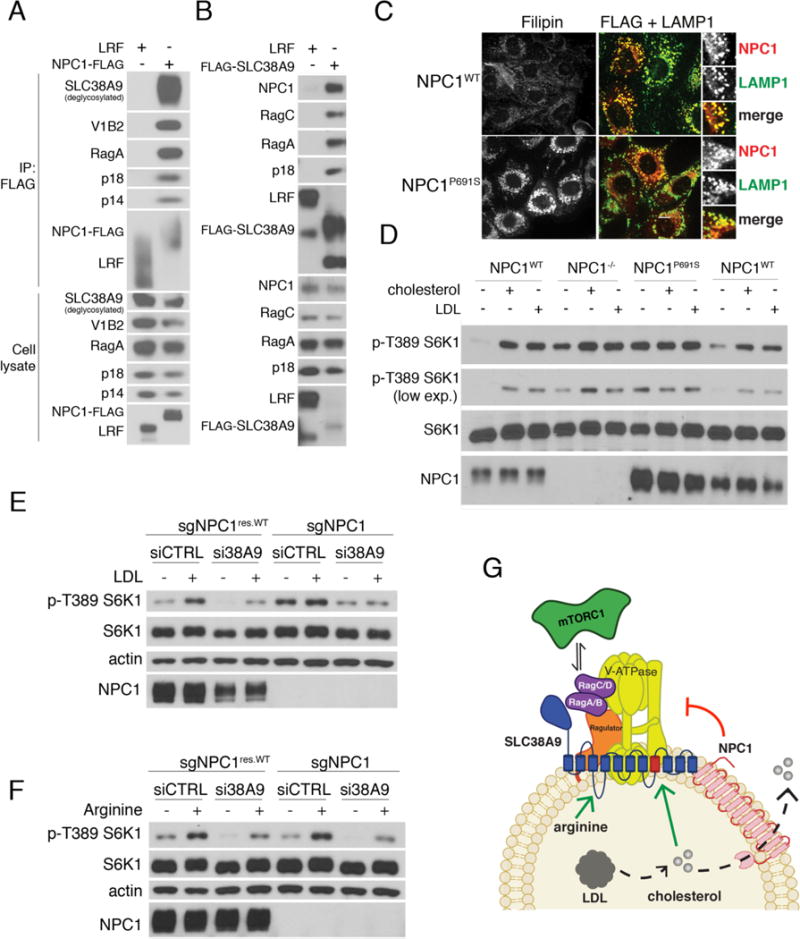
The mechanistic target of rapamycin complex 1 (mTORC1) protein kinase is a master growth regulator that becomes activated at the lysosome in response to nutrient cues. Here, we identify cholesterol, an essential building block for cellular growth, as a nutrient input that drives mTORC1 recruitment and activation at the lysosomal surface. The lysosomal transmembrane protein, SLC38A9, is required for mTORC1 activation by cholesterol through conserved cholesterol-responsive motifs. Moreover, SLC38A9 enables mTORC1 activation by cholesterol independently from its arginine-sensing function. Conversely, the Niemann-Pick C1 (NPC1) protein, which regulates cholesterol export from the lysosome, binds to SLC38A9 and inhibits mTORC1 signaling through its sterol transport function. Thus, lysosomal cholesterol drives mTORC1 activation and growth signaling through the SLC38A9-NPC1 complex.


Figures

Fig. 1
Fig. 1. Lysosomal cholesterol stimulates mTORC1 recruitment and signaling
(A) Dose-dependent activation of mTORC1 by LDL. HEK-293T cells were depleted of sterol with methyl-beta cyclodextrin (MCD, 0.5% w/v) for 2 hours and stimulated for 2 hours with various concentrations (0-100 μg/ml) of LDL. Cell lysates were analyzed for phosphorylation status of S6K1 (T389) and 4E-BP1 (S65) and for total protein abundance. (B) (top) Time-dependent activation of mTORC1 by LDL. HEK-293T cells were depleted of sterol for 2 hours and re-stimulated with LDL (50 μg/ml) for the indicated times. Cell lysates were analyzed for phosphorylation status of S6K (T389). (bottom) Time-course of LDL delivery to the lysosome. Cells stably expressing LAMP1-mRFP-FLAGX2 (LRF) were treated with BODIPY-LDL for the indicated times. Scale bar, 0.5μm (C) Activation of mTORC1 signaling by cholesterol. HEK-293T cells were depleted of sterol for 2 hours and, where indicated, re-stimulated for 2 hours with 50μM MCD:cholesterol or with 50μg/ml LDL where indicated. Phosphorylation of S6K1 and 4E-BP1 are shown. (D) Regulation of TFEB nuclear localization by cholesterol. HEK-293T cells stably expressing TFEB-GFP were depleted of sterol and, where indicated, re-stimulated with LDL (50μg/ml). Scale bar, 10μm. (E) Quantification of TFEB-GFP localization from (D). Shown are mean + SD. N=800 cells. ANOVA: p < 0.0001 followed by Tukey’s t-test: ****p < 0.0001 (F) (top) Lysosomes from LRF-expressing HEK-293T cells were immuno-captured onto FLAG affinity beads. (bottom) Mass spectrometry measurement of unesterified cholesterol in immuno-captured lysosomes from LRF-expressing HEK-293T cells subjected to the indicated treatments. Shown are mean + SD. N=4 samples/condition. ANOVA: p < 0.05 followed by Tukey’s t-test: *p <0.05 (G) Cholesterol status does not affect Ragulator localization to LAMP2-positive lysosomes. HEK-293T cells were subjected to the indicated treatments, followed by immunofluorescence for endogenous p18 and LAMP2. Scale bar, 10μm. (H) Cholesterol regulates mTORC1 recruitment to LAMP2-positive lysosomes. HEK-293T cells were subjected to the indicated treatments, followed by immunofluorescence for endogenous mTOR and LAMP2. Scale bar, 10μm. (I) Quantification of RagC-LAMP2, p18-LAMP2 and mTOR-LAMP2 co-localization under cholesterol-depleted and cholesterol-stimulated conditions. Shown are mean + SD. N=15 cells/condition. ANOVA: p < 0.0001 followed by Tukey’s t-test: ***p < 0.001.
Fig. 2
Fig. 2. Cholesterol regulates the Ragulator-Rag GTPase complex in cells and in vitro
(A) Cholesterol regulates the interaction between Ragulator and Rag GTPases in cells. HEK-293T cells stably expressing FLAG-p14 or LRF were sterol-depleted for 2h and, where indicated, restimulated with MCD:cholesterol for 2h. After lysis, samples were subjected to FLAG immunoprecipitation and immunoblotting for the indicated proteins. (B) Organelle-based in vitro assay. A light organelle preparation from cells stably expressing FLAG-tagged mTORC1 pathway components is treated with cholesterol oxidase in the absence or presence of MCD-cholesterol complex. Interaction with endogenous binding partners is determined by FLAG immunoprecipitation and western blotting following detergent solubilization. (C) Cholesterol regulates the interaction between Ragulator and Rag GTPases in vitro. Light organelle fractions stably expressing FLAG-p14 were treated with cholesterol oxidase (2U/ml) along with increasing concentrations of MCD:cholesterol as indicated. Samples were subjected to lysis and FLAG immunoprecipitation, followed by immunoblotting for the indicated proteins. (D) HEK-293T cells stably expressing the constitutively active RagBQ99L mutant, along with control HEK-293T, were sterol-depleted for 2h, or depleted and restimulated for 2h. Cell lysates were immunoblotted for the indicated proteins and phospho-proteins. (E) Control and RagBQ99L -expressing HEK-293T cells were sterol-depleted for 2h, or depleted and, where indicated, restimulated for 1h, followed by immunofluorescence staining for endogenous mTOR and LAMP2. Scale bar, 10μm. (F) Quantification of mTOR-LAMP2 co-localization in control HEK-293T and in HEK-293T expressing RagBQ99L under sterol-depleted and sterol-stimulated conditions. Shown are mean + SD. N=15 cells/condition. ANOVA: p < 0.0001 followed by Tukey’s t-test: ****p < 0.0001.
Fig. 3
Fig. 3. SLC38A9 mediates mTORC1 activation by lysosomal cholesterol
(A) Conservation analysis of transmembrane helix 8 (TM8) of SLC38A9, with the CARC and CRAC motifs indicated by red lines. The essential Phe and Tyr within the CARC and CRAC motif, respectively, are boxed in red. (B) Control or SLC38A9-deleted HEK-293T cells were double-starved for cholesterol and arginine for 2h and, where indicated, restimulated with LDL, arginine or both for 2h. Cell lysates were immunoblotted for the indicated proteins and phospho-proteins. (C) SLC38A9 is required for cholesterol modulation of the Ragulator-Rag GTPase interaction. Control or SLC38A9-deleted HEK-293T stably expressing FLAG-p14 or LRF were subjected to cholesterol starvation for 2h and, where indicated, restimulated with MCD:cholesterol for 2h. Cells were lysed and subjected to FLAG immunoprecipitation and immunoblotting for the indicated proteins. (D) SLC38A9-deleted or FLAG-SLC38A9 rescued HEK-293T cells were subjected to the indicated treatments, followed by immunofluorescence for endogenous mTOR and LAMP2. Scale bar, 10μm. (E) Quantification of mTOR-LAMP2 co-localization from the experiment in (D). Shown are mean + SD. N=15 cells/condition. ANOVA: p < 0.0001 followed by Tukey’s t-test: ****p < 0.0001. (F) Titration curves displaying changes in the intrinsic fluorescence of the SLC38A9 CARC-CRAC peptide (2.5μM) in the presence of increasing concentrations of cholesterol, 25-hydroxycholesterol (25-HC) or cholest-4-en-3-one (3-one). Shown are mean ± SEM. N=3 samples/condition. ANOVA: ****p < 0.0001, ***p < 0.001 (G) Titration curves displaying changes in the intrinsic fluorescence of the wild-type, CRAC-mutated and CARC-CRAC mutated (DM) peptides, or a control ‘scrambled’ peptide (Scr, all peptides at 2.5μM), in the presence of increasing concentrations of cholesterol. Shown are mean ± SEM. N=3 samples/condition. ANOVA: ****p < 0.0001. (H) SLC38A9-deleted HEK-293T cells stably expressing the indicated wild-type and mutant FLAG-SLC38A9 constructs were starved for the indicated nutrients for 2 hours, or starved and re-stimulated with LDL or arginine for 2h or 30 min, respectively. Cell lysates were immunoblotted for the indicated proteins and phospho-proteins.
Fig. 4
Fig. 4. NPC1 interacts with SLC38A9 and mediates mTORC1 inhibition upon cholesterol depletion
(A) Binding of NPC1 to the mTORC1 scaffolding complex. HEK-293T cells stably expressing LAMP1-FLAG or NPC1-FLAG were lysed and subjected to FLAG immunoprecipitation and immunoblotting for the indicated proteins. (B) HEK-293T cells stably expressing LAMP1-FLAG or FLAG-SLC38A9 were lysed and subjected to FLAG immunoprecipitation (IP) and immunoblotting for the indicated proteins. (C) NPC1−/− MEFs stably expressing NPC1WT-FLAG or NPC1P691S-FLAG were stained with the cholesterol-staining agent filipin or subjected to double immunofluorescence for FLAG and LAMP1, as indicated. Scale bar, 10μm (D) Requirement of the sterol-sensing domain (SSD) of NPC1 for cholesterol regulation of mTORC1. MEFs with the indicated genotypes were depleted of sterol for 2 hours or depleted and restimulated with MCD:cholesterol for 1 hour. Cell lysates were immunoblotted for the indicated proteins and phospho-proteins. (E) HEK-293T cells lacking NPC1 were treated with either scrambled or SLC38A9-targeting siRNA, depleted of sterol for 2 hours or depleted and re-stimulated with LDL for 2 hours. Cell lysates were immunoblotted for the indicated proteins and phospho-proteins. (F) HEK-293T cells lacking NPC1 were treated with either scrambled or SLC38A9-targeting siRNA, starved for arginine for 1 hour, or starved and re-stimulated with arginine for 30 min. Cell lysates were immunoblotted for the indicated proteins and phospho-proteins. (G) Model for mTORC1 regulation by LDL-derived cholesterol. SLC38A9 stimulates Rag GTPase activation in response to cholesterol. NPC1 binds to SLC38A9 and inhibits cholesterol-mediated mTORC1 activation via its sterol transport activity.

References

    1. Nohturfft A, Zhang SC. Coordination of lipid metabolism in membrane biogenesis. Annual review of cell and developmental biology. 2009;25:539–566. - PubMed
    1. Espenshade PJ, Hughes AL. Regulation of sterol synthesis in eukaryotes. Annual review of genetics. 2007;41:401–427. - PubMed
    1. Goldstein JL, Brown MS. A century of cholesterol and coronaries: from plaques to genes to statins. Cell. 2015;161:161–172. - PMC - PubMed
    1. Dibble CC, Manning BD. Signal integration by mTORC1 coordinates nutrient input with biosynthetic output. Nature cell biology. 2013;15:555–564. - PMC - PubMed
    1. Kalaany NY, Mangelsdorf DJ. LXRS and FXR: the yin and yang of cholesterol and fat metabolism. Annual review of physiology. 2006;68:159–191. - PubMed

Publication types

MeSH terms