. 2017 May;16(5):770-785.
doi: 10.1074/mcp.M116.063859. Epub 2017 Mar 23.

Monitoring Cell-surface N-Glycoproteome Dynamics by Quantitative Proteomics Reveals Mechanistic Insights into Macrophage Differentiation

Affiliations

Monitoring Cell-surface N-Glycoproteome Dynamics by Quantitative Proteomics Reveals Mechanistic Insights into Macrophage Differentiation

Mathias Kalxdorf et al. Mol Cell Proteomics. 2017 May.

Abstract

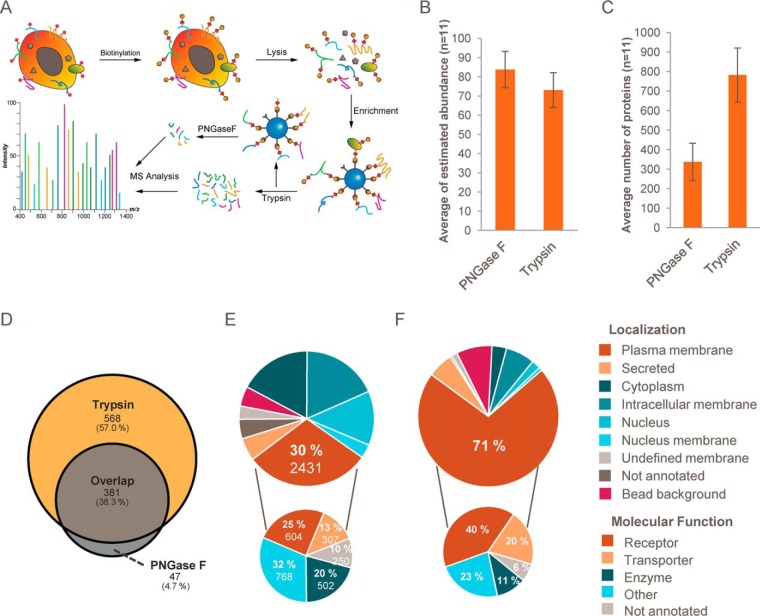
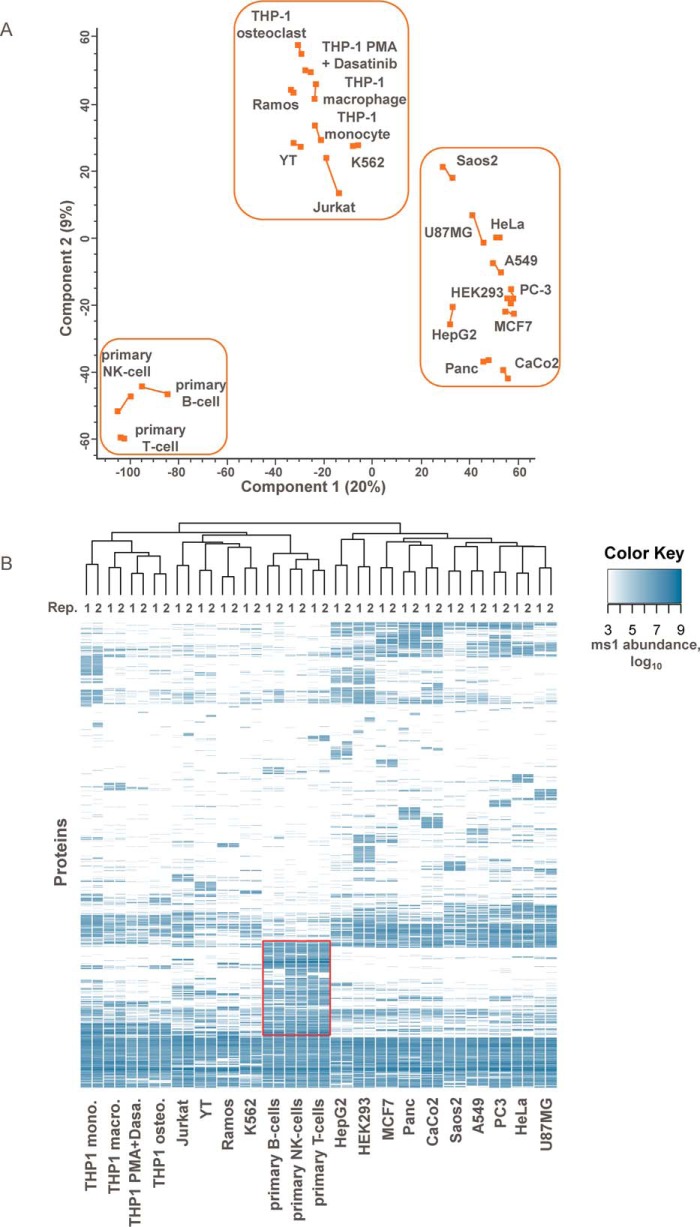
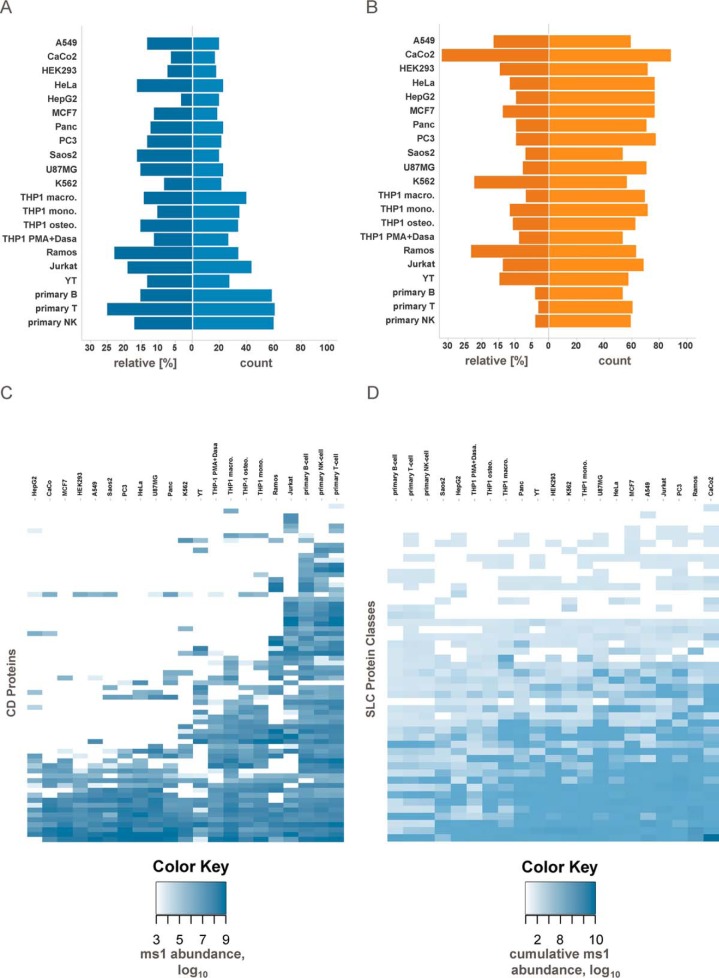
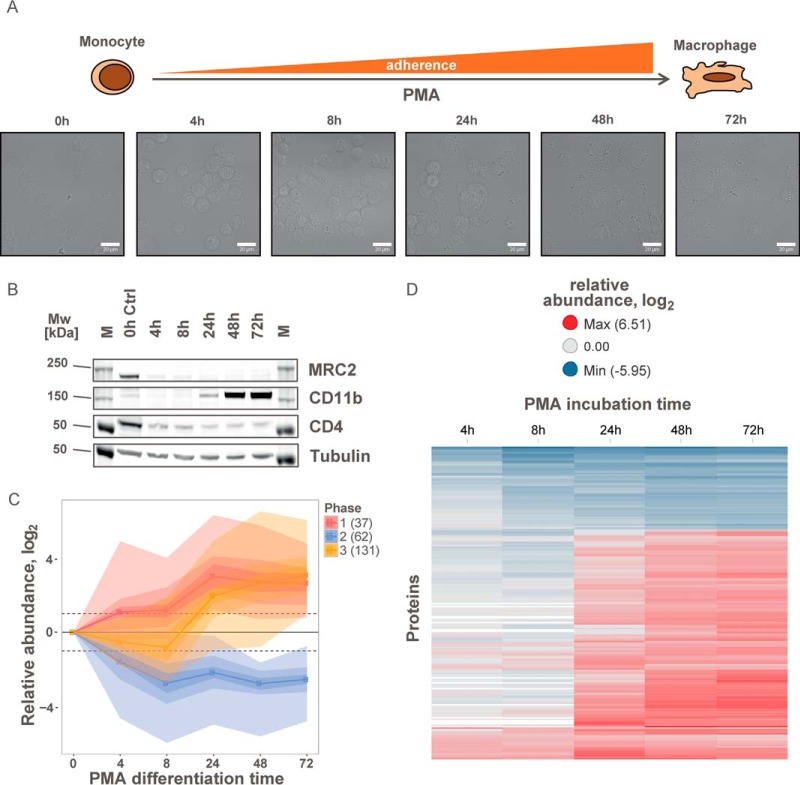
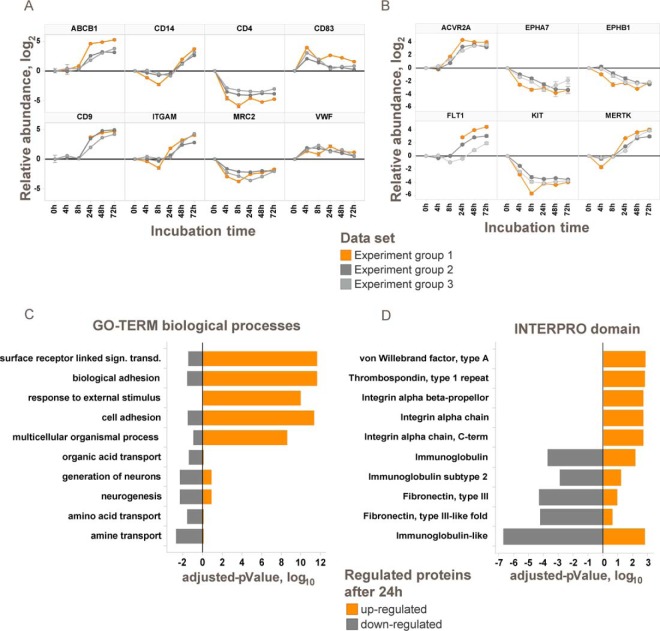
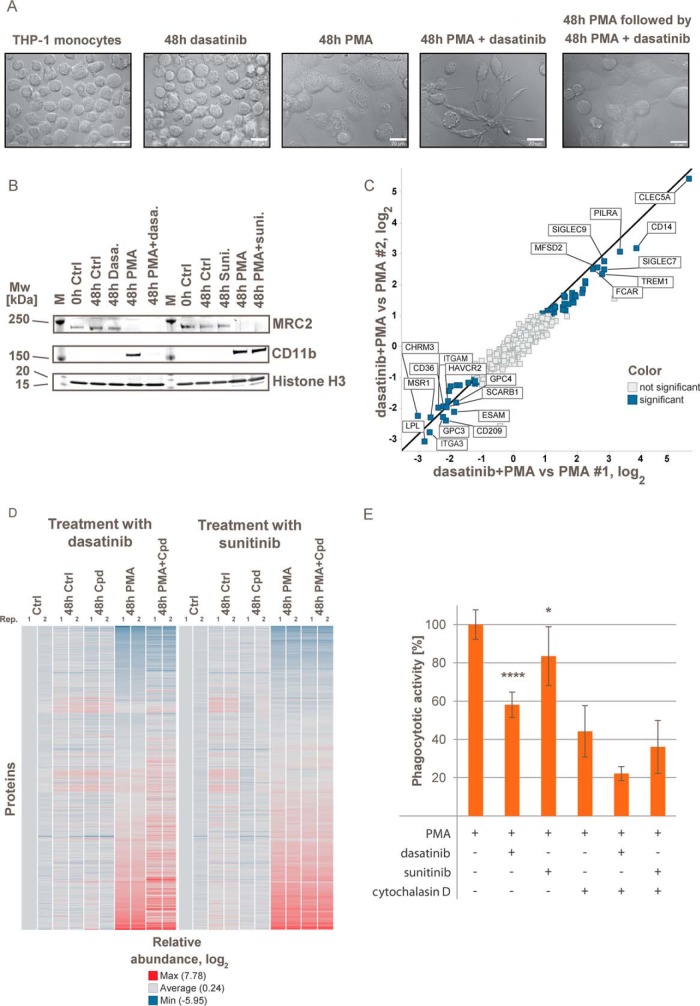
The plasma membrane proteome plays a crucial role in inter- and intracellular signaling, cell survival, and cell identity. As such, it is a prominent target for pharmacological intervention. The relatively low abundance of this subproteome in conjunction with challenging extractability and solubility still hampers its comprehensive analysis. Here, we combined a chemical glycoprotein-tagging strategy with mass spectrometry to enable comprehensive analysis of the cell-surface glycoproteome. To benchmark this workflow and to provide guidance for cell line selection for functional experiments, we generated an inventory of the N-linked cell-surface glycoproteomes of 15 standard laboratory human cell lines and three primary lymphocytic cell types. On average, about 900 plasma membrane and secreted proteins were identified per experiment, including more than 300 transporters and ion channels. Primary cells displayed distinct expression of surface markers and transporters underpinning the importance of carefully validating model cell lines selected for the study of cell surface-mediated processes. To monitor dynamic changes of the cell-surface proteome in a highly multiplexed experiment, we employed an isobaric mass tag-based chemical labeling strategy. This enabled the time-resolved analysis of plasma membrane protein presentation during differentiation of the monocytic suspension cell line THP-1 into macrophage-like adherent cells. Time-dependent changes observed in membrane protein presentation reflect functional remodeling during the phenotypic transition in three distinct phases: rapid surface presentation and secretion of proteins from intracellular pools concurrent with rapid internalization of no longer needed proteins and finally delayed presentation of newly synthesized macrophage markers. Perturbation of this process using marketed receptor tyrosine kinase inhibitors revealed dasatinib to severely compromise macrophage differentiation due to an off-target activity. This finding suggests that dynamic processes can be highly vulnerable to drug treatment and should be monitored more rigorously to identify adverse drug effects.


Conflict of interest statement

All authors are employees of this company

Figures

Fig. 1.
Fig. 1.
Selective biotinylation of plasma membrane glycoproteins enables robust identification and quantification of cell-surface proteins by LC-MS/MS. A, schematic illustration of the workflow. Plasma membrane proteins with N-glycosylations (red squares) are oxidized with sodium metaperiodate and subsequently biotinylated by alkoxyamine-PEG4-biotin. Cells are lysed in presence of SDS and DTT followed by the enrichment of biotinylated proteins with streptavidin-coated beads. Beads are stringently washed, and bound proteins are trypsinized. The resulting peptide mixture is analyzed by LC-MS/MS. Additionally, glycosylated peptides can be specifically eluted by the N-glycosidase PNGase F. B, comparison of the on-bead trypsinization procedure (trypsin) and the PNGase F elution protocol based on the average abundance of captured plasma membrane proteins (Top3 method) of 11 cell lines (n = 2). Error bars indicate standard deviations. C, as in B, but the comparison is based on the average number of identified plasma membrane proteins. D, representative Venn diagram illustrating the overlap of identified plasma membrane proteins using trypsin and PNGase F protocols for cell-surface biotinylated CaCo2 samples (n = 2). E, total number of identified proteins (large cake diagram) grouped by their annotated subcellular localization (UniProtKB) and annotated common bead background proteins (CRAPome). Plasma membrane proteins grouped by their annotated molecular function are shown in the small cake diagram. F, as in E but based on estimated fractional abundance of identified proteins. See also supplemental Fig. S1.
Fig. 2.
Fig. 2.
Comparison of plasma membrane proteomes of cell lines and primary cells. A, principal component analysis of cell line and primary cell-surface proteomes in two biological replicates. The first two principal components account for 29% of the total variation. Axes are labeled with the percent total variance of the corresponding principal component. Biological replicates are connected by lines. Epithelial, lymphoblastic, and primary cells are grouped in boxes. B, heat map representation of the cell-surface proteomes based on protein class abundances (Top3 method) and average linkage clustering using a Euclidian distance matrix.
Fig. 3.
Fig. 3.
Differences of cell-surface proteomes of primary cells and cell lines reflect lower metabolism and higher functional specialization. A, relative abundance and absolute number of identified CD proteins. Relative abundance is defined as the sum of MS1 signal abundance of CD proteins divided by the MS1 signal abundance summed over all plasma membrane proteins. B, relative abundance and absolute number of identified SLC transporters. C, heat map representation based on CD protein abundances. D, heat map representation based on SLC protein class abundances. See also supplemental Fig. S2.
Fig. 4.
Fig. 4.
Time-dependent monitoring of the plasma membrane proteome during differentiation of THP-1 cells. A, morphological changes of suspension monocytic THP-1 cells to adherent macrophage-like cells during differentiation in the presence of 100 nm PMA monitored by light microscopy. B, immunoblot of regulated cell-surface markers during differentiation of monocytic THP-1 cells to macrophage-like cells by PMA (M: molecular weight marker). C, abundance changes of significantly regulated plasma membrane proteins during differentiation grouped into three phases. Color shadings indicate data density. The numbers of proteins in each cluster are indicated. D, heat map of relative abundances for significantly regulated plasma membrane proteins during differentiation. See also supplemental Fig. S3.
Fig. 5.
Fig. 5.
Changes on the THP-1 cell-surface proteome during differentiation with PMA reflect differences between monocyte and macrophage functions. A, examples for significantly regulated proteins. Log2 transformed abundance changes relative to 0 h are shown for three independent experiments. B, examples for significantly regulated plasma membrane-associated kinases. C, GO-Term enrichment analysis of up- and down-regulated proteins after 72 h. Bars indicate logarithmic Benjamini-Hochberg corrected p values. D, INTERPRO domain enrichment analysis of up- and down-regulated proteins after 72 h. Bars indicate logarithmic Benjamini-Hochberg corrected p values. See also supplemental Fig. S3.
Fig. 6.
Fig. 6.
THP-1 differentiation in presence of dasatinib causes changes in cellular morphology, cell-surface marker presentation and phagocytotic activity. A, morphological differences between monocytic THP-1 cells after cultivation or PMA differentiation in the presence or absence of 1 μm dasatinib for 48 h monitored by light microscopy. Differentiation in the presence of dasatinib results in a less adherent and more dendritic cell shape. Addition of dasatinib to already differentiated cells has no influence on the morphology. B, immunoblots for cell-surface markers regulated during differentiation of THP-1 cells by PMA (M: molecular weight marker). C, proteins with significantly altered abundance in THP-1 cells differentiated in presence or absence of dasatinib. D, heat map representation of quantified plasma membrane-associated proteins during differentiation of monocytic THP-1 to macrophage-like cells in presence or absence of dasatinib and sunitinib. Colors represent log2 relative abundance to untreated controls. E, phagocytosis assay in differentiated THP-1 cells in absence or presence of 2 μm cytochalasin D. Mean of four replicates; error bars represent standard deviations. See also supplemental Fig. S4.

References

    1. Neugebauer K. M., and Reichardt L. F. (1991) Cell-surface regulation of β1-integrin activity on developing retinal neurons. Nature 350, 68–71 - PMC - PubMed
    1. Anderle P., Huang Y., and Sadée W. (2004) Intestinal membrane transport of drugs and nutrients: genomics of membrane transporters using expression microarrays. Eur. J. Pharm. Sci. 21, 17–24 - PubMed
    1. Li Y., Massey K., Witkiewicz H., and Schnitzer J. E. (2011) Systems analysis of endothelial cell plasma membrane proteome of rat lung microvasculature. Proteome Sci. 9, 15. - PMC - PubMed
    1. Navarro G., Cordomí A., Zelman-Femiak M., Brugarolas M., Moreno E., Aguinaga D., Perez-Benito L., Cortés A., Casadó V., Mallol J., Canela E. I., Lluís C., Pardo L., García-Sáez A. J., McCormick P. J., and Franco R. (2016) Quaternary structure of a G-protein-coupled receptor heterotetramer in complex with Gi and Gs. BMC Biol. 14, 26. - PMC - PubMed
    1. Wollscheid B., Bausch-Fluck D., Henderson C., O'Brien R., Bibel M., Schiess R., Aebersold R., and Watts J. D. (2009) Mass-spectrometric identification and relative quantification of N-linked cell surface glycoproteins. Nat. Biotechnol. 27, 378–386 - PMC - PubMed

Publication types