. 2017 May;16(5):924-935.
doi: 10.1074/mcp.M116.066720. Epub 2017 Mar 23.

Quantitative Age-specific Variability of Plasma Proteins in Healthy Neonates, Children and Adults

Affiliations

Quantitative Age-specific Variability of Plasma Proteins in Healthy Neonates, Children and Adults

Stefan Bjelosevic et al. Mol Cell Proteomics. 2017 May.

Abstract

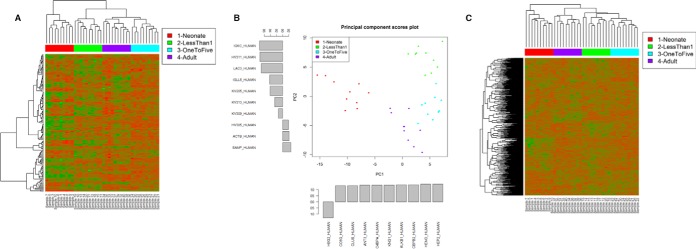
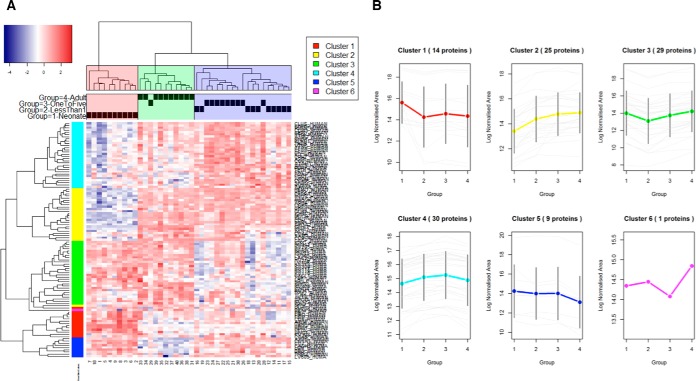
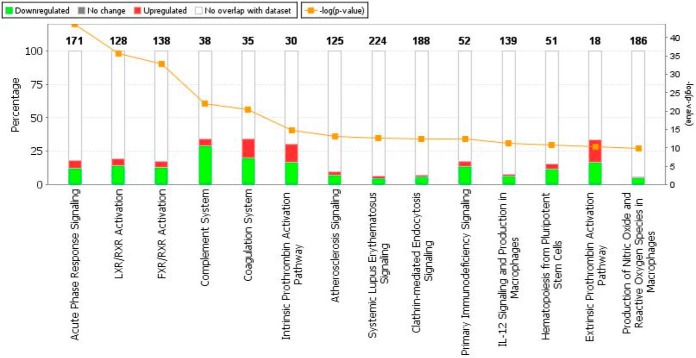
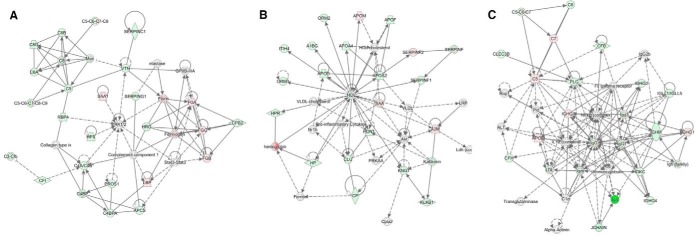
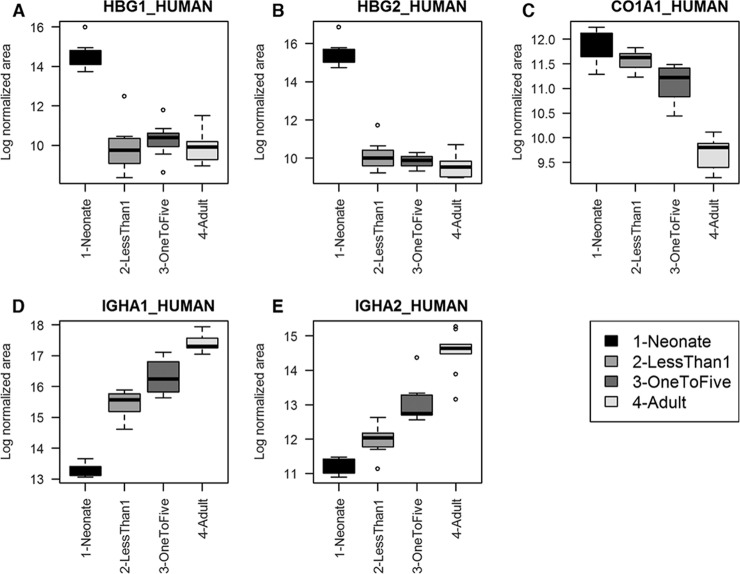
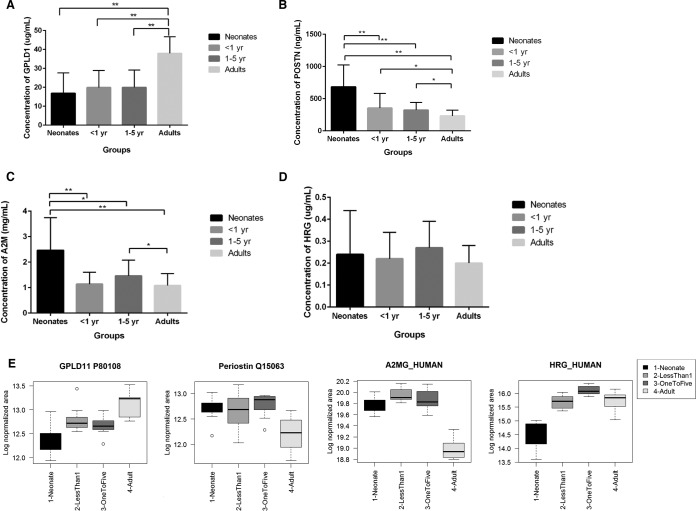
Human blood plasma is a complex biological fluid containing soluble proteins, sugars, hormones, electrolytes, and dissolved gasses. As plasma interacts with a wide array of bodily systems, changes in protein expression, or the presence or absence of specific proteins are regularly used in the clinic as a molecular biomarker tool. A large body of literature exists detailing proteomic changes in pathologic contexts, however little research has been conducted on the quantitation of the plasma proteome in age-specific, healthy subjects, especially in pediatrics. In this study, we utilized SWATH-MS to identify and quantify proteins in the blood plasma of healthy neonates, infants under 1 year of age, children between 1-5 years, and adults. We identified more than 100 proteins that showed significant differential expression levels across these age groups, and we analyzed variation in protein expression across the age spectrum. The plasma proteomic profiles of neonates were strikingly dissimilar to the older children and adults. By extracting the SWATH data against a large human spectral library we increased protein identification more than 6-fold (940 proteins) and confirmed the concentrations of several of these using ELISA. The results of this study map the variation in expression of proteins and pathways often implicated in disease, and so have significant clinical implication.


Figures

Fig. 1.
Fig. 1.
A, Unsupervised hierarchical clustering analysis for the 146 protein identifications using the local assay library. Relative expression patterns obtained using Euclidean distance. Green - proteins with decreased expression; Red - proteins with increased expression. B, Principal Component Analysis of data from A. The top 10 highest loadings for PC1 and PC2 are shown. C, Unsupervised hierarchical clustering for 940 proteins using an extended assay library.
Fig. 2.
Fig. 2.
A, Heatmap of the 107 differentially expressed proteins from the local assay library identified using ANOVA. The clustering patterns were obtained using a correlation-based distance and complete linkage. Blue - proteins with decreased expression; Red - proteins with increased expression. B, Clusters and protein abundance trends obtained by hierarchical clustering of the differentially expressed proteins identified using an ANOVA. x-axis represents the four age groups (1, Neonates; 2, <1 year olds; 3, 1–5 year olds; 4, Adults). y-axis represents log Normalized Area of the expression of each relevant protein (gray), with the overall mean presented as a colored line incorporating standard deviation (2SD) bars. The separation in three clusters was based on cutting the dendrogram at a distance of 0.1 and coloring the resulting sample clustering.
Fig. 3.
Fig. 3.
Top enriched pathways for the 107 differentially expressed proteins based on the ANOVA analysis, ranked in increasing order of their Fisher exact test p value (Ingenuity pathway analysis, default background comparison). Green - proteins with decreased expression in neonates; Red - proteins with increased expression in neonates; White - no overlap with the data set; Orange - log (p value), Fisher exact test, right tailed.
Fig. 4.
Fig. 4.
Most significant networks identified using Ingenuity Pathway Analysis. A, Hematological System Development and Function, Organismal Functions, Developmental Disorder; B, Neurological Disease, Lipid Metabolism, Molecular Transport; C, Humoral Immune Response, Inflammatory Response, Immunological Disease. Red denotes up-regulation in neonates compared with adults, green denotes down-regulation in neonates. White denotes a molecule not in the data set. The legend for the shapes is as follows: Double circle, Complex/Group; Trapezium, transporter; Diamond, enzyme; Horizontal diamond, Peptidase; Circle, other.
Fig. 5.
Fig. 5.
Age-specific expression patterns of five proteins of interest selected for discussion. Expression patterns for five proteins with the largest age-specific changes in expression. A, Hemoglobin subunit gamma-1 (HBG1); B, Hemoglobin subunit gamma-2 (HBG2); C, collagen alpha-1I chain (CO1A1); D, Ig alpha-1 chain C region (IGHA1) and E, Ig alpha-2 chain C region (IGHA2).
Fig. 6.
Fig. 6.
ELISA validation of differentially expressed proteins. A, GPI-specific phospholipase 1 (GPLD1), B, Periostin (POSTN), C, Alpha-2-macroglobulin (A2M), D, Histidine rich glycoprotein (HRG). E, For comparison, boxplots showing the respective abundance patterns detected from the SWATH data using the extended library (GPLD1 and POSTN) and the local library (A2M and HRG). All error bars are standard deviation (SD). * Denotes significance ≤ 0.05; ** denotes significance ≤ 0.01.

References

    1. Lull M. E., Freeman W. M., Myers J. L., Midgley F., Kimatian S. J., Undar A., and Vrana K. E. (2006) Plasma proteomics: a noninvasive window on pathology and pediatric cardiac surgery. ASAIO J. 52, 562–566 - PubMed
    1. Michiels J. J., Brenneman Z., Gadisseur A., van der Planken M., Schroyens W., van de Velde A., and van Vliet H. (2006) Classification and characterization of herediary types 2A, 2B, 2C, 2D, 2E, 2M, 2N and 2U (unclassifiable) von Wilebrand disease. Clin. App. Thromb. Hemost. 12, 397–420 - PubMed
    1. Kakhniashvili D. G., Griko N. B., Bulla L. A. Jr., and Goodman S. R. (2005) The proteomics of sickle cell disease: profiling of erythrocyte membrane proteins by 2D-DIGE and tandem mass spectrometry. Exp. Biol. Med. 230, 787–792 - PubMed
    1. Yocum A. K., Busch C. M., and Felix C. A. (2006) Proteomics-based strategy to identify biomarkers and pharmacological targets in leukemias with t(4;11) translocations. J. Proteome Res. 5, 2743–2753 - PubMed
    1. Roxo-Rosa M., da Costa G., and Luider T. M. (2006) Proteomic analysis of nasal cells from cystic fibrosis patients and noncystic fibrosis control individuals: search for novel biomarkers of cystic fibrosis lung disease. Proteomics 6, 2314–2325 - PubMed

Publication types