. 2017 May;174(1):435-449.
doi: 10.1104/pp.17.00248. Epub 2017 Mar 23.

pTAC10, a Key Subunit of Plastid-Encoded RNA Polymerase, Promotes Chloroplast Development

Affiliations

pTAC10, a Key Subunit of Plastid-Encoded RNA Polymerase, Promotes Chloroplast Development

Sun Hyun Chang et al. Plant Physiol. 2017 May.

Abstract

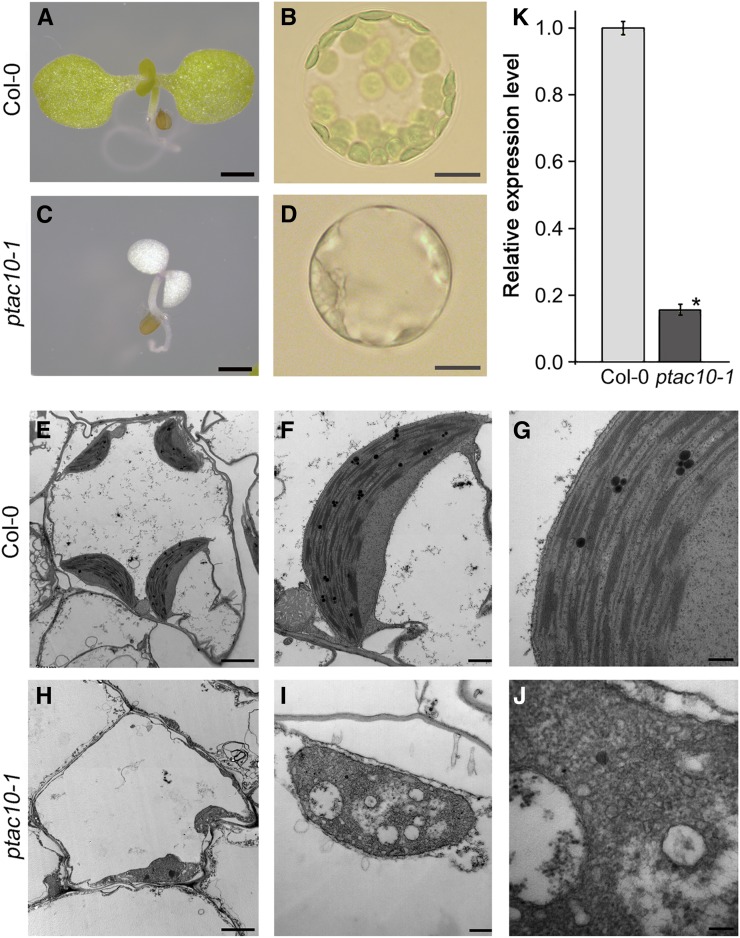
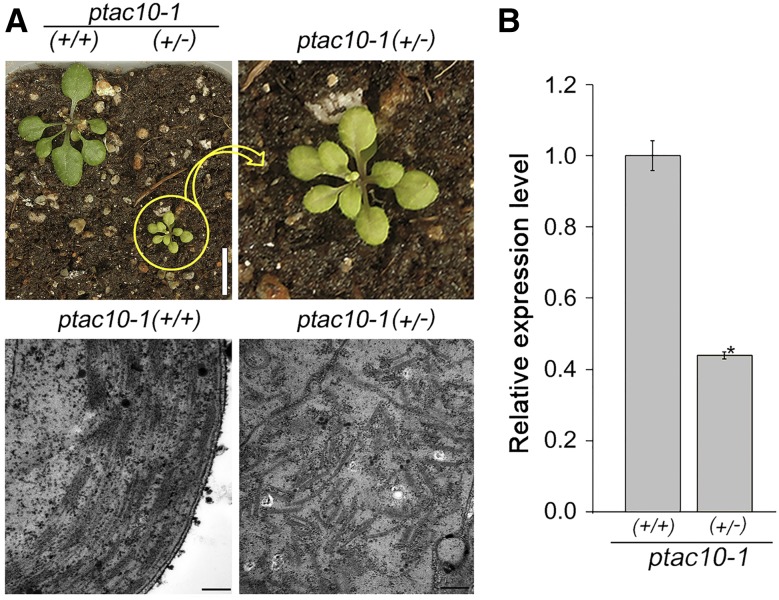
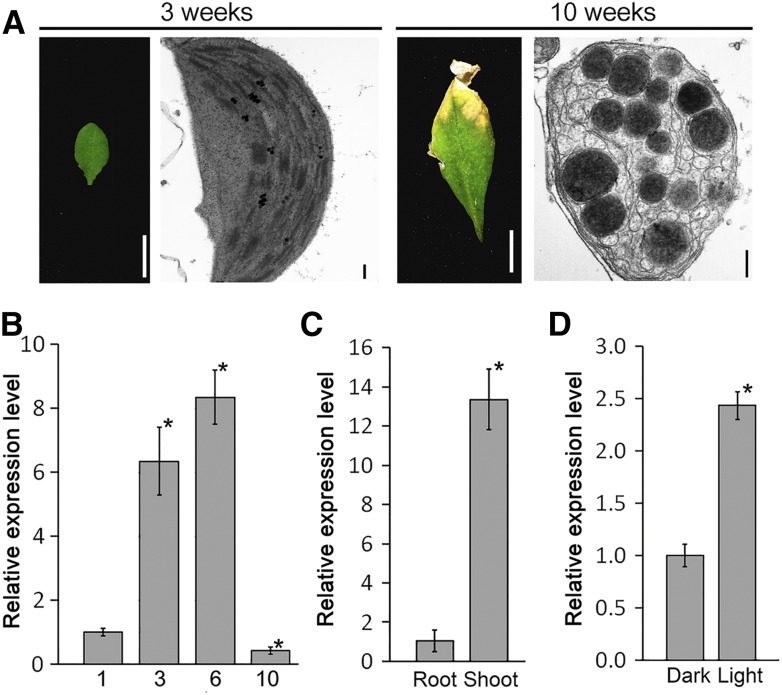
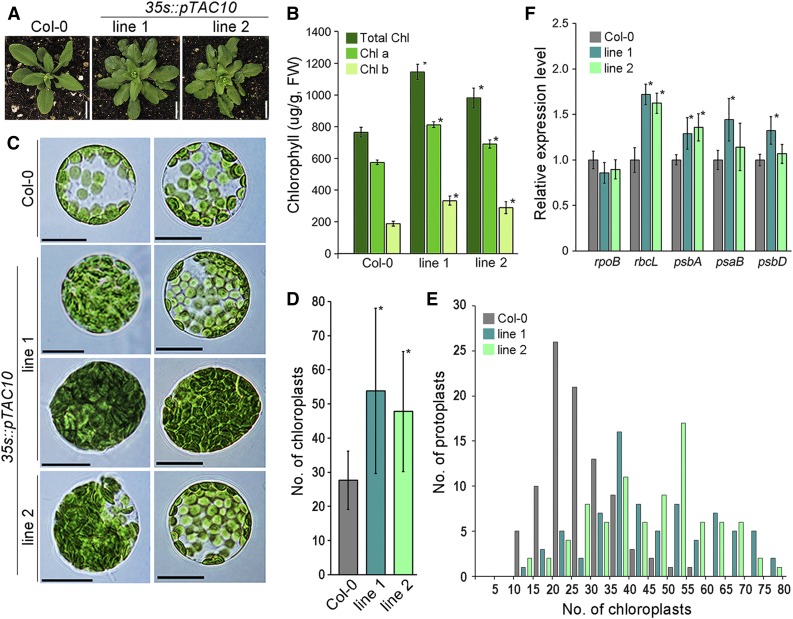
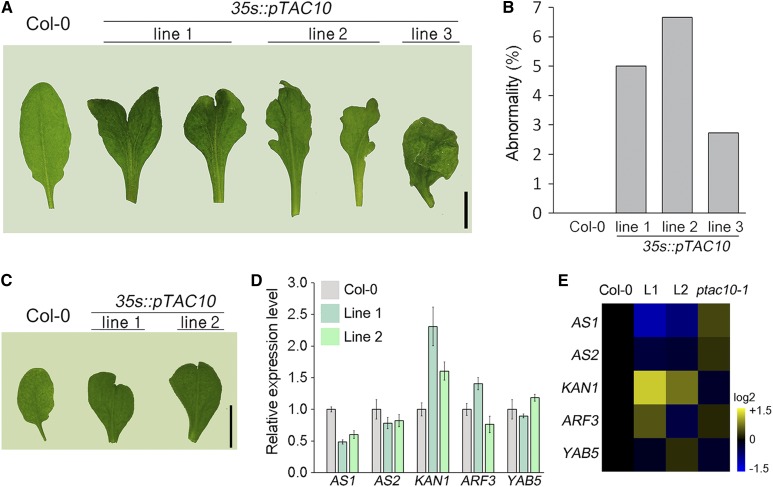
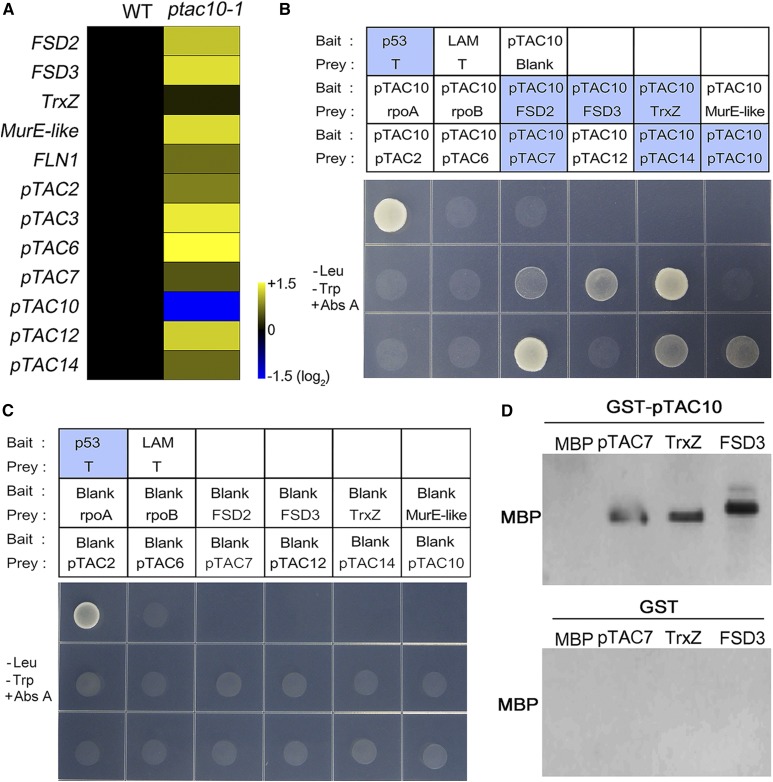
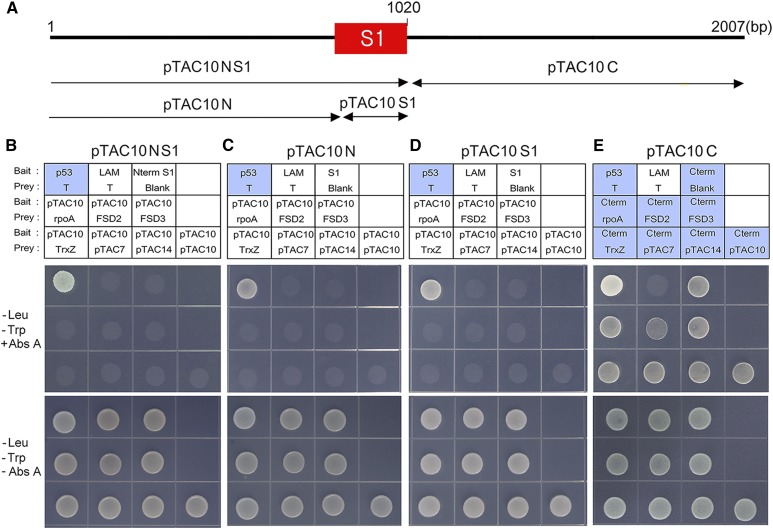
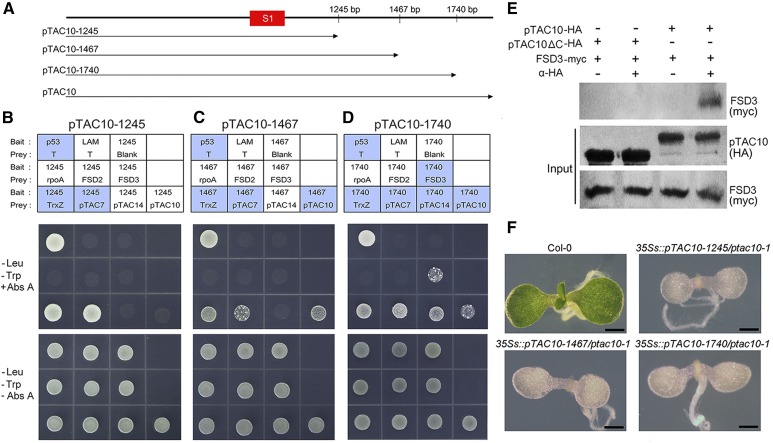
Regulation of photosynthetic gene expression by plastid-encoded RNA polymerase (PEP) is essential for chloroplast development. The activity of PEP largely relies on at least 12 PEP-associated proteins (PAPs) encoded in the nuclear genome of plant cells. A recent model proposed that these PAPs regulate the establishment of the PEP complex through broad PAP-PEP or PAP-PAP interactions. In this study, we identified the Arabidopsis (Arabidopsis thaliana) seedling-lethal mutant ptac10-1, which has defects in chloroplast development, and found that the mutant phenotype is caused by the suppression of PLASTID S1 RNA-BINDING DOMAIN PROTEIN (pTAC10/PAP3). Analysis of the heterozygous mutant and pTAC10-overexpressing transgenic plants indicated that the expression level of pTAC10 is tightly linked to chloroplast development. Characterization of the interaction of pTAC10 with PAPs revealed that pTAC10 interacts with other PAPs, such as FSD2, FSD3, TrxZ, pTAC7, and pTAC14, but it does not interact with PEP core enzymes, such as rpoA and rpoB. Analysis of pTAC10 interactions using truncated pTAC10 proteins showed that the pTAC10 carboxyl-terminal region downstream of the S1 domain is involved in the pTAC10-PAP interaction. Furthermore, overexpression of truncated pTAC10s lacking the C-terminal regions downstream of the S1 domain could not rescue the ptac10-1 mutant phenotype and induced an abnormal whitening phenotype in Columbia-0 plants. Our observations suggested that these pTAC10-PAP interactions are essential for the formation of the PEP complex and chloroplast development.


Figures

Figure 1.
Figure 1.
Characterization of the ptac10-1 mutants. A to D, Images of 7-d-old Columbia-0 (Col-0) and ptac10-1 mutant seedlings (left) and the protoplasts isolated from these plants (right). Bars = 1 mm in the seedling images and 5 μm in the protoplast images. E to J, Chloroplast ultrastructure of 7-d-old Col-0 (E–G) and ptac10-1 mutants (H–J). Transmission electron microscopy images showed that the ptac10-1 mutants are defective in chloroplast development. Bars = 2 μm in the left images, 0.5 μm in the middle images, and 200 nm in the right images. K, Analysis of the expression levels of pTAC10 in the ptac10-1 mutant and Col-0 by quantitative reverse transcription (qRT)-PCR. Error bars indicate sd. The asterisk indicates a statistically significant difference between the corresponding samples and their control (P < 0.01, Student’s t test). All experiments were repeated at least three times with similar results.
Figure 2.
Figure 2.
Chloroplast structure in ptac10-1 heterozygous mutants. A, Phenotypes of 3-week-old ptac10-1 heterozygous mutants (+/−) and wild-type plants (+/+; top) and the chloroplast ultrastructure in these plants (bottom). Bars = 1 cm in the top images and 200 nm in the bottom images. B, Analysis of the expression level of pTAC10 in the ptac10-1 heterozygous mutants (+/−) and wild-type plants (+/+) by qRT-PCR. Error bars indicate sd. The asterisk indicates a statistically significant difference between the corresponding sample and its control (P < 0.01, Student’s t test). All experiments were repeated at least three times with similar results.
Figure 3.
Figure 3.
Regulation of pTAC10 expression with leaf development and in response to light. A and B, Leaf and chloroplast morphology (A) and the expression level of pTAC10 (B) at the indicated stages. Cotyledons of 1-week-old Col-0 seedlings and seventh or eighth rosettes of 3-, 6-, and 10-week-old Col-0 plants were analyzed. Bars = 0.5 cm in leaf images and 200 nm in chloroplast images. C, Tissue-specific expression of pTAC10 in 1-week-old Col-0 by qRT-PCR. D, Light-dependent expression of pTAC10 in 1-week-old Col-0 seedlings grown in continuous dark or light conditions. Error bars indicate sd. Asterisks indicate statistically significant differences between the corresponding samples and their controls (P < 0.01, Student’s t test). The expression analyses were repeated twice with similar results.
Figure 4.
Figure 4.
pTAC10 overexpression promotes chloroplast development. The effect of pTAC10 overexpression on chloroplast development was analyzed. A, Phenotypes of pTAC10-overexpressing transgenic plants (35s::pTAC10) grown in soil for 5 weeks. Bars = 1 cm. B, Chlorophyll contents in 35s::pTAC10 transgenic plants and Col-0 plants grown in soil for 6 weeks. FW, Fresh weight. C, Morphology of the protoplasts isolated from 6-week-old Col-0, 35s::pTAC10 line 1, and 35s::pTAC10 line 2. Bars = 10 μm. D and E, Measurement of the number of chloroplasts in Col-0, 35s::pTAC10 line 1, and 35s::pTAC10 line 2. Values are means of chloroplast numbers in D and number of protoplasts in E (n > 80). F, Analysis of chloroplast gene expression level in 35s::pTAC10 and Col-0 plants grown in soil for 6 weeks. Error bars indicate sd. Asterisks indicate statistically significant differences between the corresponding samples and their controls (P < 0.01, Student’s t test). Analyses of morphology, chlorophyll content, and gene expression were repeated at least twice with similar results.
Figure 5.
Figure 5.
Leaves with abnormal morphology in 35s::pTAC10 plants. A and B, Images of abnormal leaves collected from 8-week-old 35s::pTAC10 transgenic plants (A) and their ratios (B). The total numbers of leaves observed were 120 (line 1, five plants), 105 (line 2, five plants), and 110 (line 3, five plants). C, Images of abnormal leaves collected from 4-week-old 35s::pTAC10 transgenic plants. D, Expression levels of the genes related to leaf morphology in these leaves. Error bars indicate sd. The experiment was repeated twice with similar results. E, Heat map showing the expression pattern of the indicated genes in the pTAC10-overexpressing and ptac10-1 mutant plants. Expression levels of these genes in ptac10-1 mutants were collected from the RNA sequencing results. L1 and L2 indicate the abnormal leaves collected from 35s::pTAC10 line 1 and 35s::pTAC10 line 2 plants. Scale bar = 1 cm in A and C.
Figure 6.
Figure 6.
pTAC10 interacts with PAPs. The expression patterns of PAPs in the ptac10-1 mutants and the interactions of pTAC10 with PAPs were analyzed. A, Heat map showing the expression pattern of 12 PAPs in the ptac10-1 mutants and wild-type Col-0 plants (WT). Expression patterns of these genes were collected from RNA sequencing results using 1-week-old Col-0 and ptac10-1 mutant plants. B, Yeast two-hybrid assay showing that pTAC10 interacts with subunits of the PEP complex. The yeast line cotransformed with the p53 bait and T prey plasmids was used for a positive control, and the yeast line transformed with the LAM bait and T prey plasmids was used for a negative control. The yeast lines transformed with blank prey plasmids together with pTAC10 bait plasmids were used for the test of self-activation. –Leu –Trp +Abs A indicates Abs A-containing double dropout (DDO) medium (–Leu –Trp) for the test of pTAC10 interaction. Blue boxes indicate the yeast lines that survived in the Abs A-containing medium. C, Blank bait plasmid analysis to verify the interaction of pTAC10-PAPs in the yeast two-hybrid assay. D, GST pull-down assay showing that pTAC10 interacts with the PAPs. MBP and GST proteins were used as negative controls for the pTAC10-PAP interaction. Interaction analyses were repeated twice with similar results.
Figure 7.
Figure 7.
The pTAC10 N-terminal regions including the S1 domain are not involved in the pTAC10-PAP interaction. A, Schematic of truncated pTAC10 protein structures. B to D, Yeast two-hybrid assays using the pTAC10NS1 (B), pTAC10N (C), and pTAC10S1 (D) plasmids. None of the yeast lines transformed with pTAC10NS1, pTAC10N, or pTAC10S1 bait plasmid together with the indicated prey plasmid survived in the Abs A-containing DDO medium. E, Yeast two-hybrid assay using the pTAC10C bait plasmid. Regardless of prey, all yeast lines carrying this bait plasmid survived in the Abs A-containing DDO medium. The rpoA prey plasmid was used as a negative control for pTAC10 interaction. DDO medium without Abs A was used for the validation of yeast transformation and equal dropping. Blue boxes indicate the yeast lines that survived in the Abs A-containing medium. All experiments were repeated at least twice with similar results.
Figure 8.
Figure 8.
The pTAC10 C-terminal region downstream of the S1 domain mediates the pTAC10-PAP interactions. A, Schematic of the truncated pTAC10 protein structure. B and D, Yeast two-hybrid assay results using pTAC10-1245 (B), pTAC10-1467 (C), and pTAC10-1740 (D) as bait plasmids. Blue boxes indicate the yeast lines that survived in the Abs A-containing medium. E, Coimmunoprecipitation analysis of the pTAC10 and FSD3 interaction. pTAC10-HA and pTAC10ΔC-HA indicate intact pTAC10 and pTAC10 lacking their C-terminal regions downstream of the S1 region fused with the HA epitope, respectively. FSD3-myc indicates FSD3 proteins fused with the myc epitope. F, Morphology of the ptac10-1 mutant transformed with the 35s::pTAC10-1245, 35s::pTAC10-1467, or 35s::pTAC10-1740 plasmid. Introduction of the 35s::pTAC10-1245, 35s::pTAC10-1467, or 35s::pTAC10-1740 plasmid did not rescue the ptac10-1 mutant phenotype, leading to seedling lethality. Interaction analyses were repeated twice with similar results. Bars = 1 mm.
Figure 9.
Figure 9.
Abnormal whitening phenotypes in pTAC10-1467- or pTAC10-1740-overexpressing plants. A to C, Four-week-old Col-0 (A), 35s::pTAC10-1467/Col-0 (B), and 35s::pTAC10-1740/Col-0 (C) with the abnormal whitening phenotype. D, Seven-week-old Col-0 (left), 35s::pTAC10-1467/Col-0 (middle), and 35s::pTAC10-1740/Col-0 (right) with the abnormal whitening phenotype. 1467 and 1740 indicate 35s::pTAC10-1467/Col-0 and 35s::pTAC10-1740/Col-0, respectively. E to J, High-resolution images of Col-0 (E and H), 35s::pTAC10-1467/Col-0 (F and I), and 35s::pTAC10-1740/Col-0 (G and J). K, Image of a 35s::pTAC10-1467/Col-0 leaf with the abnormal whitening phenotype. L and M, Ultrastructure of the plastid in the green part of K and its high-resolution image. N and O, Ultrastructure of the plastid in the whitening part of K and its high-resolution image. Transmission electron microscopy analysis was repeated twice with similar results. Bars = 1 cm (A–D) and 200 nm (L–O).

Similar articles

Cited by

References

    1. Allison LA, Simon LD, Maliga P (1996) Deletion of rpoB reveals a second distinct transcription system in plastids of higher plants. EMBO J 15: 2802–2809 - PMC - PubMed
    1. Arsova B, Hoja U, Wimmelbacher M, Greiner E, Ustün S, Melzer M, Petersen K, Lein W, Börnke F (2010) Plastidial thioredoxin z interacts with two fructokinase-like proteins in a thiol-dependent manner: evidence for an essential role in chloroplast development in Arabidopsis and Nicotiana benthamiana. Plant Cell 22: 1498–1515 - PMC - PubMed
    1. Biswal B, Krupinska K, Biswal UC (2013) Plastid Development in Leaves during Growth and Senescence. Springer, Dordrecht, The Netherlands
    1. Boni IV, Isaeva DM, Musychenko ML, Tzareva NV (1991) Ribosome-messenger recognition: mRNA target sites for ribosomal protein S1. Nucleic Acids Res 19: 155–162 - PMC - PubMed
    1. Buchanan BB, Gruissem W, Jones RL (2015) Biochemistry and Molecular Biology of Plants. John Wiley & Sons, Hoboken, New Jersey

MeSH terms

Substances