

NELF-E is recruited to DNA double-strand break sites to promote transcriptional repression and repair
- PMID: 28336775
- PMCID: PMC5412775
- DOI: 10.15252/embr.201643191
NELF-E is recruited to DNA double-strand break sites to promote transcriptional repression and repair
Abstract
Double-strand breaks (DSBs) trigger rapid and transient transcription pause to prevent collisions between repair and transcription machineries at damage sites. Little is known about the mechanisms that ensure transcriptional block after DNA damage. Here, we reveal a novel role of the negative elongation factor NELF in blocking transcription activity nearby DSBs. We show that NELF-E and NELF-A are rapidly recruited to DSB sites. Furthermore, NELF-E recruitment and its repressive activity are both required for switching off transcription at DSBs. Remarkably, using I-SceI endonuclease and CRISPR-Cas9 systems, we observe that NELF-E is preferentially recruited, in a PARP1-dependent manner, to DSBs induced upstream of transcriptionally active rather than inactive genes. Moreover, the presence of RNA polymerase II is a prerequisite for the preferential recruitment of NELF-E to DNA break sites. Additionally, we demonstrate that NELF-E is required for intact repair of DSBs. Altogether, our data identify the NELF complex as a new component in the DNA damage response.
Keywords: NELF‐E; PARP1; RNA polymerase II; double‐strand breaks.
© 2017 The Authors.
Figures
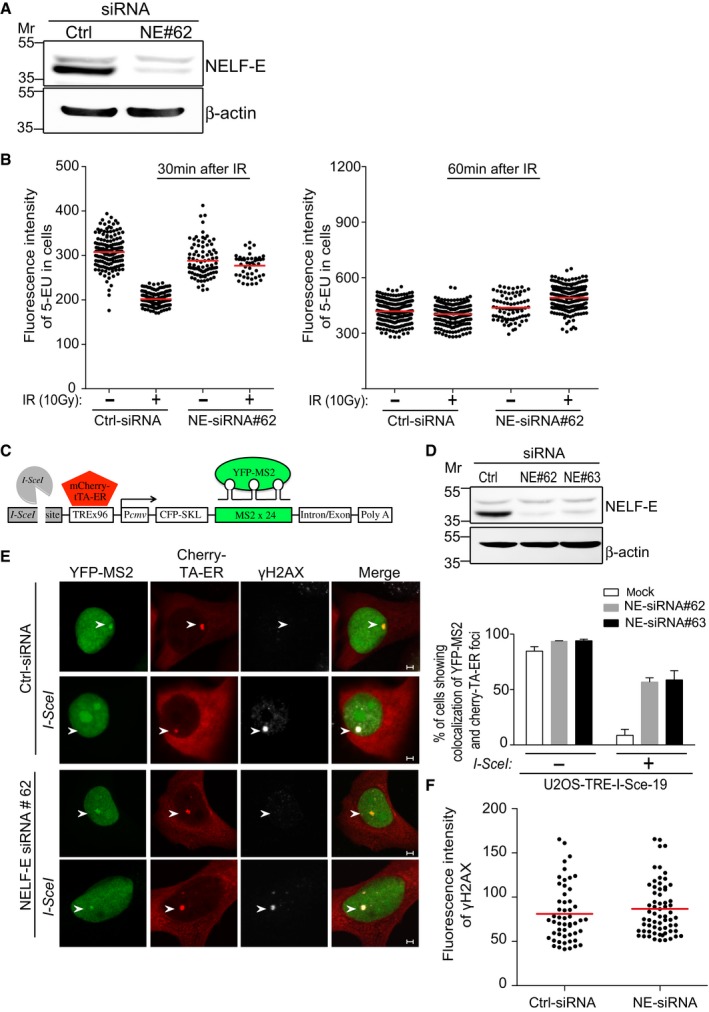
Western blot shows knockdown of NELF‐E in U2OS cells. Cells were transfected with control siRNA (Ctrl) or NELF‐E siRNA#62 and 72 h post‐transfection cells were lysed and subjected to Western blot using NELF‐E antibody. β‐actin was used as a loading control.
NELF‐E promotes global transcriptional silencing after ionizing radiation. Control and NELF‐E siRNA‐treated U2OS cells were exposed to IR (10 Gy) followed by 20‐min incubation with 5‐ethynyl uridine (5‐EU). Cells were then fixed at the indicated time points, and 5‐EU incorporation into newly synthesized RNA was detected using Alexa Fluor 594. The data are representative of two independent experiments. Red horizontal bars indicate the mean fluorescence intensity of 5‐EU in cells.
Schematic of the reporter cassette integrated into the genome of U2OS‐TRE‐I‐Sce‐19 cells. It includes an I‐SceI recognition site, 96 copies of tetracycline response element (TRE), a CMV minimal promoter, CFP fused to a peroxisomal targeting signal (SKL), and 24 repeats of the MS2 RNA stem loop sequence.
Knockdown of NELF‐E in U2OS‐TRE‐I‐Sce‐19 cells. Cells were transfected with control siRNA (Ctrl) or two different NELF‐E siRNA sequences and subjected to Western blot analysis. β‐actin was used as a loading control.
NELF‐E is required for DSB‐induced transcriptional silencing. Mock and NELF‐E‐depleted U2OS‐TRE‐I‐Sce‐19 cells were transfected with pCherry‐tTA‐ER and pYFP‐MS2 plasmids and treated with 1 μM tamoxifen for 2 h to activate transcription of the MS2 gene. To induce DSB upstream of the MS2 gene, cells were transfected with a third plasmid expressing I‐SceI endonuclease. Cells were fixed and immunostained with γH2AX. Representative images were acquired using confocal microscope. Graph displays the percentage of cells that show colocalization of YFP‐MS2 and Cherry‐tTA‐ER. Data are represented as mean ± standard deviation (SD) from at least three independent experiments. The transcription of the MS2 gene is marked with white arrowheads. Scale bar, 2 μm.
Quantitative measurements show that NELF‐E depletion has no detectable effect on the fluorescence intensity of γH2AX foci at DSB sites. Red horizontal bars indicate the mean fluorescence intensity of γH2AX in cells.
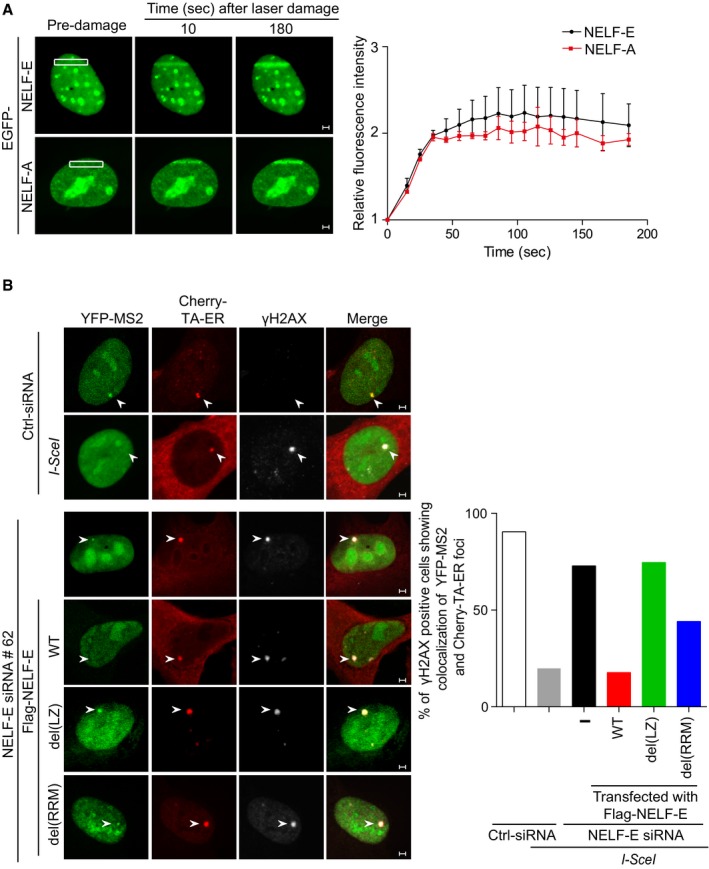
Representative time‐lapse images showing the localization of EGFP‐NELF‐E and EGFP‐NELF‐A after laser microirradiation targeted to a particular region marked by white rectangle. Scale bar, 2 μm. Graph on the right shows fold increase in the relative fluorescence intensity at laser‐microirradiated sites. Results shown are typical of four independent experiments and represent 40 different cells. Error bars indicate standard error of the mean (SEM).
NELF‐E recruitment to DSB is critical for transcriptional silencing. NELF‐E‐deficient U2OS‐TRE‐I‐Sce‐19 cells were transfected with pCherry‐tTA‐ER, pYFP‐MS2, and pCMV‐NLS‐I‐SceI plasmids along with either of the indicated constructs expressing Flag fused to NELF‐EWT, NELF‐Edel(LZ), or NELF‐Edel(RRM). Cells were immunostained with γH2AX (gray). Graph displays the percentage of γH2AX‐positive cells that show colocalization of YFP and Cherry foci. White arrowheads mark the location of the MS2 reporter cassette. Data represent the mean of two biological repeats. Scale bar, 2 μm.
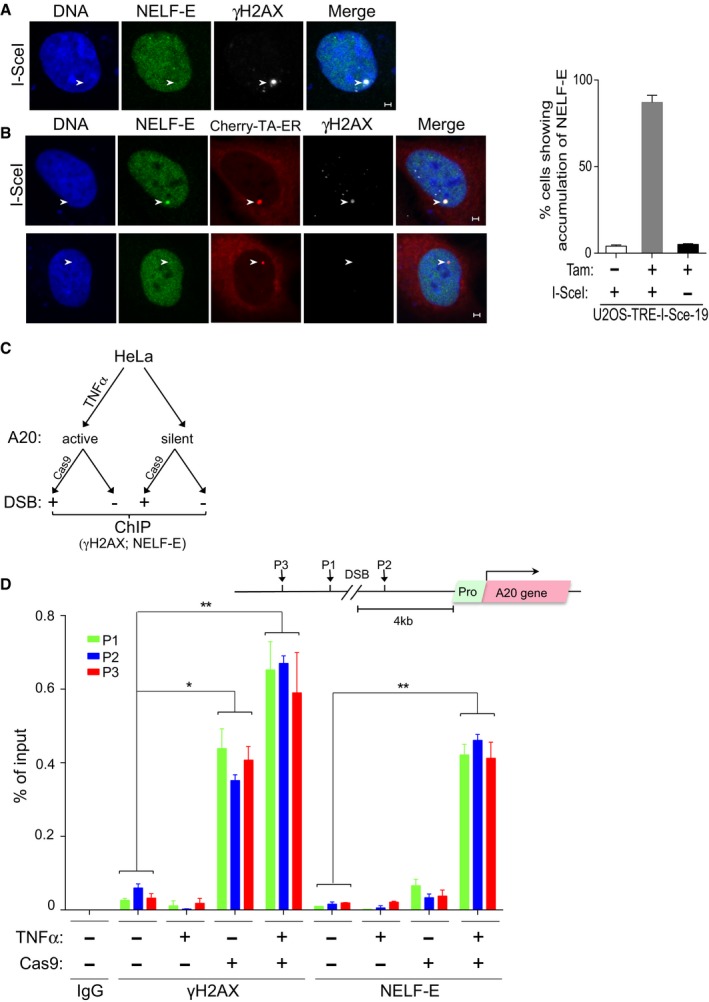
Representative cell showing that NELF‐E is not recruited to I‐SceI‐induced DSBs upstream of transcriptionally inactive MS2 gene. U2OS‐TRE‐I‐Sce‐19 cells were transfected with pCMV‐NLS‐I‐SceI plasmid to induce DSB upstream of the silent MS2 gene. 24 h post‐transfection cells were fixed and co‐stained for NELF‐E (green) and γH2AX (gray). DNA is stained with DAPI (blue). White arrowheads mark the location of the MS2 reporter cassette. Scale bar, 2 μm.
As in (A), except that U2OS‐TRE‐I‐Sce‐19 cells were co‐transfected with pCherry‐tTA‐ER and treated with Tam to induce MS2 expression. Top panel shows that NELF‐E is recruited to I‐SceI‐induced DSBs upstream of transcriptionally active gene. Bottom panel shows no accumulation of NELF‐E at transcriptionally active MS2 gene in the absence of DSBs. Scale bar, 2 μm. Graph on the right displays the percentage of cells that show colocalization of NELF‐E and γH2AX. White arrowheads mark the location of the MS2 reporter cassette. Data are represented as mean ± SD from three independent experiments.
A diagram showing the layout of a ChIP experiment that aims to test the accumulation of NELF‐E at DSBs induced by CRISPR‐Cas9 upstream of transcriptionally active or inactive A20 gene.
Endogenous NELF‐E is preferentially recruited to DSBs induced upstream of active rather than inactive A20 gene. A schematic diagram depicting the position of the DSB induced by Cas9, A20 gene, and its promoter, and the position of three DNA sequences (P1, P2, and P3) that were tested by real‐time PCR for the presence of NELF‐E and γH2AX (top). Graph represents the results of ChIP analysis showing the binding of endogenous NELF‐E and the abundance of γH2AX at three positions near DSBs upstream of transcriptionally active (HeLa cells treated with TNFα) and inactive (untreated cells) A20 gene. The occupancy of NELF‐E and γH2AX at P1, P2, and P3 sites was determined by quantitative real‐time PCR analysis and normalized to input. Error bars represent SD from three independent experiments. Asterisks depict statistically significant differences in the values of P1, P2, and P3 when compared to the corresponding values of the control samples that were not treated with TNFα and Cas9. Statistical analysis was performed by Student's t‐test, *P < 0.05, **P < 0.01.
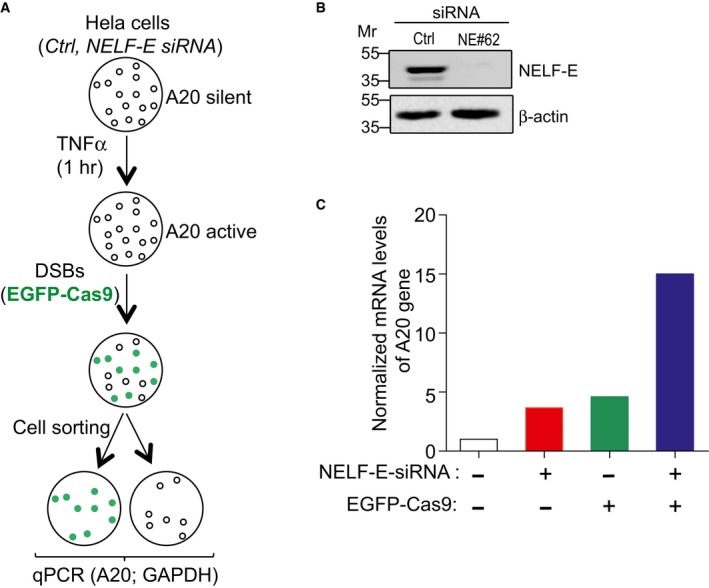
A flowchart depicting the layout of an experiment designed to determine the effect of NELF‐E on the transcription of A20 gene following DSB induction.
Western blot shows NELF‐E knockdown in HeLa cells at 72 h after siRNA transfection. β‐actin was used as a loading control.
Graph displays the effect of NELF‐E depletion on the transcription activity of A20 gene upon Cas9‐induced DSBs. Results show that NELF‐E negatively regulates A20 expression at DSB sites. Data represent the mean of two biological repeats.
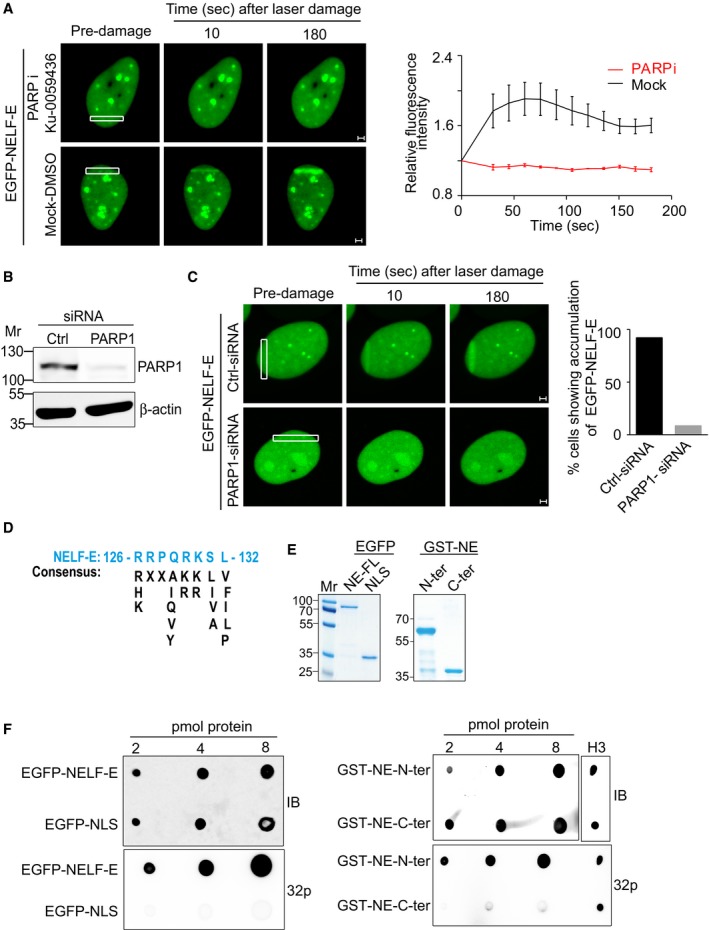
Pharmacological inhibition of PARP abolished EGFP‐NELF‐E recruitment to laser‐microirradiated sites. Representative time‐lapse images show EGFP‐NELF‐E localization at the indicated times after laser microirradiation of a single region (marked by white rectangle). Results shown are typical of three independent experiments and represent at least 20 different cells. Graph on the right shows fold increase in the relative fluorescence intensity at laser‐microirradiated sites. Data are presented as mean ± SEM. Scale bar, 2 μm.
U2OS‐TetON‐EGFP‐NELF‐E cells were transiently transfected with either control siRNA (Ctrl) or PARP1 siRNA and subjected to Western blot.
As in (A), representative time‐lapse images show EGFP‐NELF‐E localization at laser‐microirradiated regions in U2OS cells transfected with control or PARP1 siRNA. Graph displays the percentage of PARP1‐depleted cells (n = 2) that show accumulation of EGFP‐NELF‐E to laser‐microirradiated regions, compared to mock transfected cells. Scale bar, 2 μm.
Protein alignment reveals that the N‐terminal region of NELF‐E contains a putative PAR‐binding motif.
Purification of full‐length EGFP‐NELF‐E, and EGFP fused to nuclear localization signal (EGFP‐NLS) from U2OS cells using GFP‐TRAP. Eluted proteins were separated and stained with Coomassie. Mr indicates protein marker. The right panel shows purification of NELF‐E N‐terminal (spanning amino acids 1–250) and C‐terminal regions (spanning amino acids 251–380) fused to GST tag.
The N‐terminal region of NELF‐E binds PAR in vitro. PAR‐binding assay was performed using EGFP‐NELF‐E, EGFP‐NLS, GST‐N‐terminal, and GST‐C‐terminal of NELF‐E. Histone H3 was used as a positive control. IB: immunoblot. 32P: radiolabelled PAR.
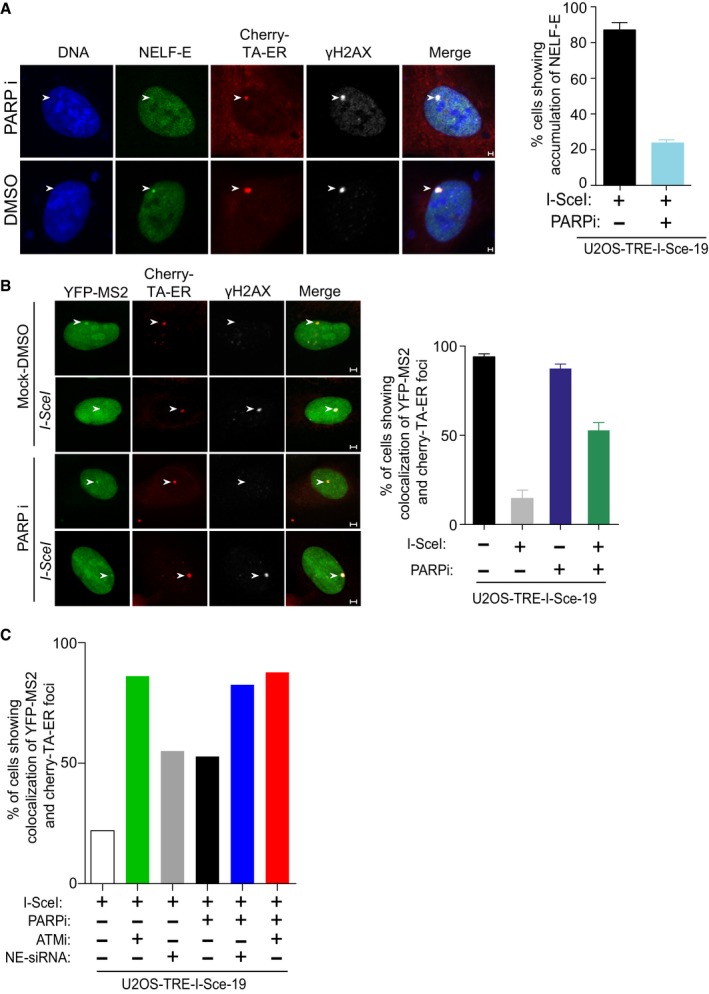
Pharmacological inhibition of PARP1 inhibits NELF‐E accumulation at I‐SceI‐induced DSBs. As in Fig 3B (top panel), except that cells were pretreated for 2 h with 4 μM PARP inhibitor prior to Tam treatment. Error bars indicate SD (n = 3). White arrowheads mark the location of the MS2 reporter cassette. Scale bar, 2 μm.
PARP inhibition alleviates DSB‐induced transcriptional repression of the MS2 gene. As in Fig 1E, except that cells were treated with PARP inhibitor as in (A) prior to Tam treatment. Error bars indicate SD (n = 3). White arrowheads mark the location of the MS2 reporter cassette. Scale bar, 2 μm.
Graph displays the percentage of cells that show co‐localization of YFP‐MS2 and Cherry‐tTA‐ER in U2OS‐TRE‐I‐Sce‐19 cells transfected with NELF‐E siRNA sequences and/or treated with inhibitor for either PARP and/or ATM kinase. Data represent the mean of 20 cells collected from two biological repeats.
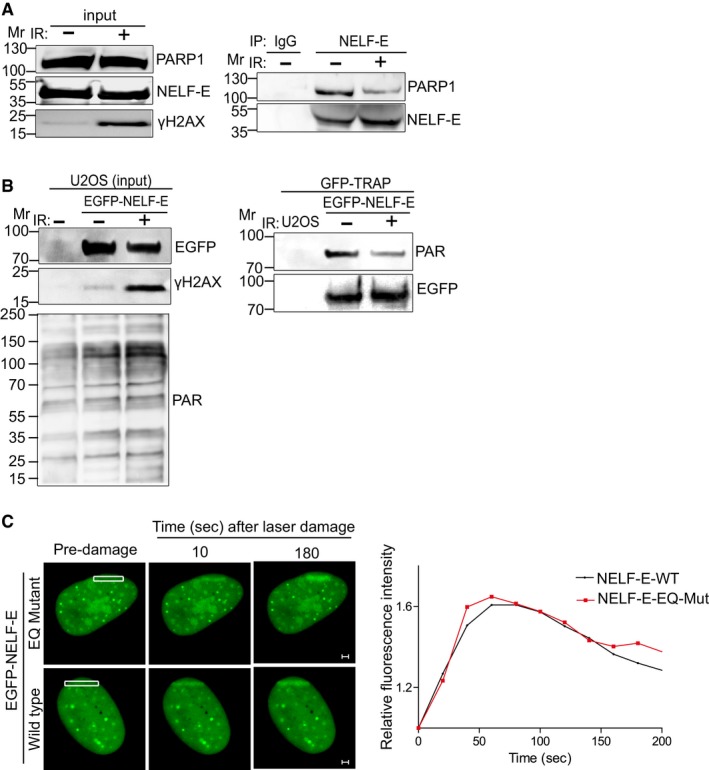
NELF‐E‐PARP1 interaction is reduced after IR. U2OS cells were subjected to NELF‐E immunoprecipitation before and after IR (cells were exposed to 10 Gy of IR and recovered for 10 min). The immunoprecipitated proteins were immunoblotted with either PARP1 or NELF‐E. IgG pull‐down is used as a negative control. Input samples were blotted with the indicated antibodies.
EGFP‐NELF‐E is less ADP‐ribosylated after IR. Control and EGFP‐NELF‐E expressing U2OS cells were exposed to IR as in (A), subjected to GFP‐TRAP and immunoblotted using PAR antibody. Next, the membrane was stripped and immunostained with GFP antibody. Input samples were immunostained with the indicated antibodies.
Representative time‐lapse images show the localization of EGFP‐NELF‐E wild type and EGFP‐NELF‐E‐EQ mutant at laser‐microirradiated sites (marked with white rectangle). Graph on the right shows fold increase in the relative fluorescence intensity (n = 2). Scale bar, 2 μm.
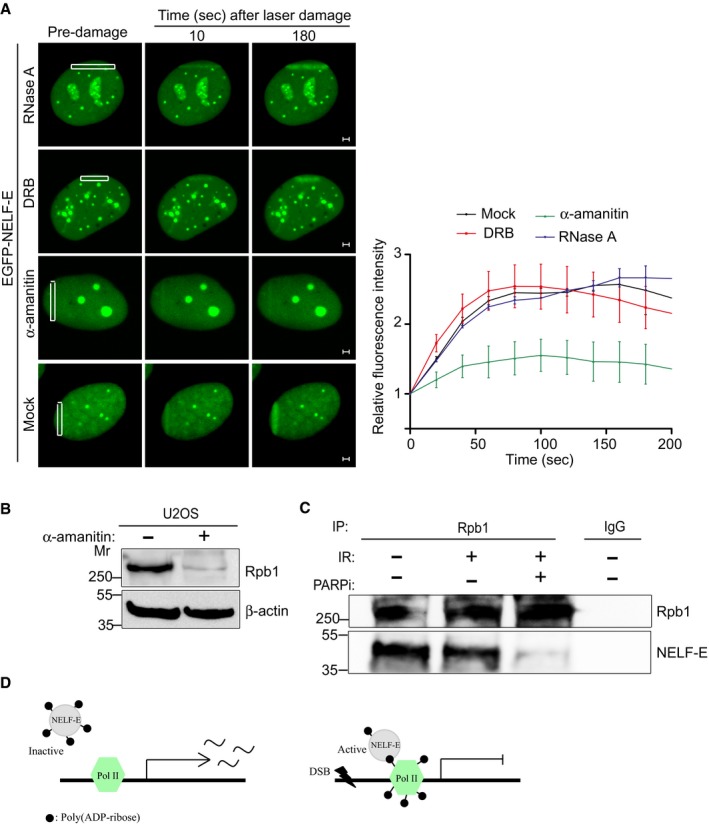
Representative time‐lapse images showing the localization of EGFP‐NELF‐E at laser‐microirradiated regions of cells that were untreated or treated with either RNase A, DRB, or α‐amanitin. Scale bar, 2 μm. Graph on the right shows fold increase in fluorescence intensity at laser‐microirradiated sites. Results shown are typical of three independent experiments and represent more than 15 different cells. Error bars indicate SEM.
Western blot shows that α‐amanitin triggers Rpb1 degradation. β‐actin was used as a loading control.
Rpb1 immunoprecipitation from mock and IR‐treated cells in the absence and presence of PARP inhibitor.
A hypothetical model shows that following DSB induction RNA pol II complex undergoes ADP‐ribosylation and thus proves a platform for recruiting the less ADP‐ribosylated form of NELF‐E to shut down transcription.
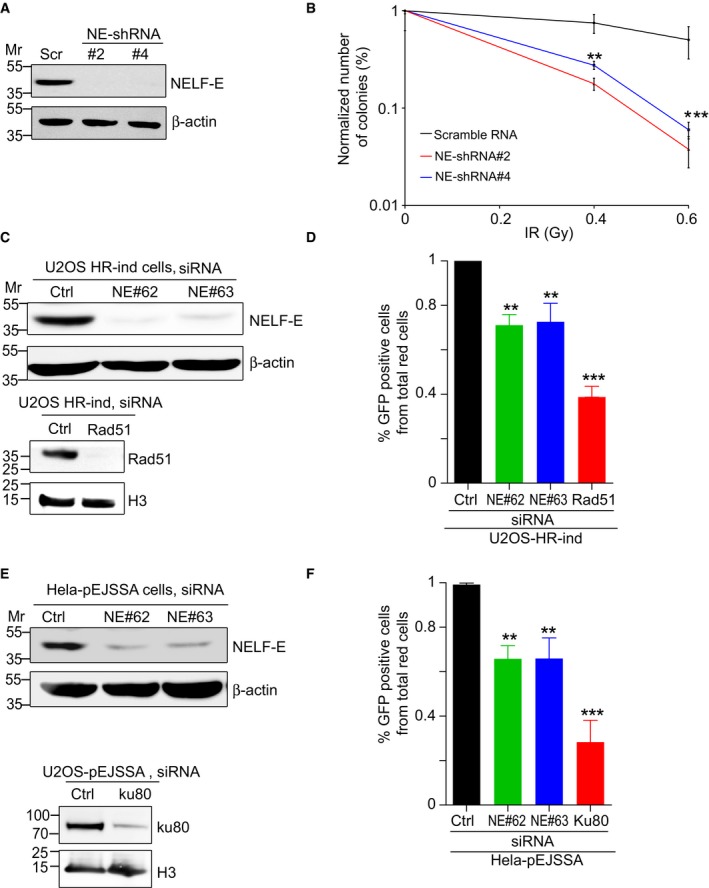
Western blot shows NELF‐E knockdown using two different shRNAs (#2 and #4). β‐actin was used as a loading control.
Colony formation assay shows that NELF‐E‐deficient cells are hypersensitive to IR. The numbers of colonies were normalized to the percentage of undamaged cells and plotted as a function of IR dosage. Error bars represent SEM (n = 4). Two‐way ANOVA was used to test for differences at each dose.
Western blot shows depletion of NELF‐E and Rad51 in U2OS‐HR‐ind cells transfected with NELF‐E and Rad51 siRNAs. β‐actin and histone H3 were used as loading controls.
NELF‐E promotes HDR of DSBs induced by I‐SceI endonuclease. To measure the integrity of HDR, U2OS‐HR‐ind cells were transfected with two different NELF‐E siRNAs and the efficiency of HDR was determined using flow cytometric analysis. For controls, U2OS‐HR‐ind cells were transfected with either control siRNA or Rad51 siRNA. Results shown are typical of three independent experiments. Error bars represent SD. P‐values were calculated by two‐sided Student's t‐test relative to Ctrl siRNA, **P < 0.01, ***P < 0.001.
Western blot shows depletion of NELF‐E in HeLa‐pEJSSA cells transfected with NELF‐E and Ku80 siRNAs. β‐actin and histone H3 were used as loading controls.
NELF‐E depletion affects the integrity of NHEJ of DSBs. NELF‐E‐depleted HeLa cells containing pEJSSA plasmid stably integrated into their genome were used to determine the efficiency of NHEJ as described in the Materials and Methods. For controls, HeLa‐pEJSSA cells were transfected with either control or Ku80 siRNA. Results shown are typical of three independent experiments. Error bars represent SD. P‐values were calculated by two‐sided Student's t‐test relative to Ctrl siRNA, **P < 0.01, ***P < 0.001.
Comment in
-
Switching genes to silent mode near DNA double-strand breaks.EMBO Rep. 2017 May;18(5):659-660. doi: 10.15252/embr.201744052. Epub 2017 Mar 23. EMBO Rep. 2017. PMID: 28336777 Free PMC article.
References
-
- Shiloh Y, Ziv Y (2013) The ATM protein kinase: regulating the cellular response to genotoxic stress, and more. Nat Rev Mol Cell Biol 14: 197–210 - PubMed
-
- Lord CJ, Ashworth A (2012) The DNA damage response and cancer therapy. Nature 481: 287–294 - PubMed
-
- Svejstrup JQ (2010) The interface between transcription and mechanisms maintaining genome integrity. Trends Biochem Sci 35: 333–338 - PubMed
Publication types
MeSH terms
Substances
LinkOut - more resources
Full Text Sources
Other Literature Sources
Research Materials
Miscellaneous
