. 2017 Mar 23;7(1):330.
doi: 10.1038/s41598-017-00349-8.

Fgf21 regulates T-cell development in the neonatal and juvenile thymus

Affiliations

Fgf21 regulates T-cell development in the neonatal and juvenile thymus

Yoshiaki Nakayama et al. Sci Rep. .

Abstract

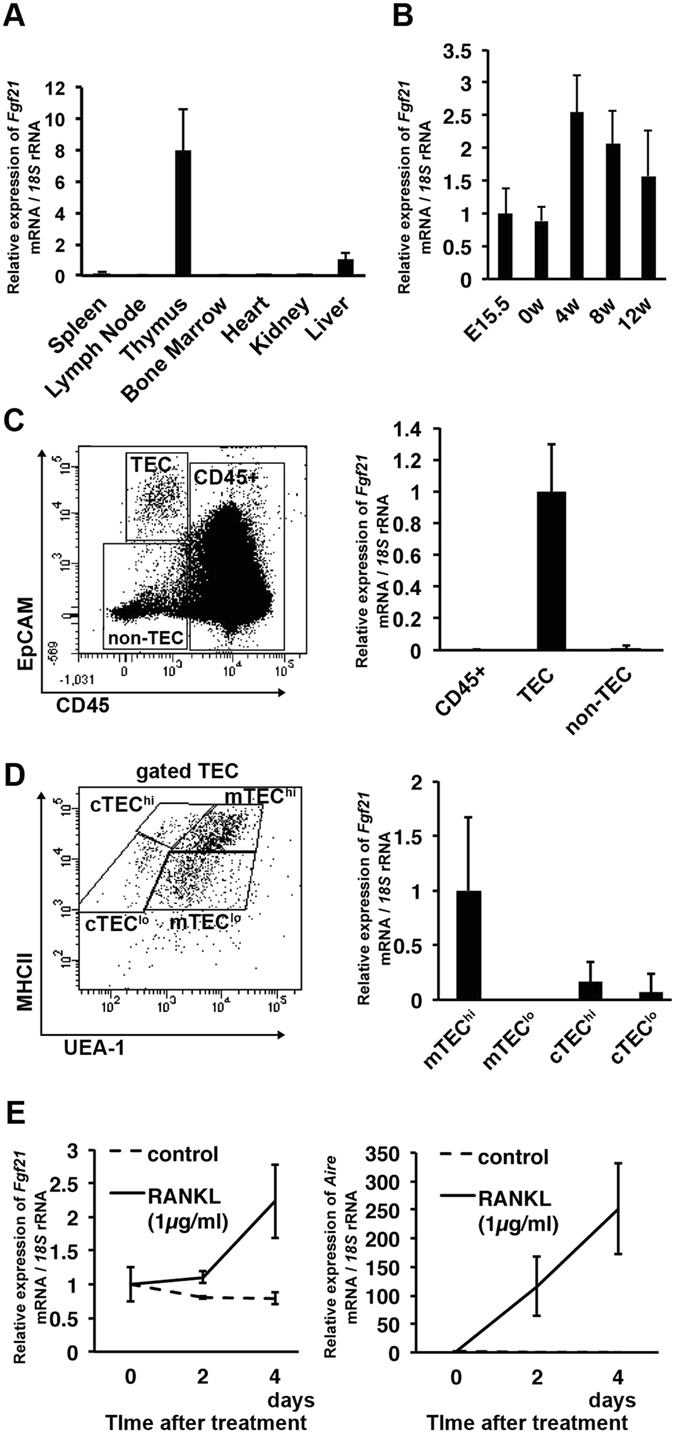
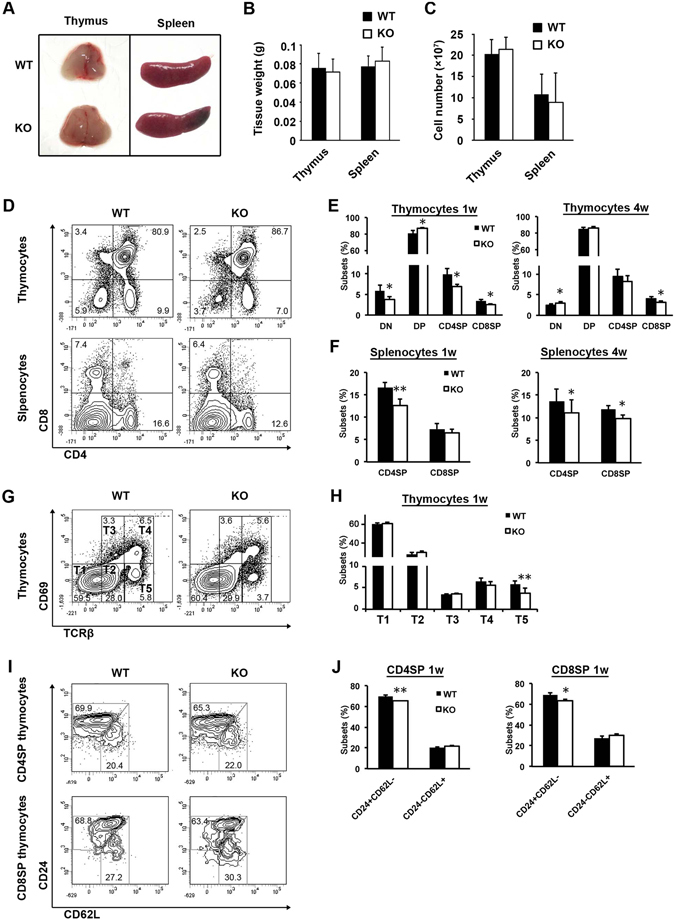
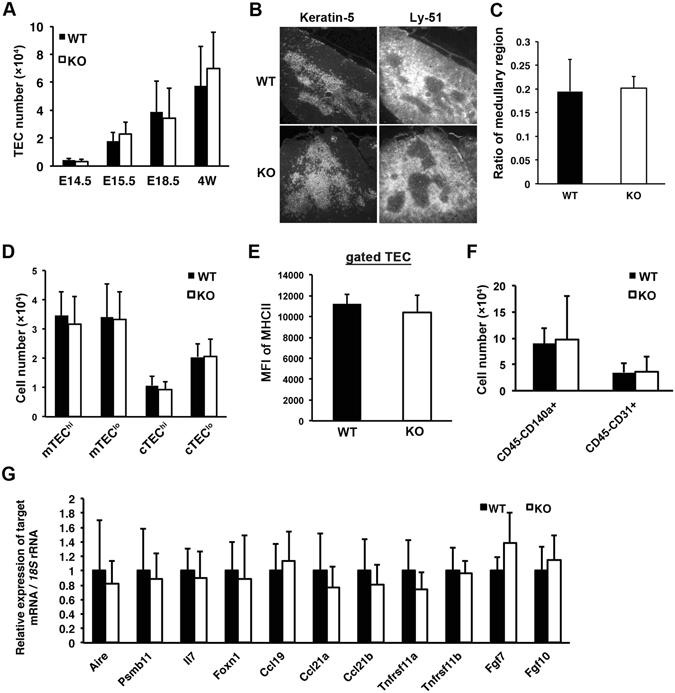
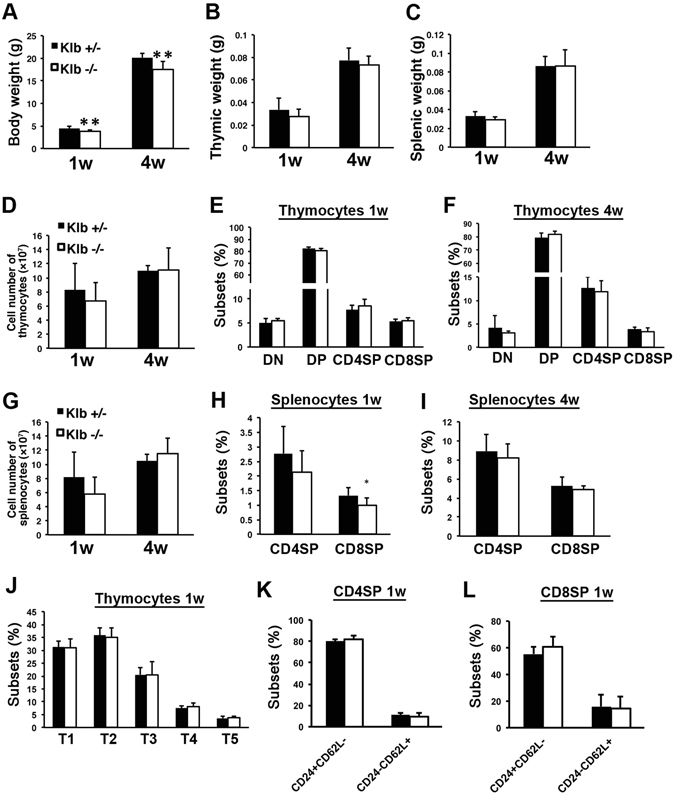
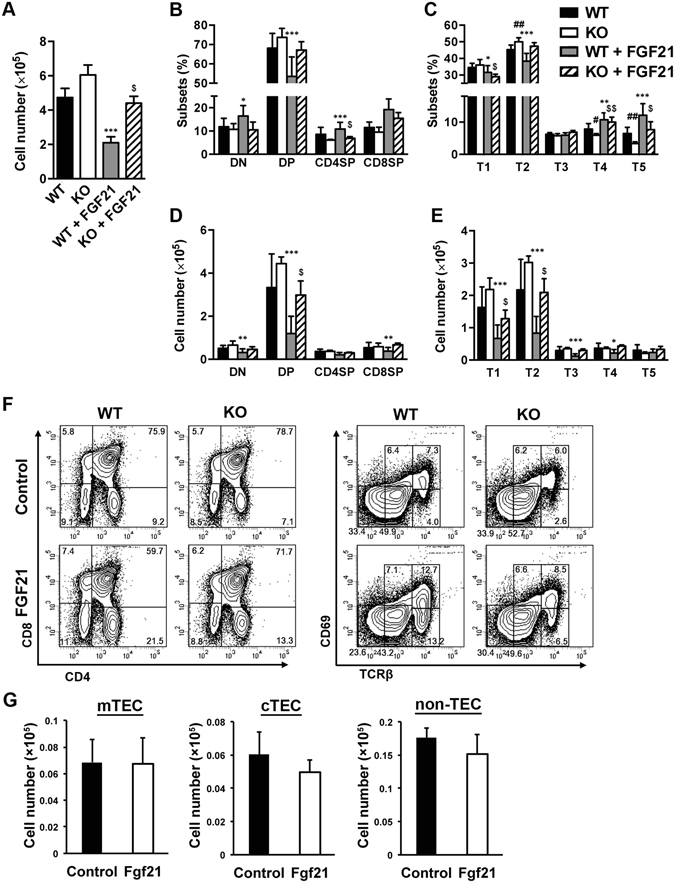
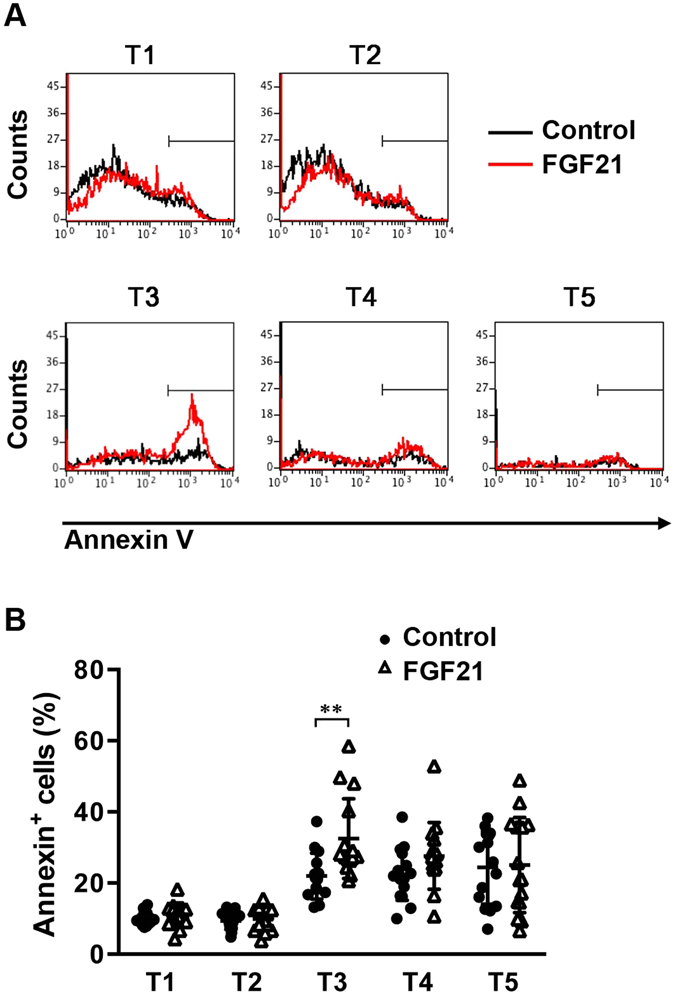
We have previously shown that Fibroblast growth factor 21 (Fgf21) is expressed in the thymus as well as in the liver. In line with this expression profile, Fgf21 was recently reported to protect against ageing-related thymic senescence by improving the function of thymic epithelial cells (TECs). However, the function of Fgf21 in the juvenile thymus remained to be elucidated. We investigated the physiological roles of Fgf21 in the juvenile thymus and found that young Fgf21 knockout mice, but not β-Klotho knockout mice nor adult Fgf21 knockout mice, showed a significant reduction in the percentage of single-positive CD4+ and CD8+ thymocytes without obvious alteration in TECs. Furthermore, treatment with recombinant FGF21 protein rescued the impairment in fetal thymus organ culture (FTOC) of Fgf21 knockout mice. Annexin V staining revealed FGF21 protein enhanced apoptosis of immature thymocytes undergoing selection process in FTOC, suggesting that FGF21 may facilitate the selection of developing T cells. Endocrine Fgf21 from the liver induced by metabolic stimulation did not affect juvenile thymocyte development. Our data suggest that Fgf21 acts as one of intrathymic cytokines in the neonatal and juvenile thymus, involving thymocyte development in a β-Klotho-independent manner.


Conflict of interest statement

The authors declare that they have no competing interests.

Figures

Figure 1
Figure 1
Fgf21 mRNA is enriched in mature mTECs. (A and B) Expression levels of Fgf21 mRNA in the various tissues from 4-week-old C57BL/6 mice (A) and in the thymus of E15.5 and 0-, 4-, 8- and 12-week-old (B). Relative Fgf21 mRNA expression was normalised against 18S rRNA expression. (C and D) Thymic cell suspensions from 4-week-old C57BL/6 mice were assessed by flow cytometric analysis using anti-CD45 mAb, anti-EpCAM mAb, anti-MHC II (I-A/I-E) mAb, and UEA-1 lectin, and expression levels of Fgf21 mRNA were determined by RT-realtime PCR in the subpopulations of thymic cells from 4-week-old C57BL/6 mice. (C) Anti-CD45 and anti-EpCAM staining discriminated CD45+, TEC (CD45EpCAM+), and non-TEC stromal cell (CD45EpCAM) subpopulations. (D) Gated TECs were subdivided into cTEChi (UEA-1MHChigh), cTEClo (UEA-1MHClow), mTEChi (UEA-1+MHChigh), and mTEClo (UEA-1+MHClow) subpopulations. (E) Thymocytes were removed from embryonic thymi by 1.35 mM dGuo treatment for 6 days, and remaining stromal cells were stimulated with 1 μg/ml RANKL to induce the maturation of TECs. Fgf21 and Aire mRNA were increased along with TEC maturation. Graphs represent the mean ± SD; n ≧5 replicates per group from at least 2 independent experiments.
Figure 2
Figure 2
CD4SP and CD8SP populations are decreased in Fgf21 KO mice. (A and B) Thymi and spleens were isolated from 4-week-old WT and Fgf21 KO mice, and their weights were measured. (C) Cell numbers of enzymatically digested suspensions from thymi and spleens were counted. (D) Thymocytes and splenocytes from WT and Fgf21 KO mice were stained with anti-CD4 and anti-CD8 mAb. Representative flow cytometry plots show CD4/CD8 analysis of thymocytes and splenocytes from 1-week-old WT and Fgf21 KO mice. (E) Charts show the percentage of DN, DP, CD8SP, and CD4SP cells from 1- and 4-week-old WT and Fgf21 KO mice. (F) Charts show the percent of CD4SP and CD8SP cells from 1- and 4-week-old WT and Fgf21 KO mice. (G) Thymocytes from 1-week-old WT and Fgf21 KO mice were defined by TCRβ and CD69 levels and subdivided into 5 subsets (T1; TCRβCD69, T2; TCRβintCD69, T3; TCRβintCD69+, T4; TCRβhiCD69+, and T5; TCRβhiCD69). (H) Charts show the percentage of the 5 subsets from 1-week-old WT and Fgf21 KO mice. (I) Gated CD4SP and CD8SP cells from 1-week-old WT and Fgf21 KO mice were defined by CD62L and CD24 levels and subdivided into CD24+CD62L immature and CD24CD62L+ mature SP cells. (J) Charts show the percentage of CD24+CD62L immature and CD24CD62L+ mature SP subsets from 1-week-old WT and Fgf21 KO mice. All data shown are the mean ± SD from ≧6 mice per genotype from 2 independent experiments. *P < 0.05, *P < 0.01 versus WT mice.
Figure 3
Figure 3
Fgfr and Klb are highly expressed in thymic stromal cells. (A–E) Relative mRNA expression of Fgfr1 (A), Fgfr2 (B), Fgfr3 (C), Fgfr4 (D), and Klb (E) in the thymus of E15.5 and 1-, 4-, 8- and 12-week-old (left panels), and in thymocyte subpopulations (T1-T5), TECs (CD45EpCAM+), and non-TEC stromal cells (CD45EpCAM) of 4-week-old C57BL/6 mice (right panels). Graphs represent the mean ± SD; n ≧ 5 replicates per group from at least 3 independent experiments.
Figure 4
Figure 4
Thymic stromal cells are not obviously altered in Fgf21 KO mice. (A) Enzymatically digested thymic cell suspensions were stained with anti-CD45 mAb and anti-EpCAM mAb, and the TEC (CD45EpCAM+) number was counted from the thymi of E14.5, E15.5, E18.5, and 4-week-old WT and Fgf21 KO mice. (B) Immunohistochemistry of WT and Fgf21 KO thymi with anti-Keratin-5 antibody for a medullary TEC marker (left panels) and anti-Ly-51 antibody for a cortical TEC marker (right panels). (C) The ratio of Keratin-5-positive thymic medullary regions was measured from immunostained sections. (D) Gated TECs of 1-weeks old were subdivided into mTEChi (Ly51MHChigh), mTEClo (Ly51MHClow), cTEChi (Ly51+MHChigh), and cTEClo (Ly+MHClow) subpopulations. Graphs represent the percentage of subpopulations. (E) The mean fluorescence intensity (MFI) of surface MHCII on the TEC was measured by flow cytometry with anti-MHCII antibody. (F) Gated CD45 thymic stromal cells of 1-weeks old were stained with anti-CD140a and anti-CD31 antibodies. Graphs represent the cellularity of CD45CD140a+ fibroblasts and CD45CD31a+ endothelial cells in the thymus of WT and Fgf21 KO mice. (G) The expression levels of thymic factors were measured in the thymus of 1-week-old WT and Fgf21 KO mice. Graphs represent the mean ± SD; n ≧ 5 replicates per group from at least 3 independent experiments.
Figure 5
Figure 5
Klb is not involved in the development of thymocytes. (A–C) Body, thymic, and splenic weights of 1- and 4-week-old Klb +/− and Klb −/− mice. Klb −/− mice showed decreased body weight compared to Klb +/− mice. (D and G) Cell numbers of enzymatically digested suspensions from thymi and spleens were counted. (E,F,H and I) Thymocytes and splenocytes from 1- and 4-week-old Klb +/− and Klb −/− mice were stained with anti-CD4 and anti-CD8 mAb. Charts show the percent of DN, DP, CD8SP, and CD4SP from 1- and 4-week-old Klb +/− and Klb −/− mice. (J) Thymocytes from 1-week-old Klb +/− and Klb −/− mice were defined by TCRβ and CD69 levels and subdivided into 5 subsets. Charts show the percentage of the 5 subsets from 1-week-old Klb +/− and Klb −/− mice. (K and L) Charts show the percentage of CD24+CD62L immature and CD24CD62L+ mature SP subsets from gated CD4SP (K) and CD8SP cells (L) of 1-week-old Klb +/− and Klb −/− mice. All data shown are the mean ± SD from ≧8 mice per genotype. *P < 0.05, *P < 0.01 versus Klb +/− mice.
Figure 6
Figure 6
FGF21 treatment alters T-cell development in FTOC. WT and Fgf21 KO foetal thymi were cultured with or without recombinant human FGF21 protein (500 ng/ml) for 14 days. (A) Total cell numbers of thymocytes in FTOCs are presented. Flow cytometry analysis of CD4/8 (B) and TCRβ/CD69 (C) distribution and thymocyte subset number (D and E). (F) Representative flow cytometry data for each FTOC. (G) Numbers of mTEC (CD45EpCAM+UEA-1+), cTEC (CD45EpCAM+UEA-1), and non-TEC stromal cells (CD45EpCAM) are shown. Data represents the mean ± SD of two separate experiments. *,#P < 0.05, **,##P < 0.01, and ***P < 0.001 versus WT without rhFGF21, $P < 0.05, and $$P < 0.01 versus Fgf21 KO without rhFGF21.
Figure 7
Figure 7
FGF21 treatment results in increased apoptosis of immature thymocytes. FTOC was performed in the presence or absence of recombinant human FGF21 (500 ng/ml) for 14 days. Annexin V staining was performed to detect apoptotic T cells by flow cytometry. (A) Representative histograms show the percentage of Annexin V+ cells in gated thymocyte subsets. (B) Graph showing the analysis of the percentage of Annexin V+ cells in thymocytes from FTOCs. All data shown are the mean ± SD. **P < 0.01 versus control.
Figure 8
Figure 8
Fgf21 induced by protein-free diet does not affect thymic change by protein malnutrition. (A) Serum Fgf21 levels of 4-week-old C57BL/6 mice fed for 1 week with normal chow diet (NC) or protein-free diet (PF) were determined with ELISA assays. Data shown are the mean ± SD from ≧6 mice. **P < 0.001 versus NC. (B) Relative expression levels of Fgf21 mRNA in the liver, thymus, subcutaneous white adipose tissue (sWAT), and skeletal muscle from mice fed with NC or PF. Data shown are the mean ± SD from ≧6 mice. **P < 0.01, **P < 0.001 versus NC. (C–F) Body weight (C), blood glucose (D), thymic weight (E), and thymic cell number (F) of WT and Fgf21 KO mice fed with NC or PF. Data shown are the mean ± SD from ≧5 mice. *P < 0.05, #P < 0.05 versus WT and Fgf21 KO mice fed with NC, respectively. $P < 0.05 versus WT mice fed with PF. (G and H) Thymocytes from WT and Fgf21 KO mice fed with NC or PF were stained with anti-CD4 and anti-CD8 mAb (G), or anti-TCRβ and anti-CD69 mAb (H). All data shown are the mean ± SD from ≧5 mice. *P < 0.05, #P < 0.05 versus WT and Fgf21 KO mice fed with NC, respectively. $P < 0.05 versus WT mice fed with PF.

Similar articles

Cited by

References

    1. Itoh N, Ornitz DM. Fibroblast growth factors: From molecular evolution to roles in development, metabolism and disease. J. Biochem. 2011;149:121–130. doi: 10.1093/jb/mvq121. - DOI - PMC - PubMed
    1. Kharitonenkov A, et al. FGF-21 as a novel metabolic regulator. J. Clin. Invest. 2005;115:1627–1635. doi: 10.1172/JCI23606. - DOI - PMC - PubMed
    1. Kharitonenkov A, Adams AC. Inventing new medicines: The FGF21 story. Mol. Metab. 2014;3:221–229. doi: 10.1016/j.molmet.2013.12.003. - DOI - PMC - PubMed
    1. Talukdar S, et al. A long-acting FGF21 molecule, PF-05231023, decreases body weight and improves lipid profile in non-human primates and type 2 diabetic subjects. Cell Metab. 2016;23:427–440. doi: 10.1016/j.cmet.2016.02.001. - DOI - PubMed
    1. Itoh N. FGF21 as a hepatokine, adipokine, and myokine in metabolism and diseases. Front. Endocrinol. (Lausanne) 2014;5:4–7. - PMC - PubMed

Publication types

MeSH terms

Substances