. 2017 Mar 23;7(1):335.
doi: 10.1038/s41598-017-00444-w.

Real-time observational evidence of changing Asian dust morphology with the mixing of heavy anthropogenic pollution

Affiliations

Real-time observational evidence of changing Asian dust morphology with the mixing of heavy anthropogenic pollution

Xiaole Pan et al. Sci Rep. .

Abstract

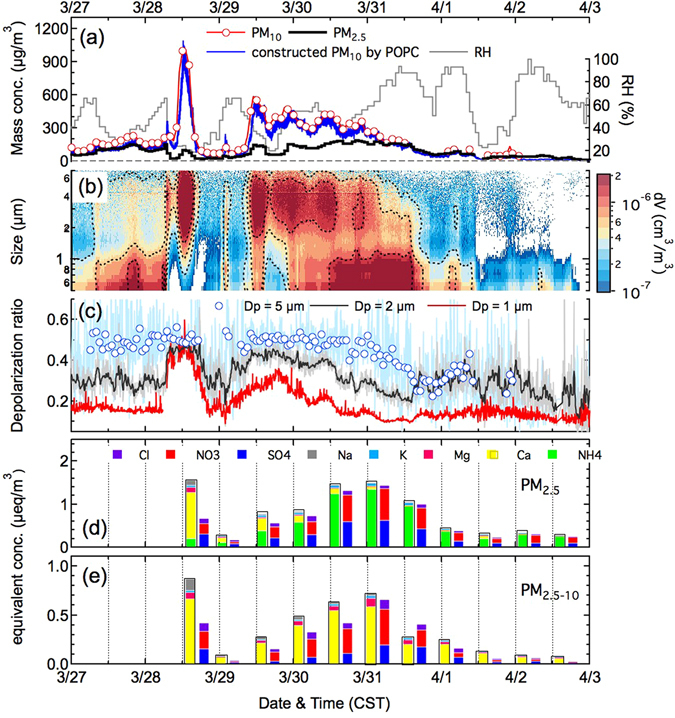
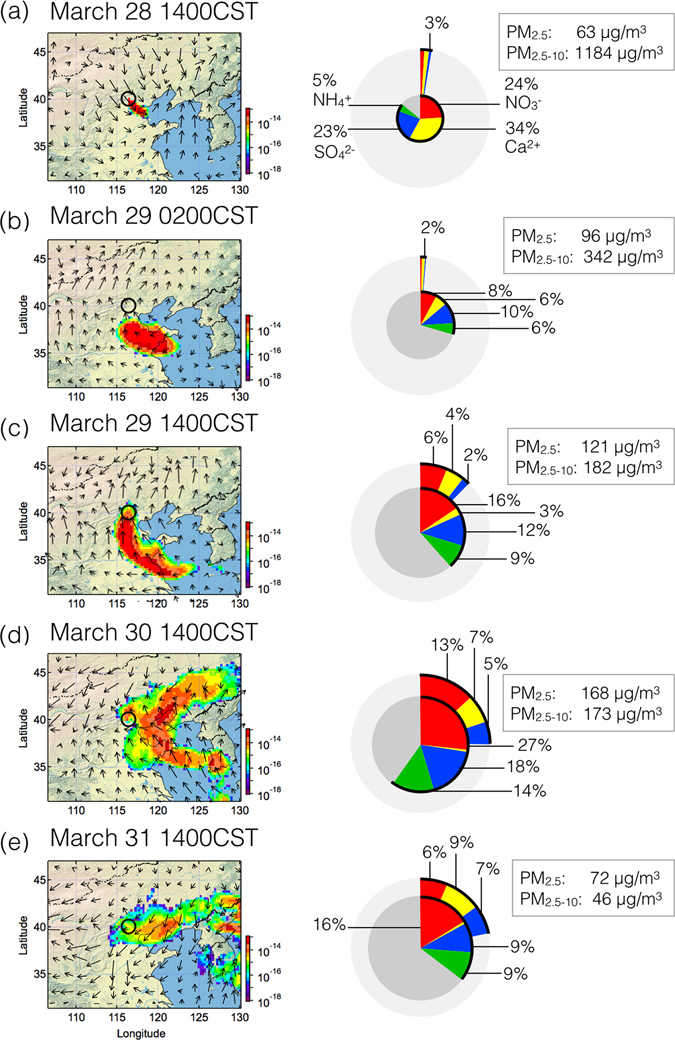
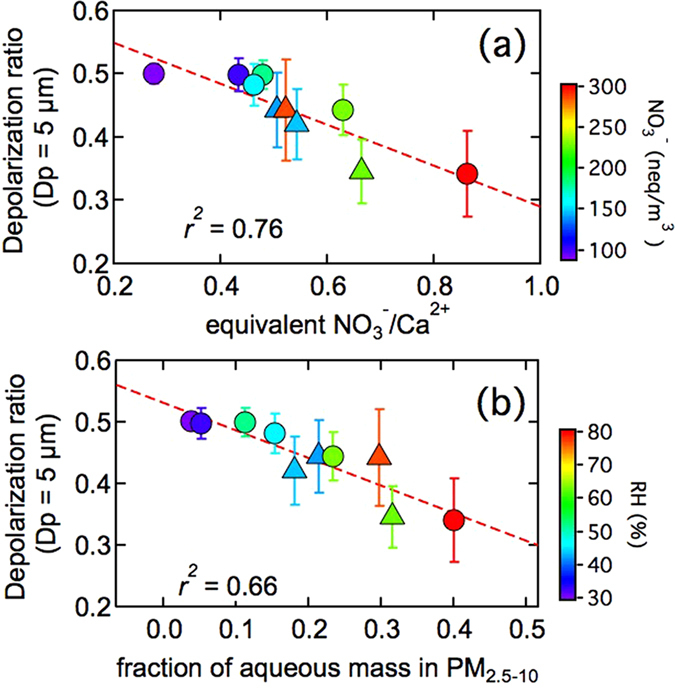
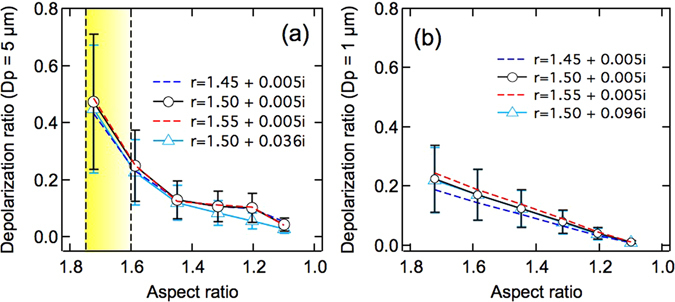
Natural mineral dust and heavy anthropogenic pollution and its complex interactions cause significant environmental problems in East Asia. Due to restrictions of observing technique, real-time morphological change in Asian dust particles owing to coating process of anthropogenic pollutants is still statistically unclear. Here, we first used a newly developed, single-particle polarization detector and quantitatively investigate the evolution of the polarization property of backscattering light reflected from dust particle as they were mixing with anthropogenic pollutants in North China. The decrease in observed depolarization ratio is mainly attributed to the decrease of aspect ratio of the dust particles as a result of continuous coating processes. Hygroscopic growth of Calcium nitrate (Ca(NO3)2) on the surface of the dust particles played a vital role, particularly when they are stagnant in the polluted region with high RH conditions. Reliable statistics highlight the significant importance of internally mixed, 'quasi-spherical' Asian dust particles, which markedly act as cloud condensation nuclei and exert regional climate change.


Conflict of interest statement

The authors declare that they have no competing interests.

Figures

Figure 1
Figure 1
Time series of the observed mass concentration of PM2.5, PM10 and constructed PM10 according to the POPC measurement, relative humidity (a), volume size distribution (b), hourly averaged depolarization ratio at Dp = 1 μm, 2 μm and 5 μm (c) and equivalent concentrations of identified water-soluble compounds in both the fine mode (PM2.5) (d) and coarse mode (PM2.5–10) (e) on the basis of filter-based chromatography analysis.
Figure 2
Figure 2
Footprint of the dust plume simulated by the HYSPLIT dispersion model ((a) detailed description of the simulation is shown in Method) during the dust-influencing period (on the left). The tracer particles were released from 500–1000 m above ground level at the observation site and dispersed for 5 days. The mass concentration of the particle (in mass/m3) ranged from 0 to 1000 m every 3 hours. The figures on the right show corresponding mass concentrations of water-soluble inorganic matter (SO4 2−: blue; NO3 : red; NH4 +: green; and Ca2+: yellow) in total PM2.5 (inner Pi-chart) and PM2.5–10 (outer gray ring). The maps were drawn by the software Igor Pro, http://www.wavemetrics.com/.
Figure 3
Figure 3
Relationship between the depolarization ratio of dust particles (Dp = 5 μm) and equivalent ratio of NO3 /Ca2+ (a) and the mass fraction of aqueous matter in the coarse mode (b). The colored circles in the plot represent the data during dust impact period from March 28 to April 1, 2015. The standard deviation (error bar) of depolarization ratio of dust particle was calculated for the dataset corresponding to filter sampling period. The color triangles indicate another weak floating dust case from April 9 to April 11, 2015. The backward trajectory analysis using HYSPLIT indicated that the air mass also came from northwest. Although none of the same dust plume was observed, the impact of anthropogenic pollutants on the depolarization ratio of the dust particle was similar.
Figure 4
Figure 4
Theoretical simulation of the depolarization ratio of randomly oriented elongated ellipsoid particles as a function of the aspect ratio at Dp = 5 μm (a) and Dp = 1 μm (b) on the basis of the T-matrix methodology.

References

    1. Pachauri, R. K. et al. Climate change 2014: synthesis Report. Contribution of working groups I, II and III to the fifth assessment report of the intergovernmental panel on climate change (IPCC, 2014).
    1. Knippertz, P. & Stuut, J.-B. W. Mineral Dust: A Key Player in the Earth System (Springer, 2014).
    1. Kaufman YJ, Tanré D, Boucher O. A satellite view of aerosols in the climate system. Nature. 2002;419:215–223. doi: 10.1038/nature01091. - DOI - PubMed
    1. Uno I, et al. Asian dust transported one full circuit around the globe. Nature Geoscience. 2009;2:557–560. doi: 10.1038/ngeo583. - DOI
    1. Jickells TD, et al. Global iron connections between desert dust, ocean biogeochemistry, and climate. Science. 2005;308:67–71. doi: 10.1126/science.1105959. - DOI - PubMed

Publication types

LinkOut - more resources