. 2017 Mar 8:8:123.
doi: 10.3389/fphys.2017.00123. eCollection 2017.

3D Proximal Tubule Tissues Recapitulate Key Aspects of Renal Physiology to Enable Nephrotoxicity Testing

Affiliations

3D Proximal Tubule Tissues Recapitulate Key Aspects of Renal Physiology to Enable Nephrotoxicity Testing

Shelby M King et al. Front Physiol. .

Abstract

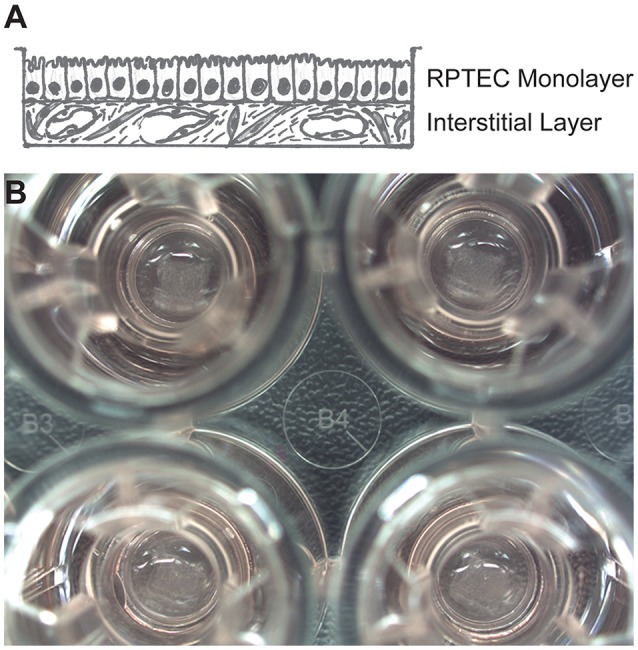
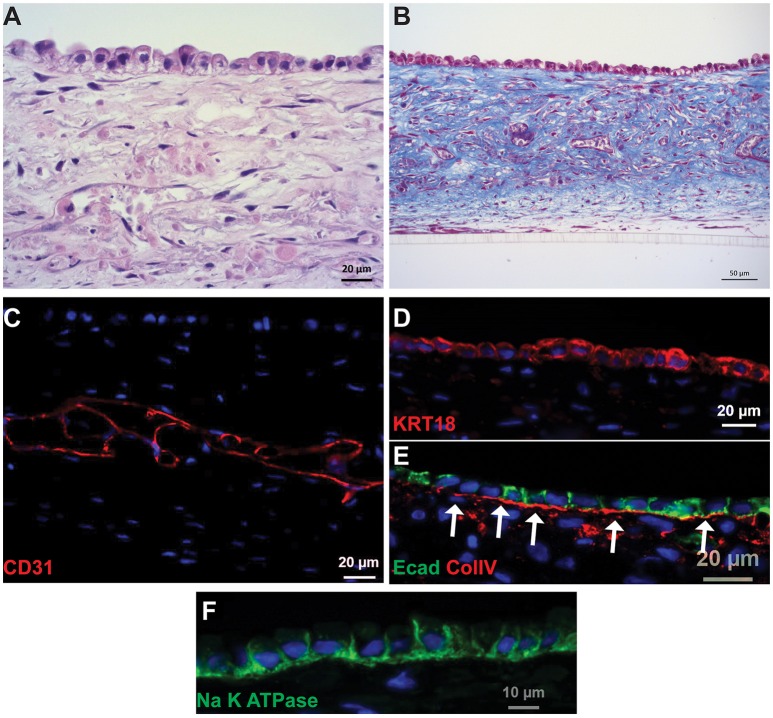
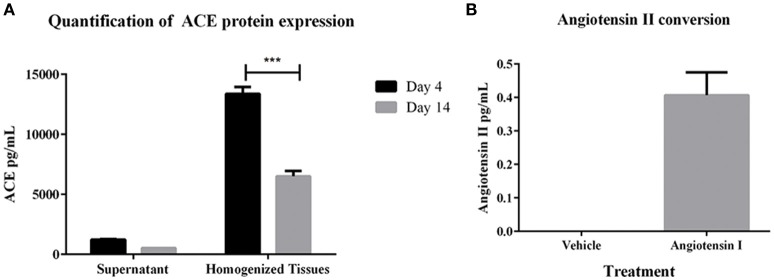
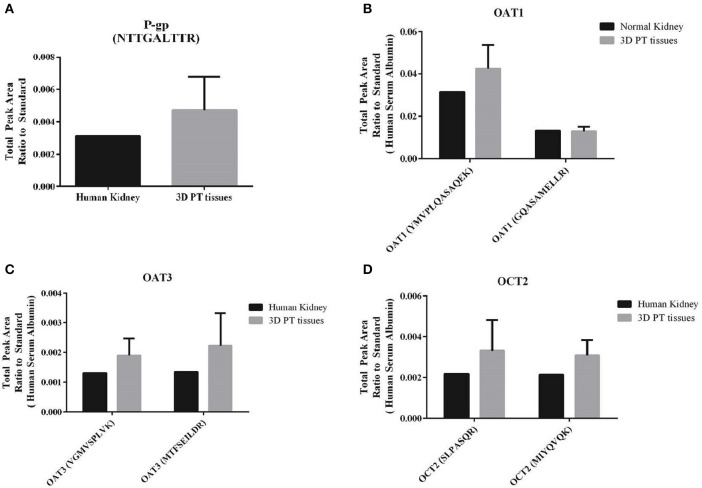
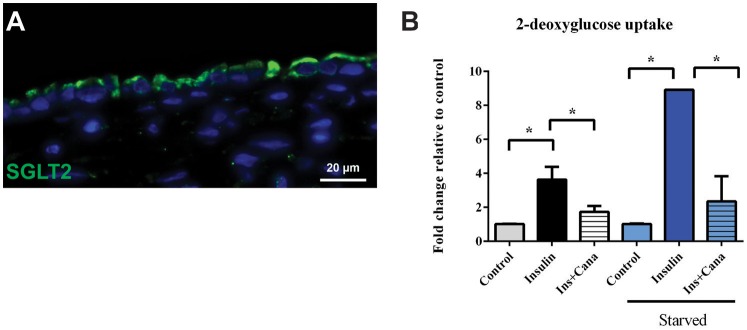
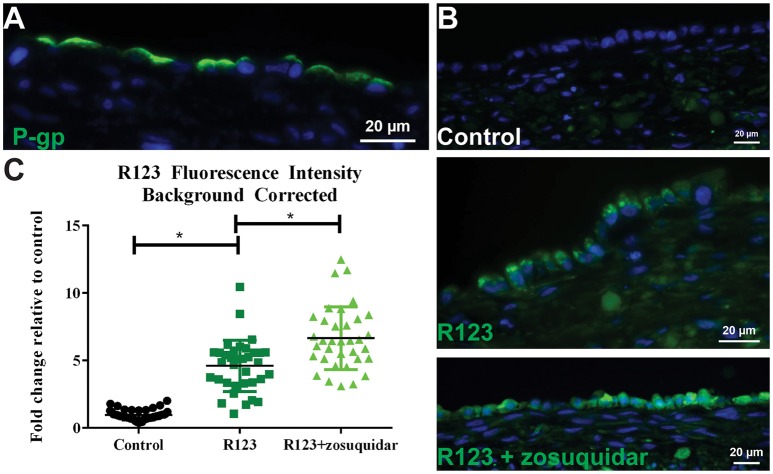
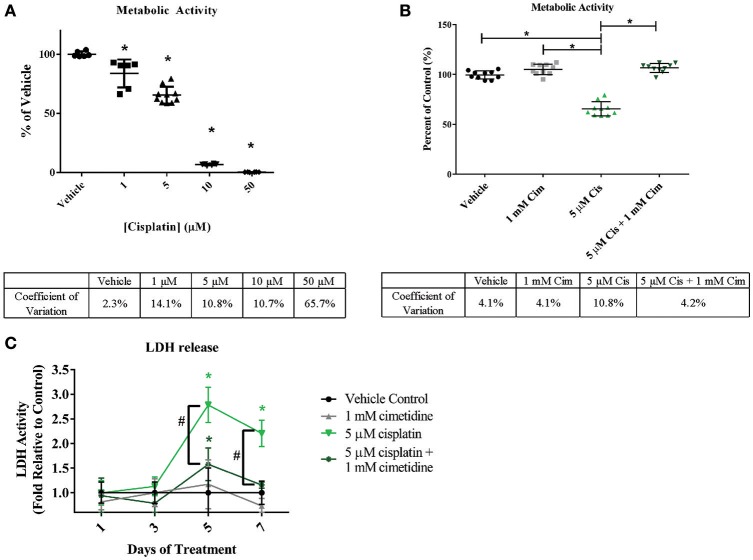
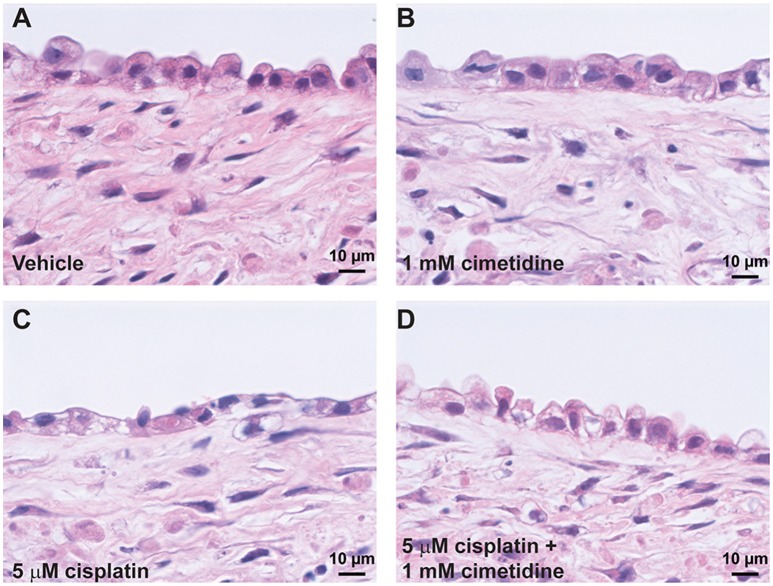
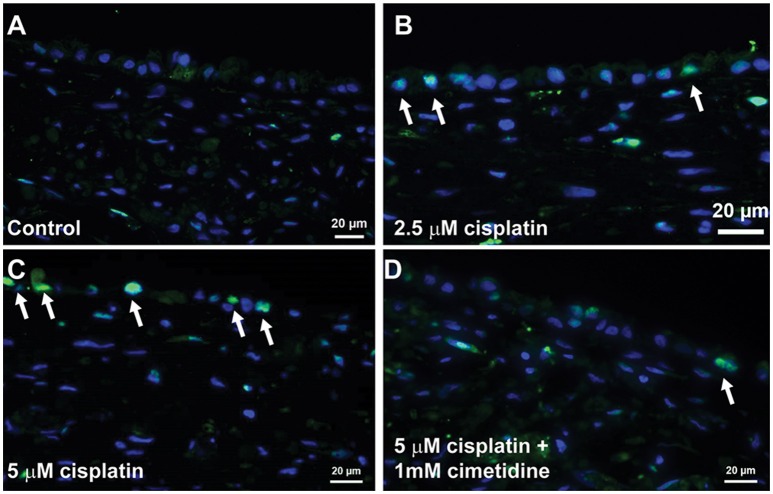
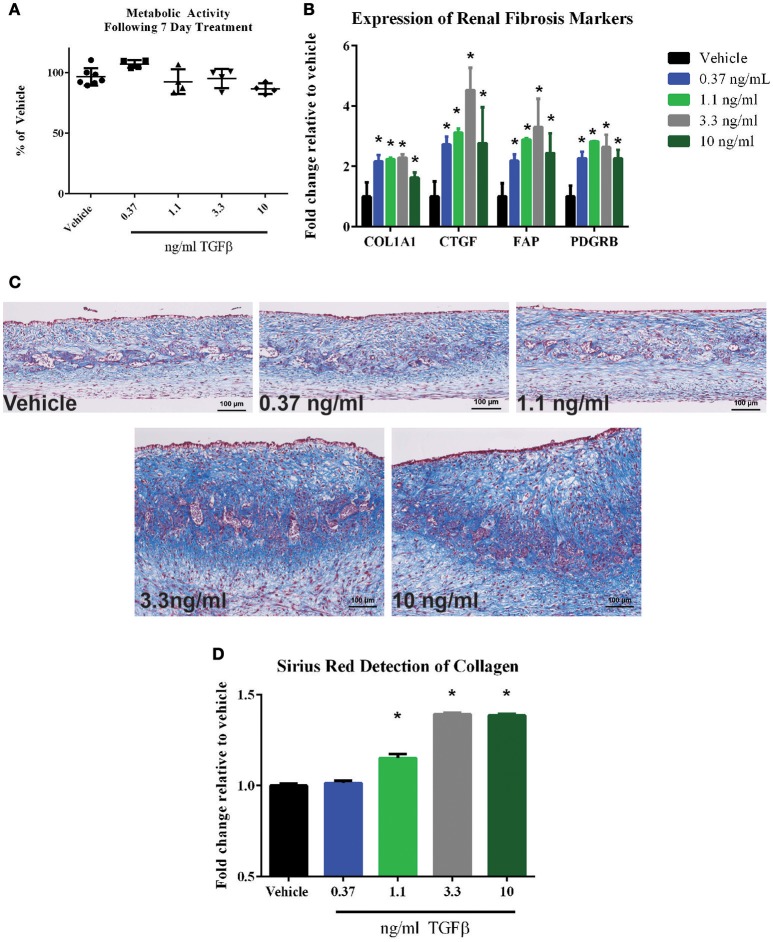
Due to its exposure to high concentrations of xenobiotics, the kidney proximal tubule is a primary site of nephrotoxicity and resulting attrition in the drug development pipeline. Current pre-clinical methods using 2D cell cultures and animal models are unable to fully recapitulate clinical drug responses due to limited in vitro functional lifespan, or species-specific differences. Using Organovo's proprietary 3D bioprinting platform, we have developed a fully cellular human in vitro model of the proximal tubule interstitial interface comprising renal fibroblasts, endothelial cells, and primary human renal proximal tubule epithelial cells to enable more accurate prediction of tissue-level clinical outcomes. Histological characterization demonstrated formation of extensive microvascular networks supported by endogenous extracellular matrix deposition. The epithelial cells of the 3D proximal tubule tissues demonstrated tight junction formation and expression of renal uptake and efflux transporters; the polarized localization and function of P-gp and SGLT2 were confirmed. Treatment of 3D proximal tubule tissues with the nephrotoxin cisplatin induced loss of tissue viability and epithelial cells in a dose-dependent fashion, and cimetidine rescued these effects, confirming the role of the OCT2 transporter in cisplatin-induced nephrotoxicity. The tissues also demonstrated a fibrotic response to TGFβ as assessed by an increase in gene expression associated with human fibrosis and histological verification of excess extracellular matrix deposition. Together, these results suggest that the bioprinted 3D proximal tubule model can serve as a test bed for the mechanistic assessment of human nephrotoxicity and the development of pathogenic states involving epithelial-interstitial interactions, making them an important adjunct to animal studies.

Keywords: 3D model; drug safety; nephrotoxicity; proximal tubule; renal transporters.


Figures

Figure 1
Figure 1
Description of a 3D model of the PT tubulointerstitial interface printed with the NovoGen Bioprinter® instrument. (A) Schematic diagram showing a multicellular interstitial layer underlying a basement membrane that supports an epithelial monolayer. (B) Macroscopic view of 3D PT tissues positioned on Transwell inserts in a standard 24-well plate (Corning Costar, Corning, NY).
Figure 2
Figure 2
Histological characterization of 3D PT tissues. Representative images of tissues cultured for 14 days are shown. (A) H&E stain showing fully cellular tissue and organization of interstitial and epithelial layers. (B) Gomori's trichrome stain showing deposition of collagen throughout the tissue. (C) The interstitial layer demonstrates extensive endothelial cell-lined networks (red, CD31). (D) RPTEC form a monolayer and express cytokeratin 18 (red). (E) A collagen IV-rich basement membrane underlies the epithelial cells and E-cadherin localizes to tight junctions between the cells (red, collagen IV; green, E-cadherin). (F) Na+K+ATPase localizes to the basolateral membrane of RPTEC.
Figure 3
Figure 3
RAS pathway component activity in 3D PT tissues. (A) Expression levels of ACE in supernatant and lysates from 3D PT tissues cultured 4 or 14 days. (B) Detection of angiotensin II following ACE-mediated conversion of exogenous angiotensin I. Data shown is the mean of duplicate measurements from 3 independent tissue samples plus or minus the standard error of the mean. ***p < 0.001.
Figure 4
Figure 4
Detection of renal transporter peptides by LC-MS/MS. After 14 days in culture, 3D PT tissues or human kidney cortical tissue were subjected to tryptic digestion and relative quantitation of renal transporter peptides by mass spectrometry. (A) Detection of P-gp. (B) Detection of OAT1 using 2 different peptides. (C) Detection of OAT3 using 2 different peptides. (D) Detection of OCT2 using 2 different peptides. Data shown is the mean from 5 independent tissue samples plus or minus the standard error of the mean.
Figure 5
Figure 5
SGLT2 transporter localization and function. (A) After 14 days in culture, 3D PT tissues were stained with antibodies against SGLT2 (green). (B) Tissues were assessed for retention of the non-metabolizable glucose analog 2-DG in a colorimetric assay in the presence or absence of the glucose uptake inducer insulin or the SGLT2 inhibitor canalgliflozin (Cana). Starved tissues are indicated by the blue family of bars. Data shown is the mean of triplicate measurements across 6 independent tissue samples plus or minus the standard error of the mean. *p < 0.01 between the groups compared by one-way ANOVA.
Figure 6
Figure 6
P-gp transporter localization and function. (A) After 14 days in culture, 3D PT tissues were stained with antibodies against P-gp (green). (B) Tissues were exposed to 5 μM zosuquidar alone, 10 μM rhodamine 123, or rhodamine 123 + zosuquidar for 2 h. Tissues were snap fixed, cryosectioned, and all tissues were imaged at the same exposure time. (C) Fluorescence intensity was quantified in Image J. Data shown represents the mean of duplicate measurements from at least 6 independent tissue samples plus or minus the standard error of the mean. *p < 0.0001 between the groups as compared by one-way ANOVA.
Figure 7
Figure 7
Reduction of overall viability in 3D PT tissues in response to cisplatin and rescue by the OCT2 inhibitor cimetidine. Tissues were treated daily for 7 days with increasing doses of cisplatin (A) or with 5 μM cisplatin (Cis) in the presence or absence of 1mM cimetidine (Cim; B). Cimetidine alone was also tested as a control (B). Overall tissue viability was measured by alamarBlue metabolism. Data shown is indicative of duplicate measurements from 3 individual tissues. Asterisks (*) indicate p < 0.0005 compared to vehicle control by one-way ANOVA and Dunnett's post-test. % CV across multiple 3D PT tissues from separate experiments at each time point is shown below each graph. (C) Daily LDH release from tissues treated with cimetidine, cisplatin, or a combination of cisplatin and cimetidine as a measure of toxicity. Data shown represents the mean of duplicate measurements from 3 independent tissue samples plus or minus standard deviation. Asterisks (*) indicate p < 0.002 between vehicle and treatment groups as assessed by two-way ANOVA. Number sign (#) indicates p < 0.001 between 5 μM cisplatin and 5 μM cisplatin + 1 mM cimetidine as assessed by two-way ANOVA.
Figure 8
Figure 8
Histological analysis of cisplatin toxicity. Representative H&E images are shown for tissues dosed daily for 7 days with vehicle (A), 1 mM cimetidine (B), 5 μM cisplatin (C), or 5 μM cisplatin + 1 mM cimetidine (D).
Figure 9
Figure 9
Proliferation of RPTEC in response to damage. Tissues were dosed daily for 7 days with vehicle (A), 2.5 μM cisplatin (B), 5 μM cisplatin (C), or 5 μM cisplatin + 1 mM cimetidine (D) and stained with an antibody against PCNA. Proliferating cells are marked with white arrows.
Figure 10
Figure 10
Response of 3D PT tissues to TGFβ. Tissues were dosed daily for 7 days with vehicle, 0.37 ng/ml TGFβ, 1.1 ng/ml TGFβ, 3.3 ng/ml TGFβ, or 10 ng/ml TGFβ. (A) alamarBlue analysis of overall tissue metabolic activity. Data shown is the average of 3 tissue samples per condition and is represented as the fold change relative to the vehicle control. No statistically significant differences were detected between treatment groups. (B) Induction of the fibrotic markers collagen I (COL1A1), connective tissue growth factor (CTGF), fibroblast-activating protein (FAP), or platelet-derived growth factor receptor β (PDGFRB) was assessed by quantitative RT-PCR. Data shown is the average of 3 tissue samples per condition and is represented as the fold change relative to the vehicle control. *p < 0.0001 for each condition compared to vehicle. (C) Representative Gomori's trichrome stains for ECM deposition are shown. (D) Quantification of Sirius red-stained collagen in tissue sections is shown. Data represents the average of 4 technical replicates per tissue, 3 tissues per condition and is represented as the fold change relative to the vehicle control following normalization to total protein content as measured by Fast Green staining. *p < 0.05 for each condition compared to vehicle.

References

    1. Astashkina A. I., Mann B. K., Prestwich G. D., Grainger D. W. (2012). A 3-D organoid kidney culture model engineered for high-throughput nephrotoxicity assays. Biomaterials 33, 4700–4711. 10.1016/j.biomaterials.2012.02.063 - DOI - PubMed
    1. Boulpaep E. L., Seely J. F. (1971). Electrophysiology of proximal and distal tubules in the autoperfused dog kidney. Am. J. Physiol. 221, 1084–1096. - PubMed
    1. Brenner B. M. (2008). Brenner and Rector's The Kidney. Philadelphia, PA: Saunders Elsevier.
    1. Bryant D. M., Mostov K. E. (2008). From cells to organs: building polarized tissue. Nat. Rev. Mol. Cell Biol. 9, 887–901. 10.1038/nrm2523 - DOI - PMC - PubMed
    1. Choudhury D., Ahmed Z. (2006). Drug-associated renal dysfunction and injury. Nat. Clin. Pract. Nephrol. 2, 80–91. 10.1038/ncpneph0076 - DOI - PubMed