. 2016 Dec 10:14:286-297.
doi: 10.1016/j.nicl.2016.12.006. eCollection 2017.

Network degeneration and dysfunction in presymptomatic C9ORF72 expansion carriers

Affiliations

Network degeneration and dysfunction in presymptomatic C9ORF72 expansion carriers

Suzee E Lee et al. Neuroimage Clin. .

Abstract

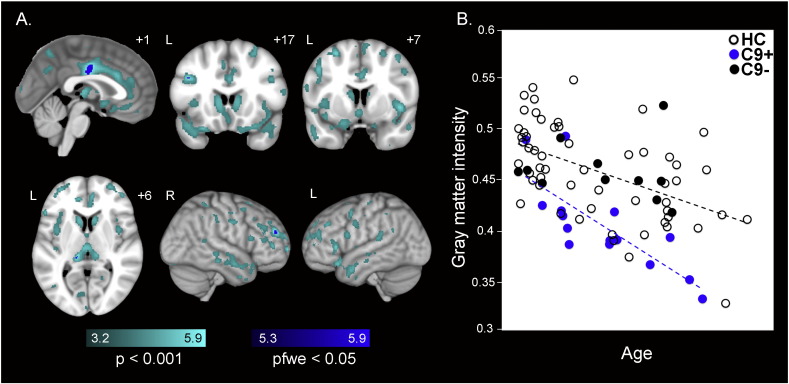
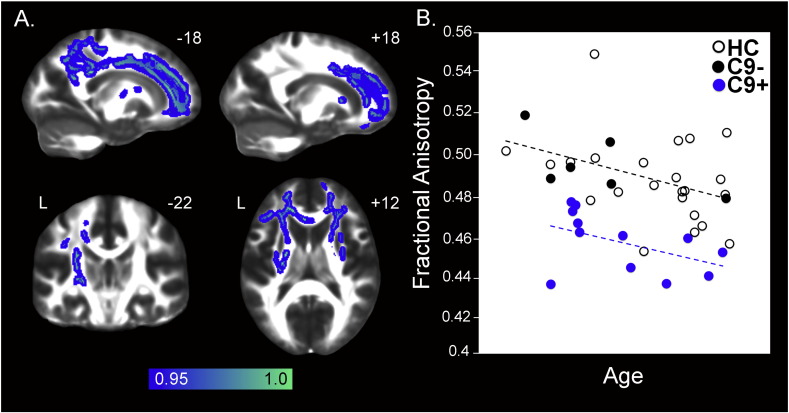
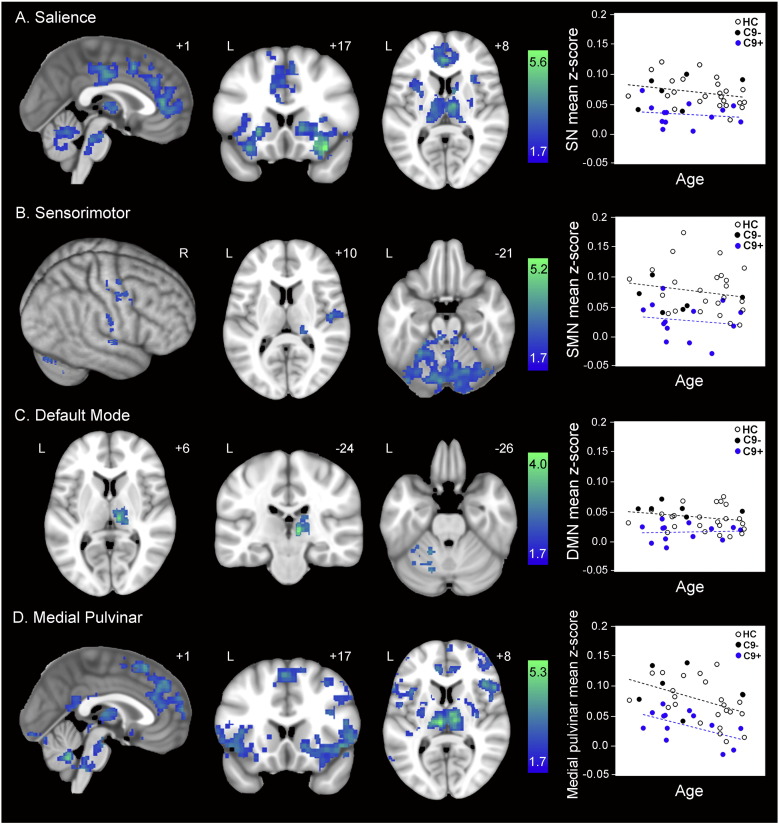
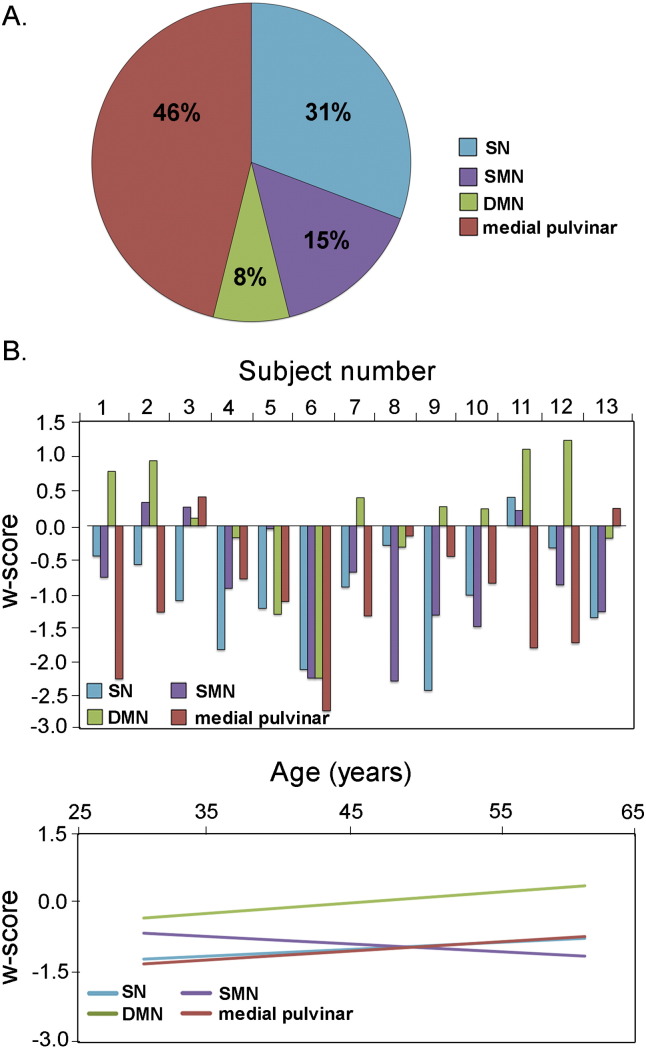
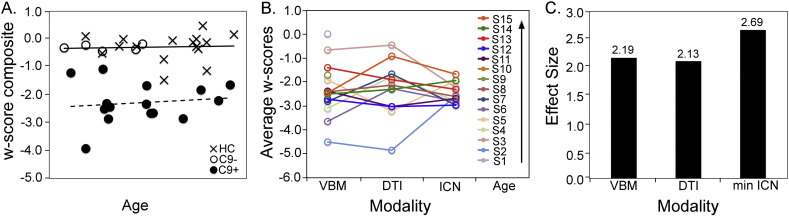
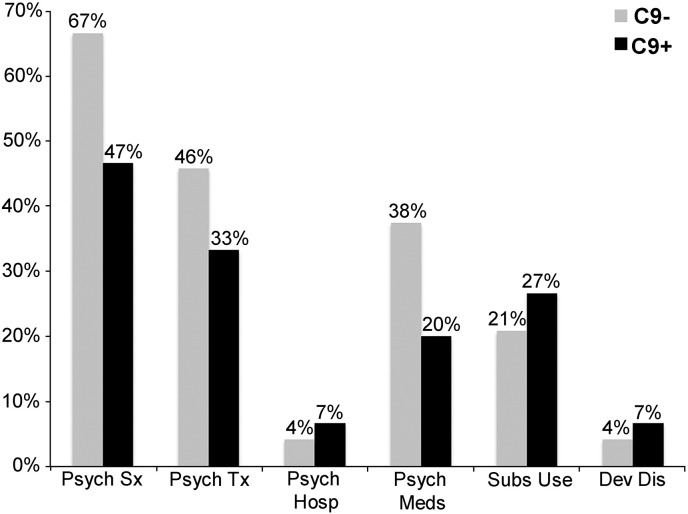
Hexanucleotide repeat expansions in C9ORF72 are the most common known genetic cause of familial and sporadic frontotemporal dementia and amyotrophic lateral sclerosis. Previous work has shown that patients with behavioral variant frontotemporal dementia due to C9ORF72 show salience and sensorimotor network disruptions comparable to those seen in sporadic behavioral variant frontotemporal dementia, but it remains unknown how early in the lifespan these and other changes in brain structure and function arise. To gain insights into this question, we compared 15 presymptomatic carriers (age 43.7 ± 10.2 years, nine females) to matched healthy controls. We used voxel-based morphometry to assess gray matter, diffusion tensor imaging to interrogate white matter tracts, and task-free functional MRI to probe the salience, sensorimotor, default mode, and medial pulvinar thalamus-seeded networks. We further used a retrospective chart review to ascertain psychiatric histories in carriers and their non-carrier family members. Carriers showed normal cognition and behavior despite gray matter volume and brain connectivity deficits that were apparent as early as the fourth decade of life. Gray matter volume deficits were topographically similar though less severe than those in patients with behavioral variant frontotemporal dementia due to C9ORF72, with major foci in cingulate, insula, thalamus, and striatum. Reduced white matter integrity was found in the corpus callosum, cingulum bundles, corticospinal tracts, uncinate fasciculi and inferior longitudinal fasciculi. Intrinsic connectivity deficits were detected in all four networks but most prominent in salience and medial pulvinar thalamus-seeded networks. Carrier and control groups showed comparable relationships between imaging metrics and age, suggesting that deficits emerge during early adulthood. Carriers and non-carrier family members had comparable lifetime histories of psychiatric symptoms. Taken together, the findings suggest that presymptomatic C9ORF72 expansion carriers exhibit functionally compensated brain volume and connectivity deficits that are similar, though less severe, to those reported during the symptomatic phase. The early adulthood emergence of these deficits suggests that they represent aberrant network patterning during development, an early neurodegeneration prodrome, or both.

Keywords: ALS, amyotrophic lateral sclerosis; Amyotrophic lateral sclerosis; CDR, Clinical Dementia Rating scale; DMN, default mode network; Diffusion tensor imaging; FA, fractional anisotropy; FTD, frontotemporal dementia; FWE, familywise error; Frontotemporal dementia; Functional MRI; Genetics; HC, healthy control; ICN, intrinsic connectivity network; IRI, Interpersonal Reactivity Index; MMSE, Mini-Mental State Exam; MND, motor neuron disease; NPI, Neuropsychiatric Inventory; ROI, region of interest; SMN, sensorimotor network; TIV, total intracranial volume; VBM, voxel-based morphometry; bvFTD, behavioral variant frontotemporal dementia; fMRI, functional MRI; preSxC9, presymptomatic C9ORF72 expansion carriers.


Figures

Fig. 1
Fig. 1
Gray matter reductions in preSxC9. (A) Group difference maps derived using VBM illustrate reduced gray matter in 15 preSxC9 expansion carriers compared with 67 healthy controls (HC2) involving bilateral posterior midcingulate cortex, left medial pulvinar nucleus of the thalamus, and regions in bilateral dorsolateral prefrontal cortex at pFWE < 0.05 (dark blue). More extensive gray matter reductions in bilateral medial frontal cortex, dorsolateral prefrontal cortex, insula, precuneus and medial thalamus emerge at p < 0.001 uncorrected (cyan). Color bars represent t-scores, and statistical maps are superimposed on the Montreal Neurological Institute template brain. The left side of the axial and coronal images corresponds to the left side of the brain. (B) Mean gray matter intensity versus age within the pFWE < 0.05 map in (A), for 15 preSxC9 (blue dots), C9– (black dots), and HC (black circles) plotted for visualization purposes only. In general, preSxC9 showed lower gray matter intensities within the pFWE < 0.05 map in (A) compared with controls over three decades. Age axis labels are omitted to preserve subject anonymity. C9 + = presymptomatic C9ORF72 expansion carriers; C9– = non-carrier family members; HC = non-family healthy controls. C9– and HC were combined to comprise HC2.
Fig. 2
Fig. 2
Reduced white matter integrity in preSxC9. (A) Group difference FA maps show reduced fractional anisotropy in 12 preSxC9 compared with 29 healthy controls (HC3) including left greater than right cingulum bundle and corpus callosum and bilateral internal capsule at p < 0.05 corrected (blue-green). Color bars represent p values, and statistical maps are superimposed on the FMRIB58FA template. The left side of the axial and coronal images corresponds to the left side of the brain. (B) Mean FA versus age within the map in (A), for 12 preSxC9 (blue dots), C9– (black dots), and HC (black circles) plotted for visualization purposes only. PreSxC9 showed lower FA within the map in (A) compared with controls over three decades. Age axis labels are omitted to preserve subject anonymity. C9 + = presymptomatic C9ORF72 expansion carriers; C9– = non-carrier family members; HC = non-family healthy controls. C9– and HC were combined to comprise HC3.
Fig. 3
Fig. 3
ICN reductions in preSxC9. Group difference maps show reduced intrinsic connectivity in 13 preSxC9 compared with 30 healthy controls (HC3) for all four networks studied: (A) salience network; (B) SMN; (C) DMN; and (D) medial pulvinar. Note the topographic similarity of connectivity reductions in the salience network (A) and medial pulvinar network (D). Analyses were thresholded using joint probability distribution thresholding with a joint height and extent threshold of p < 0.05 corrected at the whole-brain level. Color bars represent t-scores, and statistical maps are on the Montreal Neurological Institute template brain. The left side of the axial and coronal images corresponds to the left side of the brain. Mean ICN parameter estimate versus age within the maps at left are plotted for 13 preSxC9 (blue dots), C9– (black dots), and HC (black circles). All four plots suggest ICN reductions throughout the age span studied. Age axis labels are omitted to preserve subject anonymity. C9 + = presymptomatic C9ORF72 expansion carriers; C9– = non-carrier family members (black dots); HC = non-family healthy controls. C9– and HC were combined to comprise HC3.
Fig. 4
Fig. 4
Salience and medial pulvinar connectivity disruptions predominate in preSxC9. In (A), the pie chart shows the percentage of preSxC9 participants in whom the salience network (blue), SMN (purple), DMN (green), or medial pulvinar connectivity (red) was the ICN with the lowest connectivity w-score among the four ICNs. (B) w-scores of mean connectivity reveal that 13 preSxC9 show heterogeneous ICN reduction profiles, with salience and medial pulvinar networks showing most disruption across the age span. Subjects are ordered by ascending age. (C) Fit-lines of the w-scores in B show that salience and medial pulvinar connectivity are the lowest throughout the presymptomatic phase.
Fig. 5
Fig. 5
Multimodal imaging composite scores separate preSxC9 from controls and show structural and functional connectivity disruption as early as the third decade. (A) The plot shows a w-score composite (the average of gray matter intensity, fractional anisotropy and lowest ICN w-scores for each subject) plotted versus age. The C9 + fit line appears horizontal, thus suggesting a consistently reduced w-score composite across the entire age range. (B) Individual C9 + subject w-scores from VBM, DTI, and ICN analyses for the most reduced ICN for each subject in order of ascending age. (C) Effect size (Cohen's d) for detecting differences between C9 + and controls for VBM, DTI, and most reduced (weakest) ICN. C9 + = presymptomatic C9ORF72 expansion carriers (black dots); C9– = non-carrier family members (black circles); HC = healthy controls included in all three imaging modalities (indicated by “x”). Axis labels for age were omitted to preserve anonymity.
Fig. 6
Fig. 6
Psychiatric histories in preSxC9 and C9ORF72 family members negative for the expansion. No statistically significant differences emerged in preSxC9 (C9 +, black bars, N = 15) versus their expansion-negative family members (C9 −, gray bars, N = 24) for psychiatric symptoms (Psych Sx), psychiatric or psychological treatment (Psych Tx), psychiatric medications (Psych Meds), psychiatric hospitalizations (Psych Hosp), prolonged substance use or abuse (Subs Use), or childhood neurological developmental disorders (Dev Dis).

References

    1. Beckmann C.F., DeLuca M., Devlin J.T., Smith S.M. Investigations into resting-state connectivity using independent component analysis. Philos. Trans. R. Soc. Lond. Ser. B Biol. Sci. 2005;360:1001–1013. - PMC - PubMed
    1. Bede P., Bokde A.L.W., Byrne S., Elamin M., McLaughlin R.L., Kenna K., Fagan A.J., Pender N., Bradley D.G., Hardiman O. Multiparametric MRI study of ALS stratified for the C9orf72 genotype. Neurology. 2013;81:361–369. - PMC - PubMed
    1. Benarroch E.E. Pulvinar: associative role in cortical function and clinical correlations. Neurology. 2015;84:738–747. - PubMed
    1. Boeve B.F., Boylan K.B., Graff-Radford N.R., DeJesus-Hernandez M., Knopman D.S., Pedraza O., Vemuri P., Jones D., Lowe V., Murray M.E., Dickson D.W., Josephs K.A., Rush B.K., Machulda M.M., Fields J.A., Ferman T.J., Baker M., Rutherford N.J., Adamson J., Wszolek Z.K., Adeli A., Savica R., Boot B., Kuntz K.M., Gavrilova R., Reeves A., Whitwell J., Kantarci K., Jack C.R., Parisi J.E., Lucas J.A., Petersen R.C., Rademakers R. Characterization of frontotemporal dementia and/or amyotrophic lateral sclerosis associated with the GGGGCC repeat expansion in C9ORF72. Brain. 2012;135:765–783. - PMC - PubMed
    1. Bora E., Fornito A., Yücel M., Pantelis C. Vol. 67. BPS; 2010. Voxelwise Meta-Analysis of Gray Matter Abnormalities in Bipolar Disorder; pp. 1097–1105. - PubMed

Publication types

MeSH terms