. 2017 Mar 8:5:34.
doi: 10.3389/fped.2017.00034. eCollection 2017.

Investigating Cardiac Motion Patterns Using Synthetic High-Resolution 3D Cardiovascular Magnetic Resonance Images and Statistical Shape Analysis

Affiliations

Investigating Cardiac Motion Patterns Using Synthetic High-Resolution 3D Cardiovascular Magnetic Resonance Images and Statistical Shape Analysis

Benedetta Biffi et al. Front Pediatr. .

Abstract

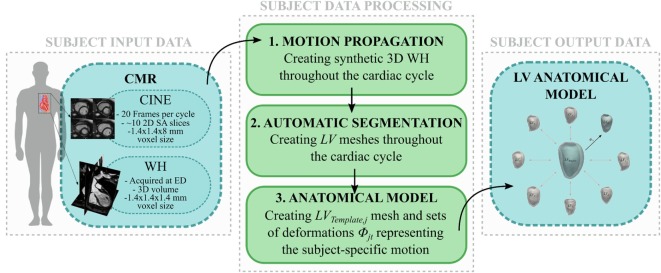
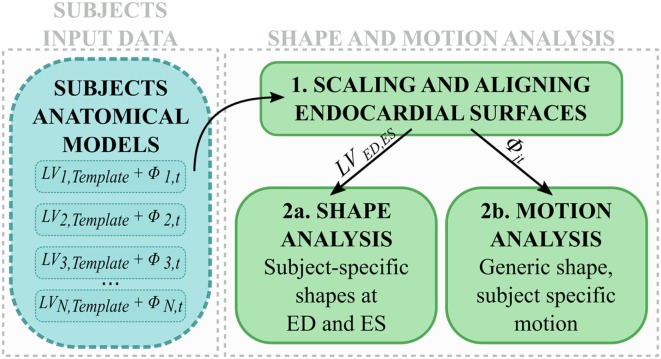
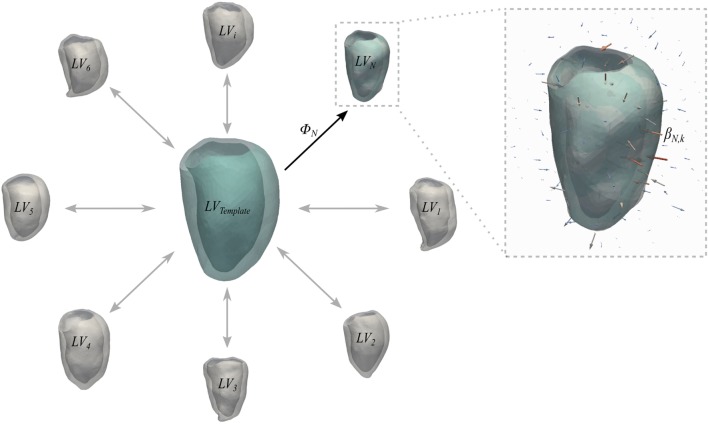
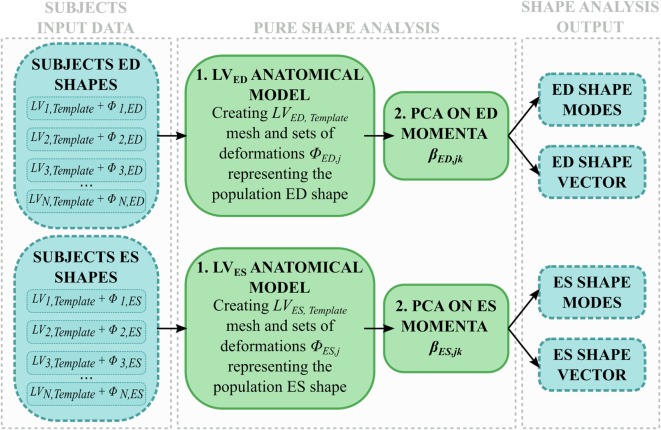
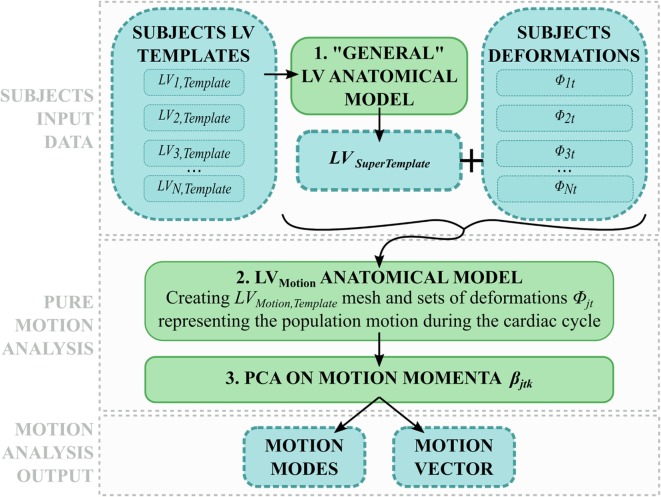
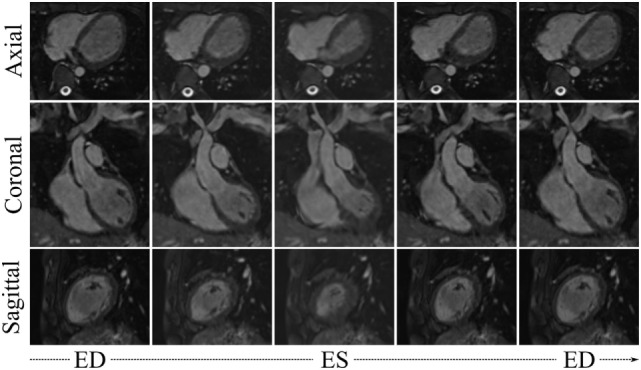
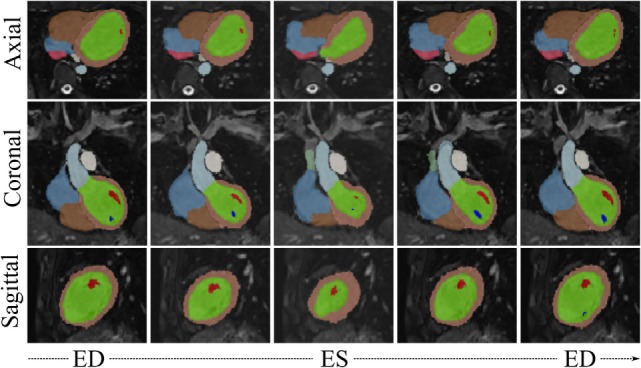
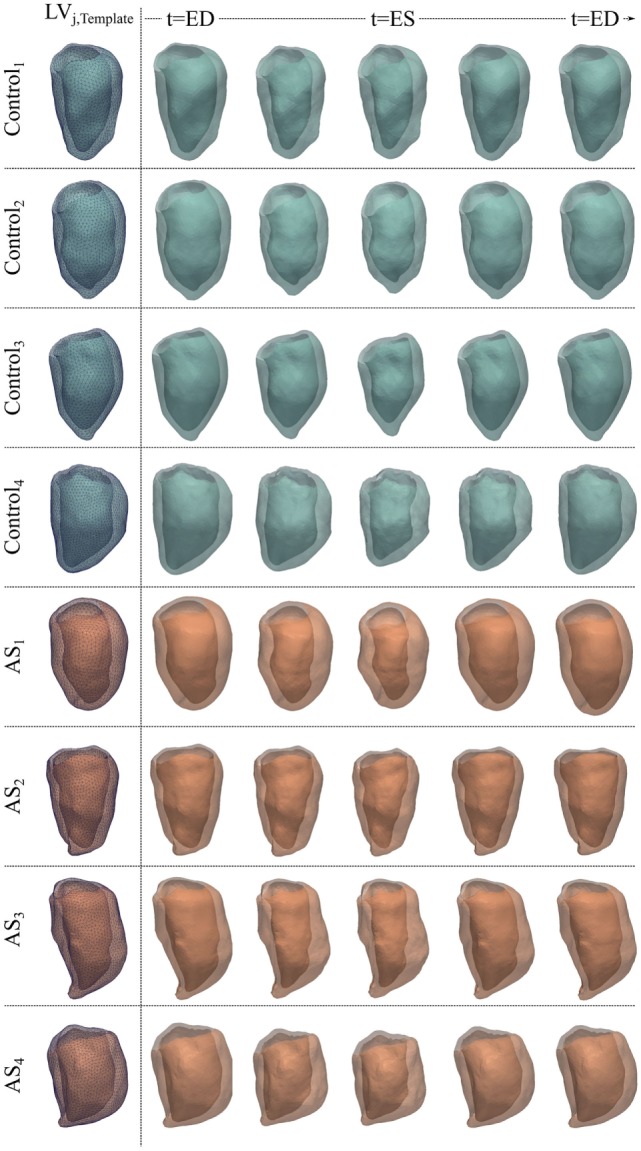
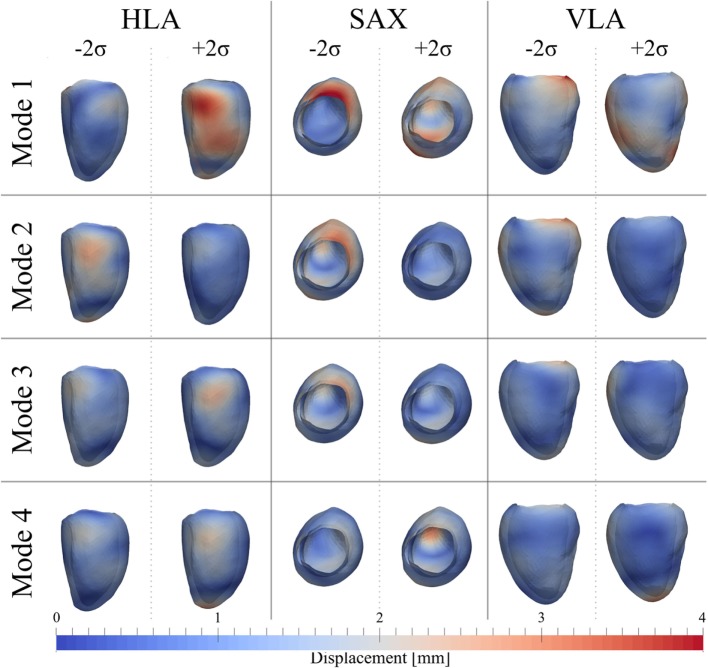
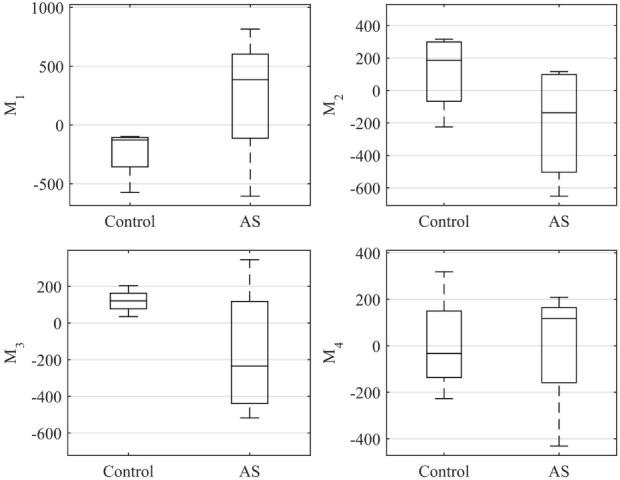
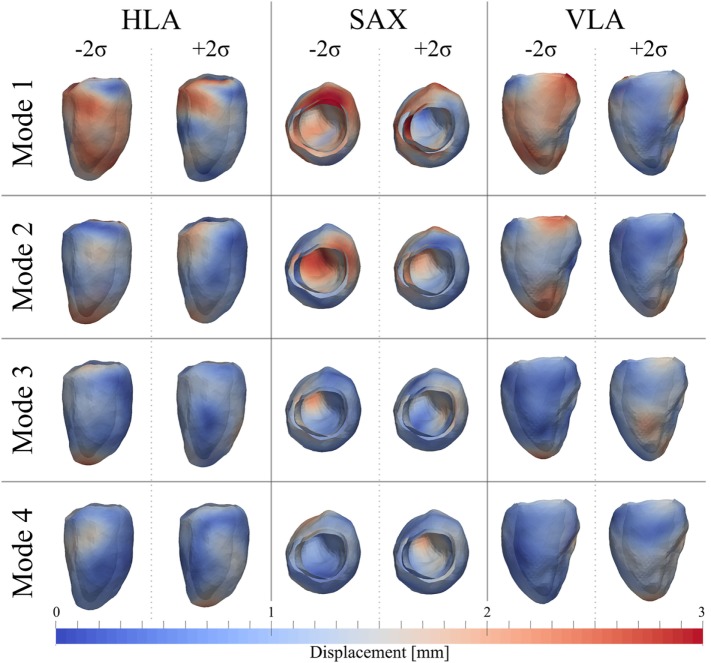
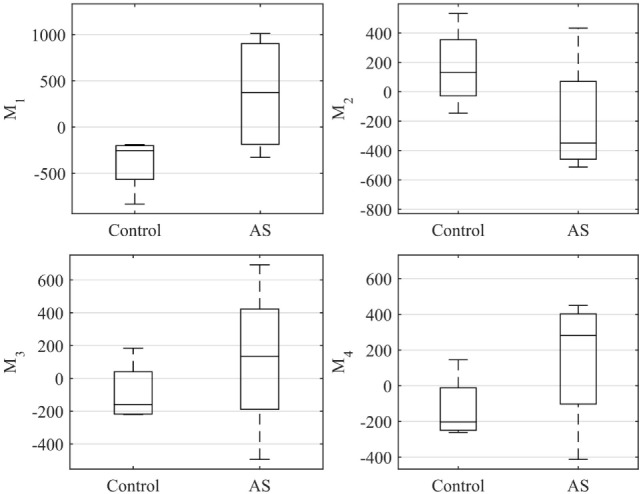
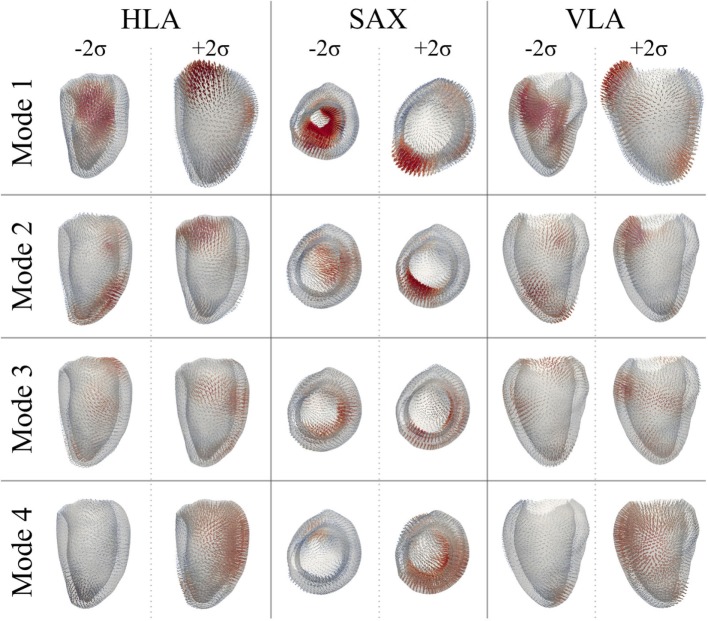
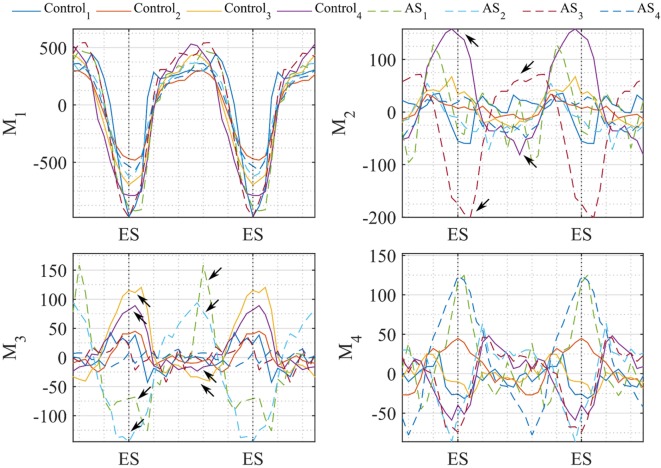
Diagnosis of ventricular dysfunction in congenital heart disease is more and more based on medical imaging, which allows investigation of abnormal cardiac morphology and correlated abnormal function. Although analysis of 2D images represents the clinical standard, novel tools performing automatic processing of 3D images are becoming available, providing more detailed and comprehensive information than simple 2D morphometry. Among these, statistical shape analysis (SSA) allows a consistent and quantitative description of a population of complex shapes, as a way to detect novel biomarkers, ultimately improving diagnosis and pathology understanding. The aim of this study is to describe the implementation of a SSA method for the investigation of 3D left ventricular shape and motion patterns and to test it on a small sample of 4 congenital repaired aortic stenosis patients and 4 age-matched healthy volunteers to demonstrate its potential. The advantage of this method is the capability of analyzing subject-specific motion patterns separately from the individual morphology, visually and quantitatively, as a way to identify functional abnormalities related to both dynamics and shape. Specifically, we combined 3D, high-resolution whole heart data with 2D, temporal information provided by cine cardiovascular magnetic resonance images, and we used an SSA approach to analyze 3D motion per se. Preliminary results of this pilot study showed that using this method, some differences in end-diastolic and end-systolic ventricular shapes could be captured, but it was not possible to clearly separate the two cohorts based on shape information alone. However, further analyses on ventricular motion allowed to qualitatively identify differences between the two populations. Moreover, by describing shape and motion with a small number of principal components, this method offers a fully automated process to obtain visually intuitive and numerical information on cardiac shape and motion, which could be, once validated on a larger sample size, easily integrated into the clinical workflow. To conclude, in this preliminary work, we have implemented state-of-the-art automatic segmentation and SSA methods, and we have shown how they could improve our understanding of ventricular kinetics by visually and potentially quantitatively highlighting aspects that are usually not picked up by traditional approaches.

Keywords: automatic segmentation; cardiac magnetic resonance; congenital heart disease; statistical shape analysis; ventricular mechanics.


Figures

Figure 1
Figure 1
Image-processing pipeline to generate each subject LV anatomical model starting from cine and WH CMR images: (1) Synthetic WH images were created by combining WH with the cine images (2) and segmented with our automatic segmentation method; (3) LV meshes were exported and used to create the subject LV anatomical model.
Figure 2
Figure 2
After scaling and alignment (1), subject anatomical models were used to perform (2a) shape analysis on end-diastolic and end-systolic shapes, and (2b) motion analysis after subject-specific shape was removed.
Figure 3
Figure 3
Schematic representation of the concept of anatomical model. Template and deformations ϕi toward each shape are estimated with an alternate registration algorithm. The template is initialized as the mean shape and the deformations ϕi are estimated using a Large Deformation Diffeomorphic Mappings framework (23, 24). Each deformation ϕi is defined by a set of momenta vectors βik (arrows in the magnified panel) located at the control points grid.
Figure 4
Figure 4
Shape analysis pipeline: for each subject, only ED and ES shapes are used to (1) build an anatomical model representing the LVED, LVES shape variability within the population; (2) the momenta vectors are decomposed with a PCA and the resulting shape modes and shape vector are analyzed.
Figure 5
Figure 5
Motion analysis pipeline: (1) each subject LVj,Template is used to compute a general LV shape called LVSuperTemplate. (2) The latter is deformed with each subject-specific deformation, and all the obtained shapes are used to build a motion anatomical model (2). The resulting momenta vectors are decomposed with PCA (3), generating motion modes and motion vector describing each subject motion within the cardiac cycle.
Figure 6
Figure 6
WHSyn,jt from 5 evenly spaced frames of the cardiac cycle of the subject j = Control2, obtained by propagating the subject’s motion from the cine dataset onto the high-resolution WH image.
Figure 7
Figure 7
WHSyn,jt with overlaid automatic segmentation from 5 evenly spaced frames of the cardiac cycle of the subject j = Control2. Color code for main segmented structures: lemon-green, LV blood pool; orange, LV myocardium; red and dark blue, papillary muscles; light blue, aorta; brown, right ventricle; azure, right atrium; green, superior vena cava; pink, inferior vena cava; white, pulmonary trunk.
Figure 8
Figure 8
LVjt meshes for the 4 control and 4 AS subjects obtained by deforming subject-specific LVj,Template (first column) with the deformations estimated during the anatomical model computation, to reproduce 5 evenly spaced frames of the cardiac cycle illustrated in Figures 6 and 7 for each subject.
Figure 9
Figure 9
Extreme features (±2σ) of each of the first 4 modes of the shape analysis on LV shapes at ED are shown in the canonical cardiac views (horizontal long axis (HLA), SAX, and vertical long axis (VLA)). Each depicted shape was obtained by morphing the template shape with the extreme deformation represented by each mode. Colormap represents the distribution of regional deformations within each mode, obtained by deforming the ED template shape along the mode (red, high deformation; blue, low deformation).
Figure 10
Figure 10
Boxplot showing the variability of the coefficients of the shape vector of LVED shape analysis for the first 4 modes. Single values are reported in Table 2. On each box, the central mark is the median, the edges of the box are the 25th and 75th percentiles, the whiskers extend to the most extreme data points not considered outliers.
Figure 11
Figure 11
Extreme features (±2σ) of each of the first 4 modes of the shape analysis on LV shapes at ES are shown in the canonical cardiac views (HLA, SAX, and VLA). Each depicted shape was obtained by morphing the template shape with the extreme deformation represented by each mode. Colormap represents the distribution of regional deformations within each mode, obtained by deforming the ES template shape along the mode (red, high deformation; blue, low deformation).
Figure 12
Figure 12
Boxplot showing the variability of the coefficients of the shape vector of LVES shape analysis for the first 4 modes. Single values are reported in Table 3. On each box, the central mark is the median, the edges of the box are the 25th and 75th percentiles, the whiskers extend to the most extreme data points not considered outliers.
Figure 13
Figure 13
Extreme motion patterns (±2σ) represented by each mode of the motion analysis on LV shapes are shown in the canonical cardiac views (HLA, SAX, and VLA). Each depicted shape was obtained by morphing the LVSuperTemplate shape with the extreme deformation represented by each mode. Arrows represents the direction and magnitude of the movement from the template (red color highlights the regions of highest motion).
Figure 14
Figure 14
Coefficients of the motion vector plotted against time (2 cardiac cycles are herein represented). Each line represents one subject, i.e., Control subjects are plotted in continuous line and AS in dashed line. Temporal variation of the coefficients resulting from our motion analysis is plotted for the first 4 modes. Arrows highlight the values where coefficients differ mostly between control-AS subjects comparison.

References

    1. Vieira MS, Hussain T, Figueroa CA. Patient-specific image-based computational modeling in congenital heart disease: a clinician perspective. J Cardiol Ther (2015) 2(6):436–48.10.17554/j.issn.2309-6861.2015.02.96 - DOI
    1. Dragulescu A, Mertens L, Friedberg MK. Interpretation of left ventricular diastolic dysfunction in children with cardiomyopathy by echocardiography problems and limitations. Circulation (2013) 6(2):254–61.10.1161/CIRCIMAGING.112.000175 - DOI - PubMed
    1. Singh GK, Holland MR. Diastolic dysfunction in pediatric cardiac patients: evaluation and management. Curr Treat Options Cardiovasc Med (2010) 12(5):503–17.10.1007/s11936-010-0086-5 - DOI - PubMed
    1. Zile MR, Brutsaert DL. New concepts in diastolic dysfunction and diastolic heart failure: part I diagnosis, prognosis, and measurements of diastolic function. Circulation (2002) 105(11):1387–93.10.1161/hc1102.105289 - DOI - PubMed
    1. Kass DA. Assessment of diastolic dysfunction: invasive modalities. Cardiol Clin (2000) 18(3):571–86.10.1016/s0733-8651(05)70162-4 - DOI - PubMed