

Comparison of diagnostic performance of four software packages for phase dyssynchrony analysis in gated myocardial perfusion SPECT
- PMID: 28337725
- PMCID: PMC5364119
- DOI: 10.1186/s13550-017-0274-3
Comparison of diagnostic performance of four software packages for phase dyssynchrony analysis in gated myocardial perfusion SPECT
Abstract
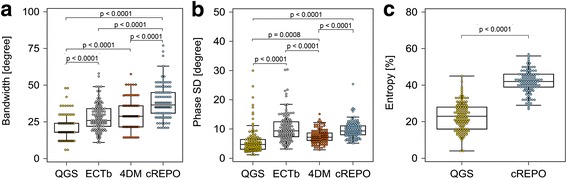
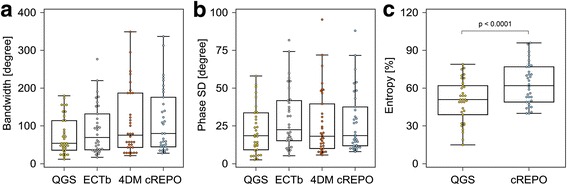
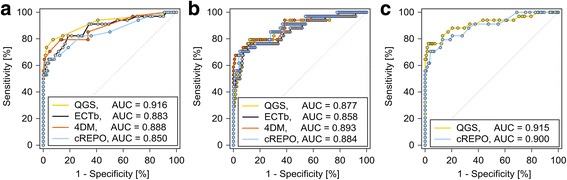
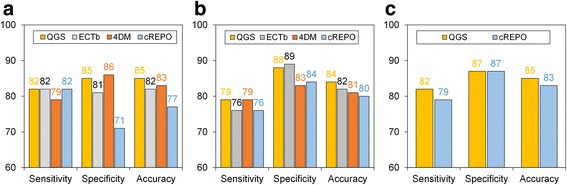
Background: Phase analysis of gated myocardial perfusion single-photon emission computed tomography (SPECT) for assessment of left ventricular (LV) dyssynchrony was investigated using the following dedicated software packages: Corridor4DM (4DM), cardioREPO (cREPO), Emory Cardiac Toolbox (ECTb), and quantitative gated SPECT (QGS). The purpose of this study was to evaluate the normal values of 95% histogram bandwidth, phase standard deviation (SD), and entropy and to compare the diagnostic performance of the four software packages. A total of 122 patients with normal myocardial perfusion and cardiac function (58.9 ± 12.3 years, 60 women, ejection fraction (EF) 74.3 ± 5.7%, and end-diastolic volume (EDV) 83.5 ± 3.6 mL) and 34 patients with suspected LV dyssynchrony (64.1 ± 12.2 years, 9 women, EF 52.0 ± 18.0%, and EDV 145.0 ± 6.8 mL) who underwent Tc-99m methoxy-isobutyl-isonitrile/tetrofosmin gated SPECT were retrospectively evaluated. Dyssynchrony indices of the 95% histogram bandwidth, phase SD, and entropy were computed with the four software programs. Diagnostic performance of LV phase dyssynchrony assessments was determined by receiver operator characteristic (ROC) analysis. The area under the ROC curve (AUC) was used to compare the software programs. The optimal cutoff point was determined by ROC curve based on the Youden index.
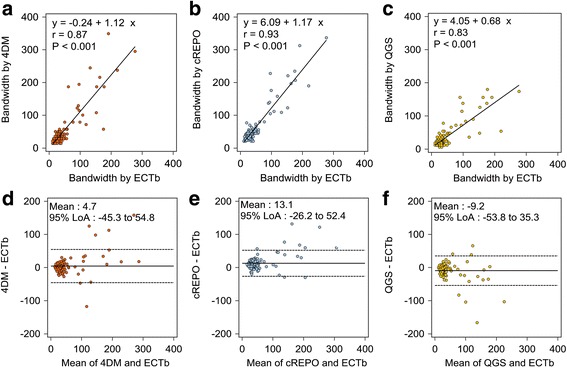
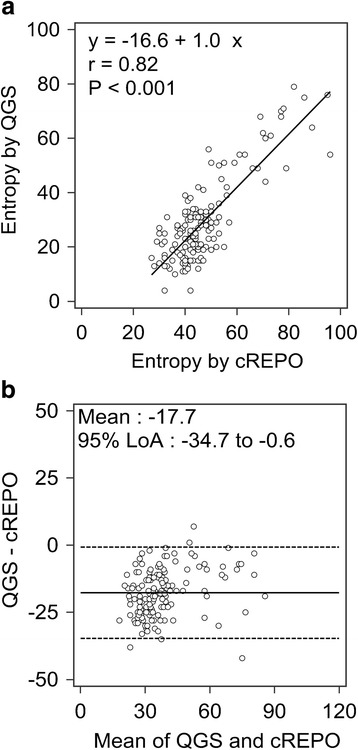
Results: The average of normal bandwidth significantly differed among the four software programs except in the comparison of 4DM and ECTb. Moreover, the normal phase SD significantly differed among the four software programs except in the comparison of cREPO and ECTb. The software programs showed high correlation levels for bandwidth, phase SD, and entropy (r ≥ 0.73, p < 0.001). ROC AUCs of bandwidth, phase SD, and entropy were ≥0.850, ≥0.858, and ≥0.900, respectively. Moreover, the ROC AUCs of bandwidth, phase SD, and entropy did not significantly differ among the four software programs. Optimal cutoff points for phase parameters were 24°-42° for bandwidth, 8.6°-15.3° for phase SD, and 31-48% for entropy.
Conclusions: Although the optimal cutoff value for determining LV phase dyssynchrony by ROC analysis varied depending on the use of the different software programs, all software programs can be used reliably for phase dyssynchrony analysis.
Keywords: Cardiac resynchronization therapy; Left ventricular; Mechanical dyssynchrony; Myocardial perfusion SPECT; Phase analysis.
Figures

References
-
- Hunt SA, Abraham WT, Chin MH, Feldman AM, Francis GS, Ganiats TG, et al. 2009 Focused update incorporated into the ACC/AHA 2005 Guidelines for the Diagnosis and Management of Heart Failure in Adults: a report of the American College of Cardiology Foundation/American Heart Association Task Force on Practice Guidelines developed in collaboration with the International Society for Heart and Lung Transplantation. J Am Coll Cardiol. 2009;53:e1–e90. doi: 10.1016/j.jacc.2008.11.013. - DOI - PubMed
-
- Yu CM, Fung WH, Lin H, Zhang Q, Sanderson JE, Lau CP. Predictors of left ventricular reverse remodeling after cardiac resynchronization therapy for heart failure secondary to idiopathic dilated or ischemic cardiomyopathy. Am J Cardiol. 2003;91:684–8. doi: 10.1016/S0002-9149(02)03404-5. - DOI - PubMed
-
- Westenberg JJ, Lamb HJ, van der Geest RJ, Bleeker GB, Holman ER, Schalij MJ, et al. Assessment of left ventricular dyssynchrony in patients with conduction delay and idiopathic dilated cardiomyopathy: head-to-head comparison between tissue doppler imaging and velocity-encoded magnetic resonance imaging. J Am Coll Cardiol. 2006;47:2042–8. doi: 10.1016/j.jacc.2006.01.058. - DOI - PubMed
LinkOut - more resources
Full Text Sources
Other Literature Sources
