. 2017 Apr;27(4):505-525.
doi: 10.1038/cr.2017.42. Epub 2017 Mar 24.

Lipid-dependent conformational dynamics underlie the functional versatility of T-cell receptor

Affiliations

Lipid-dependent conformational dynamics underlie the functional versatility of T-cell receptor

Xingdong Guo et al. Cell Res. 2017 Apr.

Abstract

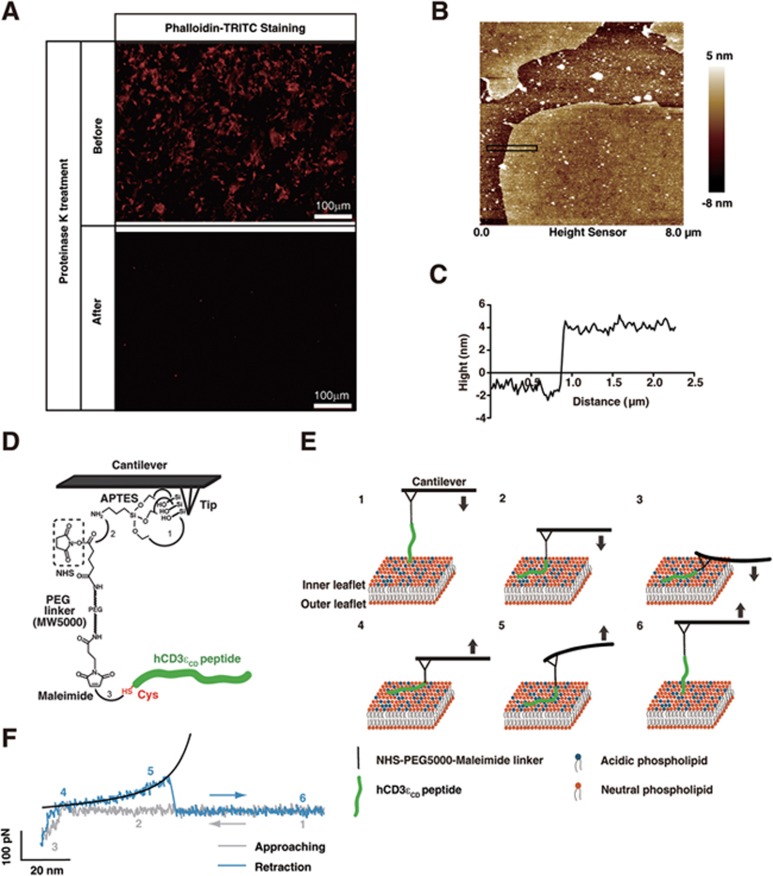
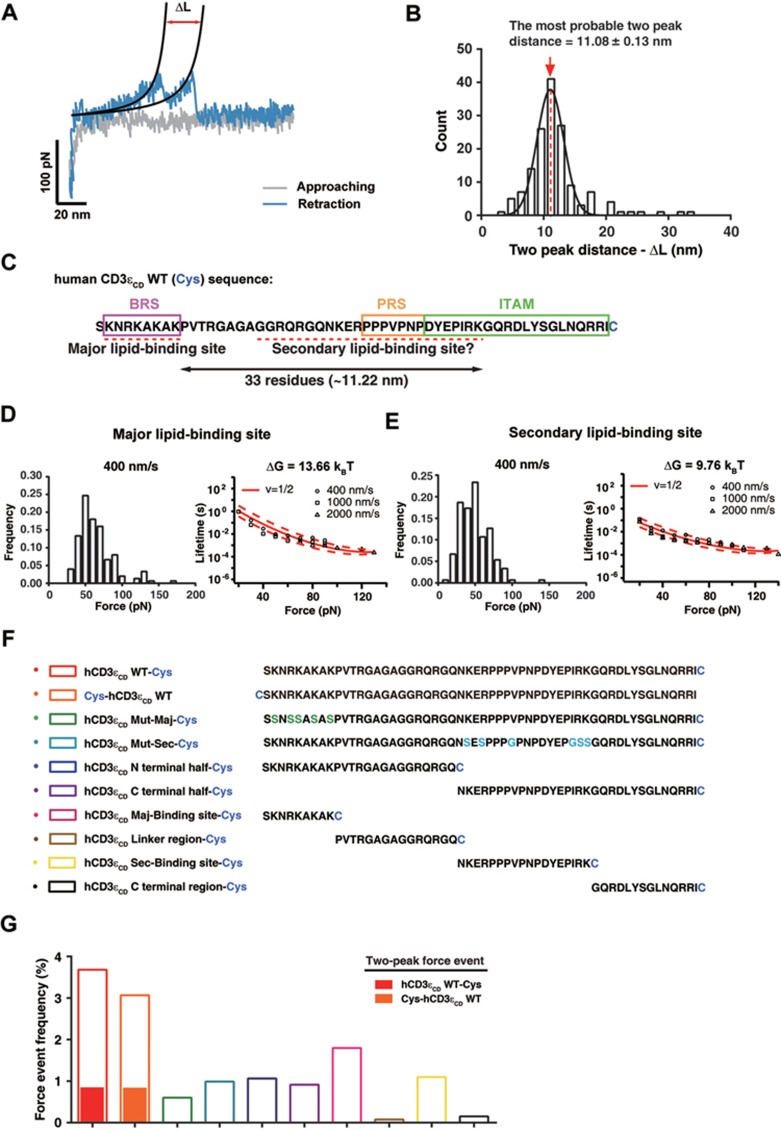
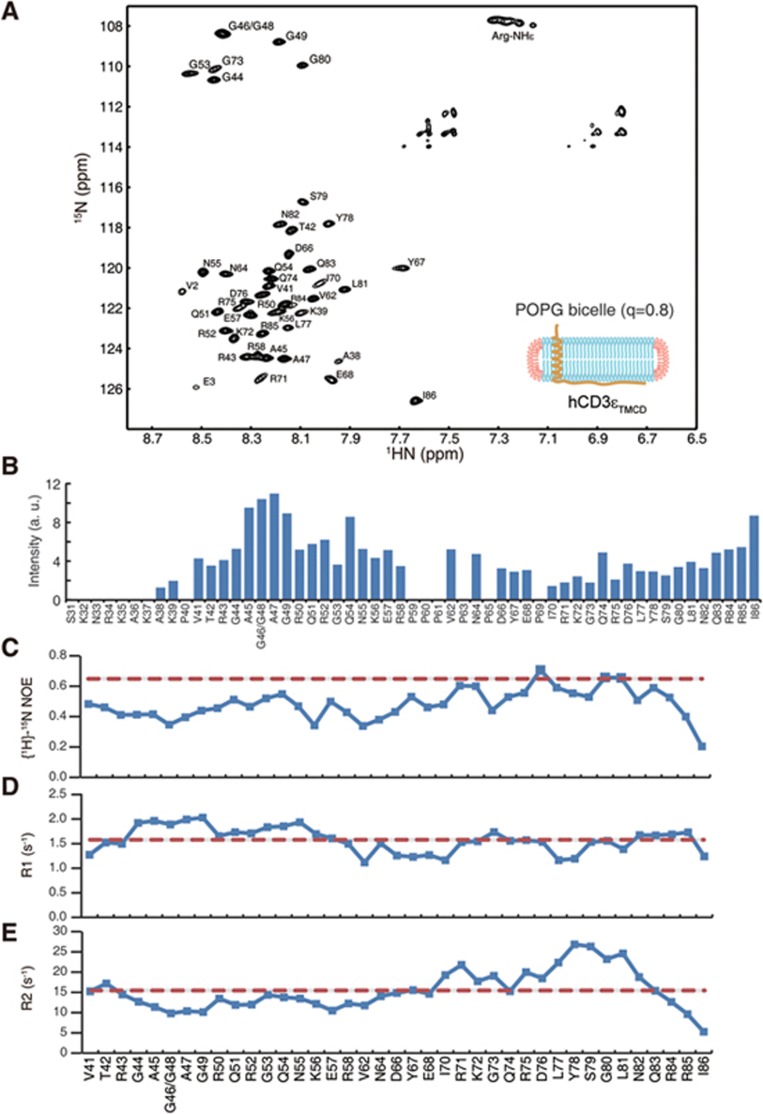
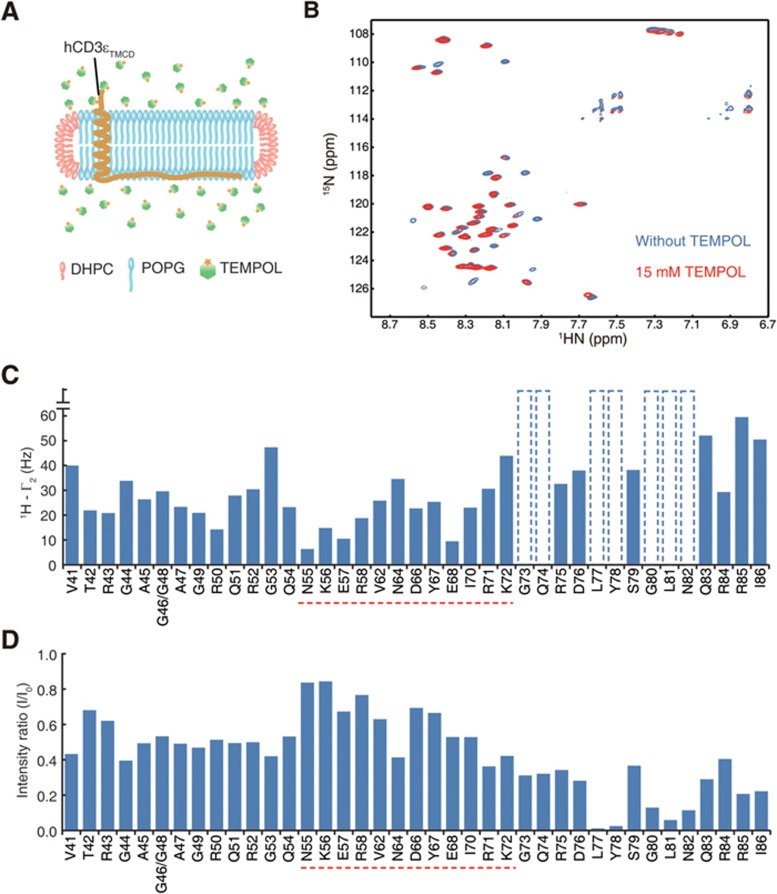
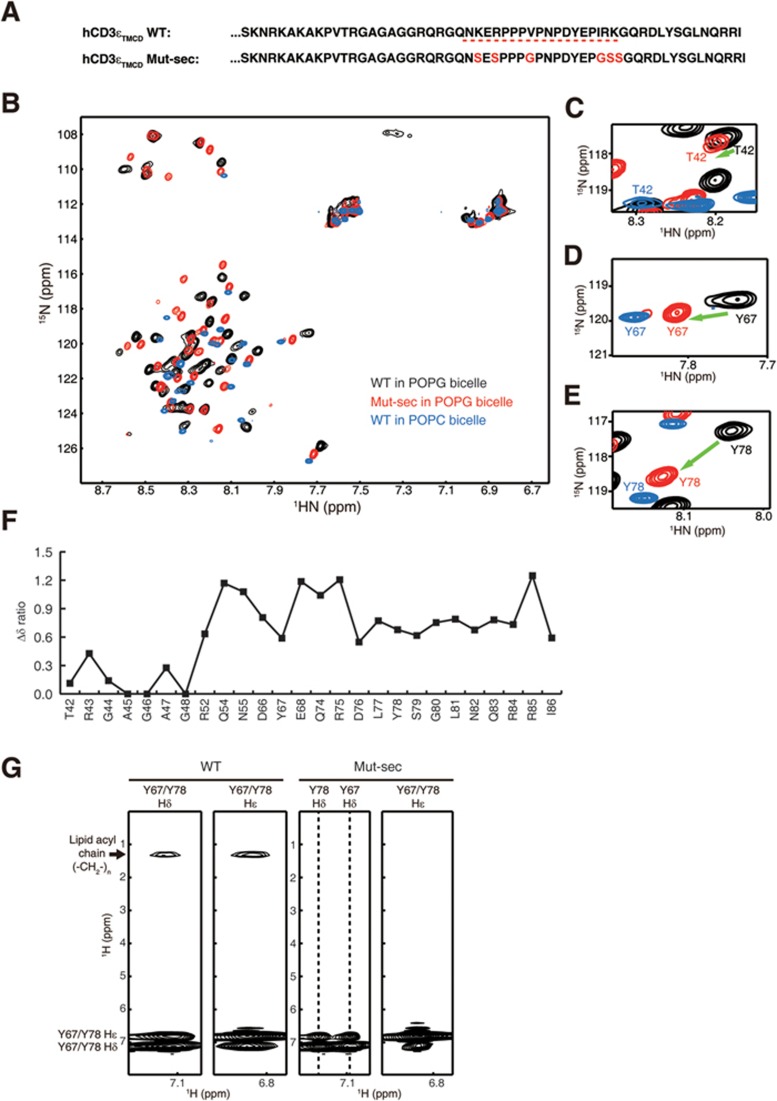
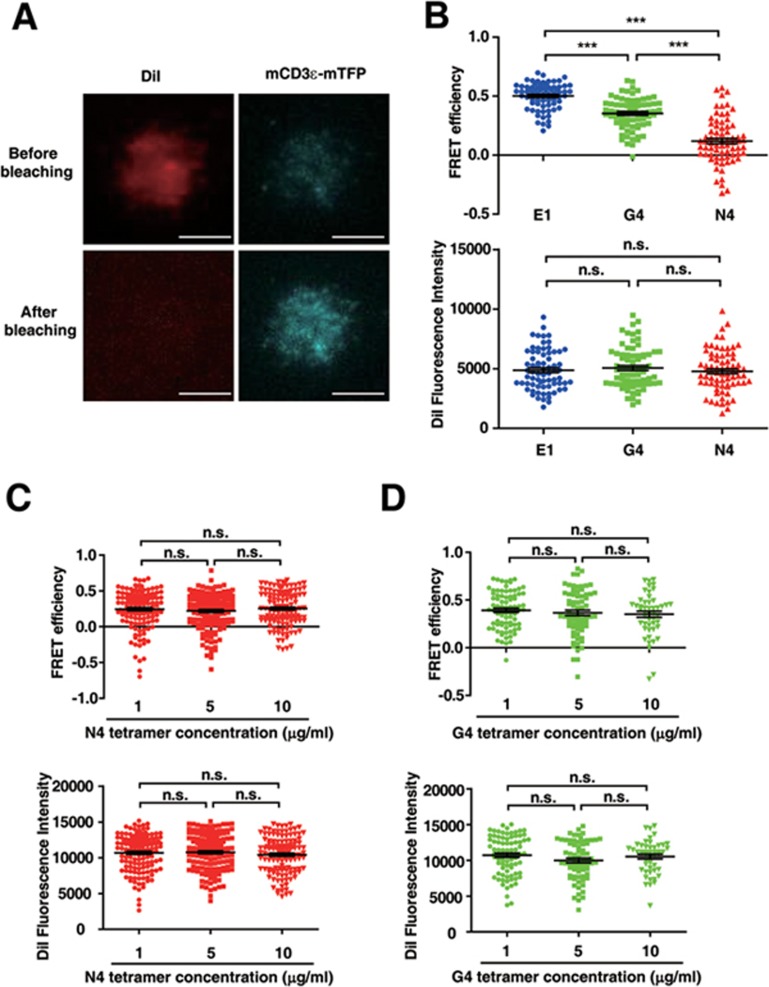
T-cell receptor-CD3 complex (TCR) is a versatile signaling machine that can initiate antigen-specific immune responses based on various biochemical changes of CD3 cytoplasmic domains, but the underlying structural basis remains elusive. Here we developed biophysical approaches to study the conformational dynamics of CD3ε cytoplasmic domain (CD3εCD). At the single-molecule level, we found that CD3εCD could have multiple conformational states with different openness of three functional motifs, i.e., ITAM, BRS and PRS. These conformations were generated because different regions of CD3εCD had heterogeneous lipid-binding properties and therefore had heterogeneous dynamics. Live-cell imaging experiments demonstrated that different antigen stimulations could stabilize CD3εCD at different conformations. Lipid-dependent conformational dynamics thus provide structural basis for the versatile signaling property of TCR.


Figures

Figure 1
Figure 1
An AFM system to detect the closed-to-open conformational transition of the CD3ε cytoplasmic domain. (A) Actin staining by phalloidin-TRITC showed that there were nearly no actins left on the membrane surface, strongly suggesting that the prepared PMS had fully exposed lipid surface. Upper panel was a representative image of 14 images before Proteinase K treatment, and lower panel was a representative image of 8 images after Proteinase K treatment in one experiment. (B, C) AFM scan showed that the height of the PMS was ∼6 nm that is the physiological height of native lipid bilayer. It was a representative image of 6 images in one experiment, and this experiment was repeated for three times. (D) AFM tip surface was firstly amino-functionalized by APTES, and then modified by a bi-functionalized PEG linker (molecular weight: 5 000) through an NH2-NHS reaction. The hCD3εCD peptide was then conjugated to the PEG linker through a thiol-maleimide reaction. The additional cysteine added to the terminus of hCD3εCD was labeled in red. (E) A schematic illustration showing the measurement of the closed-to-open conformational transition of hCD3εCD by AFM. First, the cantilever was set at the up position and both the hCD3εCD peptide and the tip were apart from the plasma membrane sheet (PMS). Second, the cantilever was approached toward the PMS to allow the peptide to contact with the PMS. Third, the cantilever was further approached toward the PMS and the tip became in contact with the PMS, which caused a certain degree of cantilever deflection. Fourth, the cantilever was retracted from the PMS, which caused the leave of the tip from the PMS and the disappearance of cantilever deflection. Fifth, the cantilever was further retracted and the interaction between the peptide and the PMS caused opposite-directional deflection of the cantilever. Sixth, the cantilever was further retracted and both the tip and the peptide left the PMS. (F) One typical force-distance curve measured by the AFM setup. Approaching and retraction force curves were labeled in gray and blue colors, respectively. The 6 steps mentioned in E were marked at the corresponding positions in the force-distance curve. The retraction force curve was fitted by the WLC model (black curve).
Figure 2
Figure 2
Specific AFM measurements at the single-molecule level. (A) The force event frequencies for hCD3εCD WT-Cys, Cys-hCD3εCD WT, hCD3εCD Mut-Maj-Cys and PEG linker, respectively. The five basic residues in the major lipid-binding site were mutated to Ser in hCD3εCD Mut-Maj to eliminate its ionic interaction with PMS. N.D., no effective data. (B) Scatter dot plot of the force values obtained for hCD3εCD WT-Cys (n = 707), Cys-hCD3εCD WT (n = 209), hCD3εCD Mut-Maj-Cys (n = 191) and PEG linker (n = 0), respectively. Error bars represented mean ± SEM. P-values were determined by the two-tailed Mann-Whitney test. n.s., not significant; ***P < 0.001. N.D., no effective data. (C) The contour length distribution obtained by fitting force curves of hCD3εCD WT with the WLC model (n = 707). Gaussian function analysis showed the most probable contour length was 43.49 ± 1.43 nm, which accounted for the total length of the hCD3εCD WT peptide before the binding site and the PEG linker. (D) The persistence length distribution obtained by fitting force curves of hCD3εCD WT with the WLC model (n = 707). Gaussian function analysis showed that the most probable persistence length was 0.372 ± 0.002 nm.
Figure 3
Figure 3
Detection of multiple lipid-dependent conformations of the CD3ε cytoplasmic domain. (A-E) Analysis of two-peak events when pulling from the C-terminus of the hCD3εCD WT peptide. (A) Typical force-distance curves with two rupture peaks. The retraction force curves (blue) were fitted by the WLC model (black curve). ΔL, the contour length distance between the two peaks. The retraction force curve represented the conformational transition of the CD3ε cytoplasmic domain from the closed state to the open state. (B) Gaussian function analysis of the distribution of distance (ΔL) between two rupture peaks. The most probable distance was 11.08 ± 0.13 nm (red dashed line). n = 150. (C) The major lipid-binding site of CD3εCD has been found to be the polybasic region at the N-terminus. Based on the ΔL value, the secondary lipid-binding site of CD3εCD was estimated to be around the PRS region. The amino acid sequences of BRS, PRS and ITAM were highlighted by magenta, orange and green boxes, respectively. The two lipid-binding sites were highlighted by red dashed lines. (D, E) The rupture-force histograms for the major lipid-binding site (D) and the secondary lipid-binding site (E) at 400 nm/s pulling speed. Data obtained at other speeds were shown in Supplementary information, Figure S6. The lifetime was calculated according to the Dudko-Hummer-Szabo equation and plotted against the force value. Kramers theory was used to fit the dots to a curve for the calculation of free energy (ΔG) required for the disruption of the lipid binding of each site (detailed in Supplementary information, Data S1). n = 150. Dotted curves represent 95% confidence intervals of the best-fit curves obtained by bootstrapping. (F, G) Analysis of force events of WT, truncated and mutant peptides. Cysteine residue was added to the C-terminus or N-terminus for conjugation to AFM tip. (F) The amino acid sequences of hCD3εCD WT, mutant and truncated peptides used in AFM force spectroscopy. Green and cyan labeled residues represent the mutation sites in hCD3εCDMut-Maj-Cys and hCD3εCD Mut-Sec-Cys peptides, respectively. (G) The force event frequencies for peptides shown in F. Solid bars represent the two-peak force event frequencies.
Figure 4
Figure 4
Dynamic feature of the lipid-bound CD3ε cytoplasmic domain. (A) A high-resolution 1H-15N TROSY spectrum of hCD3εTMCD reconstituted in big POPG bicelle (q = 0.8). (B) Signal intensities of backbone amide resonances of hCD3εTMCD construct. The good signals from residues in the cytoplasmic domain indicated that this region had substantial motion. (C-E) The three 15N spin relaxation parameters, including steady-state heteronuclear {1H}-15N NOEs (C), longitudinal spin relaxation rate R1 (D) and transverse spin relaxation rate R2 (E), were plotted as histograms vs the residue number. The {1H}-15N NOE values showed variations in the range of 0.20-0.71 with an average of 0.48. In general, flexible residues give {1H}-15N NOE values less than 0.65 (the red dash line). R1 values showed relatively little variation (1.12-2.03 s−1), with an average value of 1.58 s−1 (the red dash line). Such a large R1 value usually implied larger internal motions. R2 values were generally small, also indicating fast internal motion. R2 values showed a larger variation (5.27-26.84 s−1), giving an average value of 15.46 s−1 (the red dash line). The C-terminal sequence had R2 values larger than average, suggesting the presence of conformational exchange in this region.
Figure 5
Figure 5
Heterogeneous dynamics of different regions of CD3ε cytoplasmic domain measured by solvent PRE. (A) A schematic illustration of PRE effect measurement. (B) 1H-15N TROSY spectra of the hCD3εTMCD + POPG bicelle sample before (blue) and after (red) the addition of 15 mM TEMPOL. (C) The transverse PRE rates of the backbone amide protons (1HN-Γ2) of the hCD3εTMCD + POPG bicelle sample upon the addition of TEMPOL. The dotted bars meant that the PRE effect was too significant to be detected in the two time-points PRE measurement. The polyproline region and the first half of the ITAM (N55-K72, highlighted by red dash line), i.e., the secondary lipid-binding site, showed mild PRE effects (less dynamic). The second half of the ITAM (G73-I86), i.e., the C-terminal region, and the linker region showed stronger PRE effects (more dynamic). (D) Intensity ratio (I/I0) of the backbone amide groups in 1H-15N TROSY spectra before (Intensity value I0) and after (Intensity value I) the addition of TEMPOL. The PRE effects of the CD residues showed a similar tendency to C. Again, the secondary lipid-binding site showed the lowest dynamics while the C-terminal region showed the highest dynamics.
Figure 6
Figure 6
Regulation of the CD3ε cytoplasmic domain conformations by the secondary lipid-binding site. (A) The amino acid sequences of human hCD3εTMCD WT and Mut-sec peptides. The mutation sites were highlighted in red. (B) Superimposed 1H-15N HSQC spectra of hCD3εTMCD WT reconstituted in acidic POPG bicelle (q = 0.8) (black), reconstituted in zwitterionic POPC bicelle (q = 0.8) (blue), and hCD3εTMCD Mut-sec reconstituted in acidic POPG bicelle (q = 0.8) (red). (C-E) The signals of three representative residues, T42 in the N-terminal half of the cytoplasmic domain, Y67 and Y78 in the C-terminal half of the cytoplasmic domain, were enlarged and shown. The signals of T42 of the WT + POPG and Mut-sec + POPG samples appeared at almost the same positions, while the signal positions of Y67 and Y78 of the Mut-sec + POPG sample were close to the corresponding signals of the WT + POPC sample. (F) The ratio of the chemical shift difference (Δδ) induced by mutation (from WT to Mut-sec) against that induced by lipid environment (from POPG to POPC). Larger Δδ ratio value meant that the corresponding residue of the Mut-sec + POPG sample was more solvent-exposed. (G) Strips from aromatic NOESY spectra showing NOEs (distance of < 5 Å) between the aromatic protons Hδ/Hε of Y67 and Y78 and the methylene protons of the lipid acyl chains. Substantial NOE signals were detected for the WT + POPG sample whereas no NOE signals were detected for the Mut-sec + POPG sample, indicating that mutating key residues in the secondary lipid-binding site led to the dissociation of the ITAM from the membrane. These data suggested that mutating the secondary lipid-binding site changed the conformation of CD3ε cytoplasmic domain from State I to State II.
Figure 7
Figure 7
Different antigen stimulations stabilize CD3ε cytoplasmic domain at different conformations. (A) The typical images of dequenching TIRF-FRET measurement. Scale bar, 5 μm. It was a representative image of 70 images in one experiment, and this experiment was repeated for seven times. (B) The TIRF-FRET efficiency (upper) and DiI fluorescence intensity (lower) of cells stimulated by different antigens. The concentrations of antigens were 5 μg/ml. Each dot represented an individual cell. n = 71, 73, 72 for E1, G4, N4, respectively. Error bars represented mean ± SEM. P values were determined by the unpaired two-tailed Student's t-test (P value between G4 and N4 in the upper panel, all P values in the lower panel). The two-tailed Mann-Whitney test was used to determine the P values between E1 and G4 and between E1 and N4 in the upper panel. ***P < 0.001. n.s., not significant. Data are representative of seven independent experiments. (C) The TIRF-FRET efficiency (upper) and DiI fluorescence intensity (lower) of cells stimulated by different concentrations of N4 tetramers. Each dot represented an individual cell. n = 136, 146, 127 for 1, 5, 10 μg/ml, respectively. Error bars represented mean ± SEM. P values were determined by the two-tailed Mann-Whitney test. n.s., not significant. Data are representative of five independent experiments. (D) The TIRF-FRET efficiency (upper) and DiI fluorescence intensity (lower) of cells stimulated by different concentrations of G4 tetramers. Each dot represented an individual cell. n = 82, 70, 48 for 1, 5, 10 μg/ml, respectively. Error bars represented mean ± SEM. P values were determined by the unpaired two-tailed Student's t-test (P-value between 1 and 5 μg/ml in the upper panel, all P-values in the lower panel). The two-tailed Mann-Whitney test was used to determine the P-values between 1 and 10 μg/ml and between 5 and 10 μg/ml in the upper panels. n.s., not significant. Data are representative of six independent experiments.

References

    1. Birnbaum ME, Mendoza JL, Sethi DK, et al. Deconstructing the peptide-MHC specificity of T cell recognition. Cell 2014; 157:1073–1087. - PMC - PubMed
    1. Liu B, Chen W, Evavold BD, Zhu C. Accumulation of dynamic catch bonds between TCR and agonist peptide-MHC triggers T cell signaling. Cell 2014; 157:357–368. - PMC - PubMed
    1. O'Donoghue GP, Pielak RM, Smoligovets AA, Lin JJ, Groves JT. Direct single molecule measurement of TCR triggering by agonist pMHC in living primary T cells. Elife 2013; 2:e00778. - PMC - PubMed
    1. Huang J, Brameshuber M, Zeng X, et al. A single peptide-major histocompatibility complex ligand triggers digital cytokine secretion in CD4(+) T cells. Immunity 2013; 39:846–857. - PMC - PubMed
    1. Huang J, Zarnitsyna VI, Liu B, et al. The kinetics of two-dimensional TCR and pMHC interactions determine T-cell responsiveness. Nature 2010; 464:932–936. - PMC - PubMed

LinkOut - more resources